")
Back to Journals » OncoTargets and Therapy » Volume 12
Construction of a nomogram for the prediction of prognosis in patients with resectable gastric cancer undergoing fewer than sixteen lymph node biopsies
Received 17 May 2019
Accepted for publication 8 August 2019
Published 11 September 2019 Volume 2019:12 Pages 7415—7428
DOI https://doi.org/10.2147/OTT.S216086
Checked for plagiarism Yes
Review by Single anonymous peer review
Peer reviewer comments 2
Editor who approved publication: Dr Arseniy Yuzhalin
Zhe Li, Hong Cen
Department of Chemotherapy, Guangxi Medical University, Cancer Hospital, Nanning, Guangxi, People’s Republic of China
Correspondence: Hong Cen
Department of Chemotherapy, Guangxi Medical University, Cancer Hospital Nanning, Hedi71, Nanning, Guangxi 530021, People’s Republic of China
Tel +86 0 771 539 0813
Email [email protected]
Background: Lymph node metastases evaluation is important for assessing gastric cancer prognosis. In patients not undergoing adequate lymph node biopsy, lymph node stage migration occurs with the use of the existing staging system. This study established a prediction model to improve prognostication in patients undergoing fewer than 16 lymph nodes biopsy.
Patients and methods: In total, 3036 eligible patients from the Surveillance, Epidemiology, and End Results Program database were evaluated. They were randomized into development and validation sets in a 1:1 ratio (n=1520 and 1516, respectively). To avoid model overfitting and loss of important factors, prognostic factors related to overall survival (OS) were screened according to the Akaike information criterion. The nomogram was assessed using discrimination and consistency tests in the development and validation sets; the concordance index (C-index), calibration curves, and receiver operating characteristic (ROC) curves were also evaluated. Comparison with the 7th American Joint Committee on Cancer (AJCC) staging system was based on Kaplan–Meier curves, ROC, risk stratification, and decision curve analysis (DCA).
Results: Age, race, degree of differentiation, invasion depth, chemotherapy, radiotherapy, and lymph node ratio were independent prognostic factors in OS. C-indices of the development and validation sets were 0.759 (95% CI: 0.741–0.777) and 0.742 (95% CI: 0.713–0.771), respectively; calibration curves were approximately 45° diagonal, indicating good predictive ability of the nomogram. In contrast to the 7th AJCC staging system, the Kaplan–Meier curves and risk stratification of the nomogram had better discrimination ability, the ROC curves of the nomogram achieved more predictive accuracy, and the DCA indicated that the nomogram conferred higher net benefit.
Conclusion: Our constructed nomogram predicts the prognosis of patients with resectable gastric cancer undergoing biopsy of fewer than 16 lymph nodes more precisely and has better clinical applicability than the 7th AJCC staging system.
Keywords: gastric cancer, nomogram, lymph node ratio, overall survival
Introduction
Gastric cancer is the fifth most common malignancy in the world and ranks third in terms of cancer mortality.1 Surgery is the mainstay of treatment for gastric cancer. Postoperative pathological staging (pTMN staging) forms the basis for formulating subsequent treatment strategies. Currently, the American Joint Committee on Cancer (AJCC) pTMN is used as a basis, the 7th version of which was published in 2010.2 In patients undergoing surgery, studies have shown that both the depth of invasion (pT stage) of the primary lesions and lymph node metastases (pN stage) affect prognosis.3,4 The stage of lymph node metastasis is affected by the area of lymph node dissection, the number of examined lymph nodes (eLNs), and individual patient differences. These factors may result in possible errors in the final lymph node stage, that is, lymph node stage migration.
In the past 20 years, the main parameters used to assess stages of lymph node metastasis postoperatively included the area of lymph node metastasis, the number of metastatic lymph nodes (mLNs), lymph node ratio (LNR), and log odds of positive lymph nodes, among others. Currently, the most commonly used assessment method is based on the number of mLNs.5–8 The mLNs are positively correlated to the eLNs.9 An increase in the number of eLNs may decrease or eliminate lymph node stage migration.10 An inappropriately low number of eLNs is an important factor in causing stage migration.11,12 Studies have shown that compared with conventional staging systems, LNR, being a good prognostic factor, may aid in minimizing stage migration and predicting the prognosis of gastric cancer.13–16
Multiple prognostic factors may be included in a nomogram for quantifying the impact of these factors and allowing visualization of the result. This may be used for a personalized prediction of patient survival and is widely used in the evaluation of prognosis in patients with cancer.17–20 This study aimed to construct a nomogram containing LNR, based on a large population-based cohort. Additionally, it was compared with the 7th AJCC staging system to construct a prognostic model that may be effectively used to predict the survival of patients with gastric cancer undergoing insufficient eLNs.
Patients and methods
Patients
The data used in this study were taken from the Surveillance, Epidemiology, and End Results (SEER) database of the US National Cancer Institute. The SEER database includes the data of 3 million patients with cancer from different regions; it includes the cancer-related incidence and survival data of 28% of the US population. Our study is a retrospective analysis of the clinical data of patients with gastric cancer between 1998 and 2015. We obtained 114,231 patients on preliminary screening. The inclusion criteria were as follows: 1. age ≥18 years, 2. no previous history of cancer, 3. follow-up duration and terminal outcomes accurately recorded, 4. absence of distal metastases, 5. underwent surgery, 6. eLNs<16, and 7. complete clinicopathological information recorded. Patients with incomplete or unknown information were excluded. The included 3036 patients were diagnosed between 2010 and 2015. Patients were randomized into development (n=1520) and validation (n=1516) sets in a 1:1 ratio. The flow diagram of patient selection is shown in Figure 1.
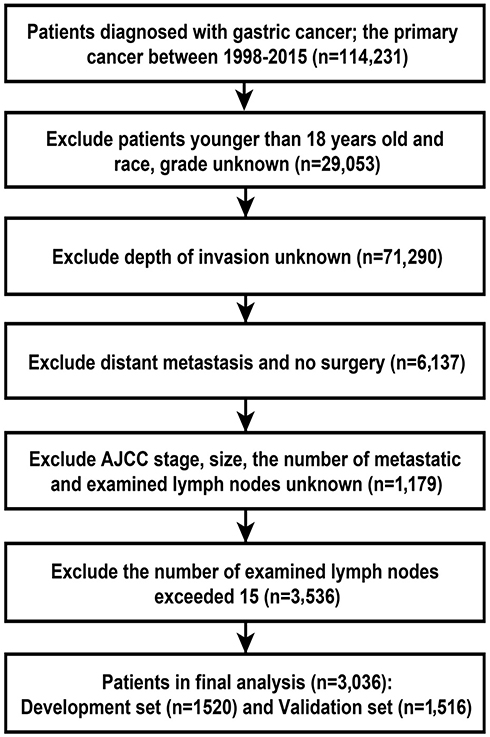 |
Figure 1 The flow diagram of patient selection. |
The data accessed from the SEER public database are freely available. We have obtained permission to access the research data with the user ID 13996-Nov2018. These data did not include human subjects or personal identification information. Therefore, further approval by an ethics committee and informed consent were not required in the study.
Nomogram construction and validation
The clinicopathological parameters previously reported to be associated with the prognosis of gastric cancer were selected for this study. These included age, sex, race, degree of differentiation, invasion depth, tumor size, mLNs, eLNs, chemotherapy, and radiotherapy. Cox multivariate regression analysis was performed on factors with a statistically significant difference in univariate analysis. Continuous variables (age and LNR) were incorporated using restricted cubic splines (RCS) to minimize the Akaike information criterion (AIC) statistic.21 For nonlinear effects, continuous variables were transformed into categorical variables to fit the linear assumption.22 In accordance with the AIC, the factors of the fitting model were screened out using the backward stepwise regression method to avoid overfitting and loss of important factors.
Every factor had its corresponding value in the nomogram, and the total score of each patient was used to predict the survival rate. Internal and external validations were performed using the development and validation sets, respectively, to validate the nomogram for discrimination and consistency. The C-index evaluation discrimination for the development set was initially calculated (values between 0.50–0.70, 0.71–0.90, and >0.90 indicated low, moderate, and adequate predictive capability, respectively).23 Bootstrapping was subsequently employed for resampling 1000 times to plot the calibration curves; this allowed evaluation of the consistency of survival probability between the nomogram-predicted values and actual values. Usually, the proximity between the curve and the 45° diagonal is directly proportional to the consistency. External validation involved the scoring of patients in the validation set based on the nomogram; before the C-index and calibration curves were used to assess the accuracy of the nomogram in the validation set, the score was used as a prognostic factor to be included in the Cox regression model.
Finally, we compared the prognostication of the nomogram and the 7th AJCC staging system. The survival curve of the nomogram, dividing the patents into quartiles according to the total scores, was compared with the AJCC staging system. The threshold of the total score was used to further divide the AJCC staging into low-risk and high-risk groups, and the HRs of the various groups were compared. The area under the receiver operating characteristic (ROC) curves of the two models were simultaneously compared to evaluate predictive ability. After determining the accuracy, decision curve analysis (DCA) was performed to compare the clinical validity of the two models.24
Statistical methods
The survival package of the R software (ver.3.5.0; The Institute for Statistical Computing, Vienna, Austria) was used to perform Cox multivariate regression analysis. The RCS, nomogram, C-index, and ROC curves were based on the survival, Hmisc, rms, and timeROC packages. The nomogramEX package was used to obtain the score for every factor. The setting of the threshold value was achieved using the X-tile software (ver.3.6.1; http://www.tissuearray.org/rimmlab/) package for risk stratification. The log-rank χ2 test was used to obtain the optimal threshold value based on the smallest P-value.25 The stdca package, downloaded from the website of the Memorial Sloan Kettering Cancer Center (http://www.mskcc.org/), was used to plot the decision curves. All other statistical analyses were completed using the SPSS 25.0 software package (SPSS, Chicago, IL, USA). All P-values were obtained from two-tailed tests, and a difference of <0.05 was considered to be statistically significant.
Results
Restricted cubic splines for nonlinear effect
No continuous variables showed linear effects on overall survival (OS) (Figure 2). The AIC statistics revealed the minimization with 4 knots for age (22341.03) and 6 knots for LNR (21969.58). For patients under approximately 70 years of age and when LNR was in the range of 0.25–0.5 and greater than 0.625, the log relative hazards of death were relatively consistent. Variable transformations were performed for age (18–40, 41–60, 61–70, 71–80, >80) and LNR (0–0.125, 0.125–0.25, 0.25–0.5, 0.5–0.625, 0.625–1), respectively.
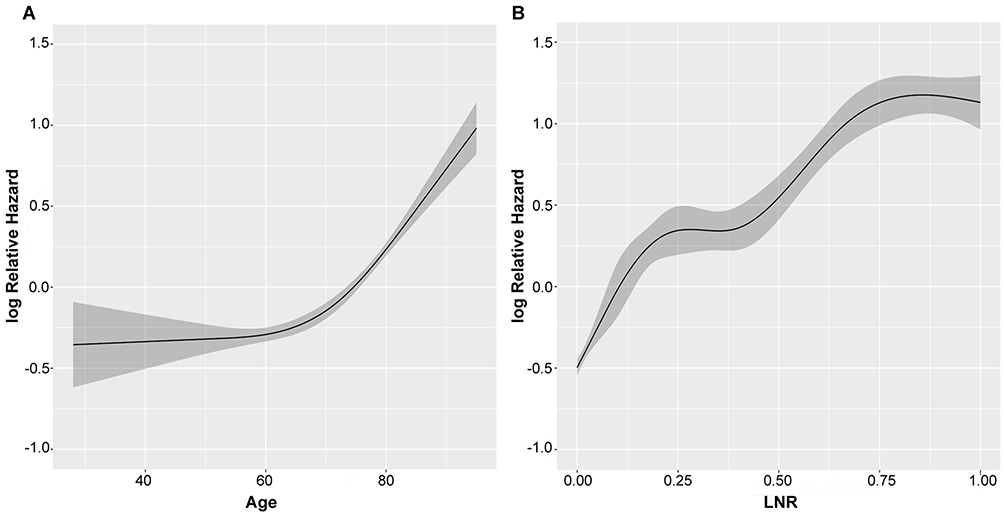 |
Figure 2 Restricted cubic splines for age and LNR. Notes: The optimized number of knots applied in survival analysis was 4, 6 for (A) age, (B) LNR.Abbreviation: LNR, lymph node ratio. |
Clinicopathological characteristics
Table 1 shows the clinicopathological characteristics of patients in the development and validation sets. There were no statistical differences between the different variables in the two sets (P>0.05). The cohort had a median age of 72 years (interquartile range: 62–80), with male predominance (58.8%); the gastric antrum was the most common site involved (41.3%), with grades III and IV being the most common degrees of tumor differentiation (63.4%). The depth of invasion most commonly extended to the mucosa and subserosa (29.2%+31.7%), and most tumors were ≤5 cm (70.7%). The 1-, 3-, and 5-year OS were 96.0%, 67.2%, and 35.5%, respectively.
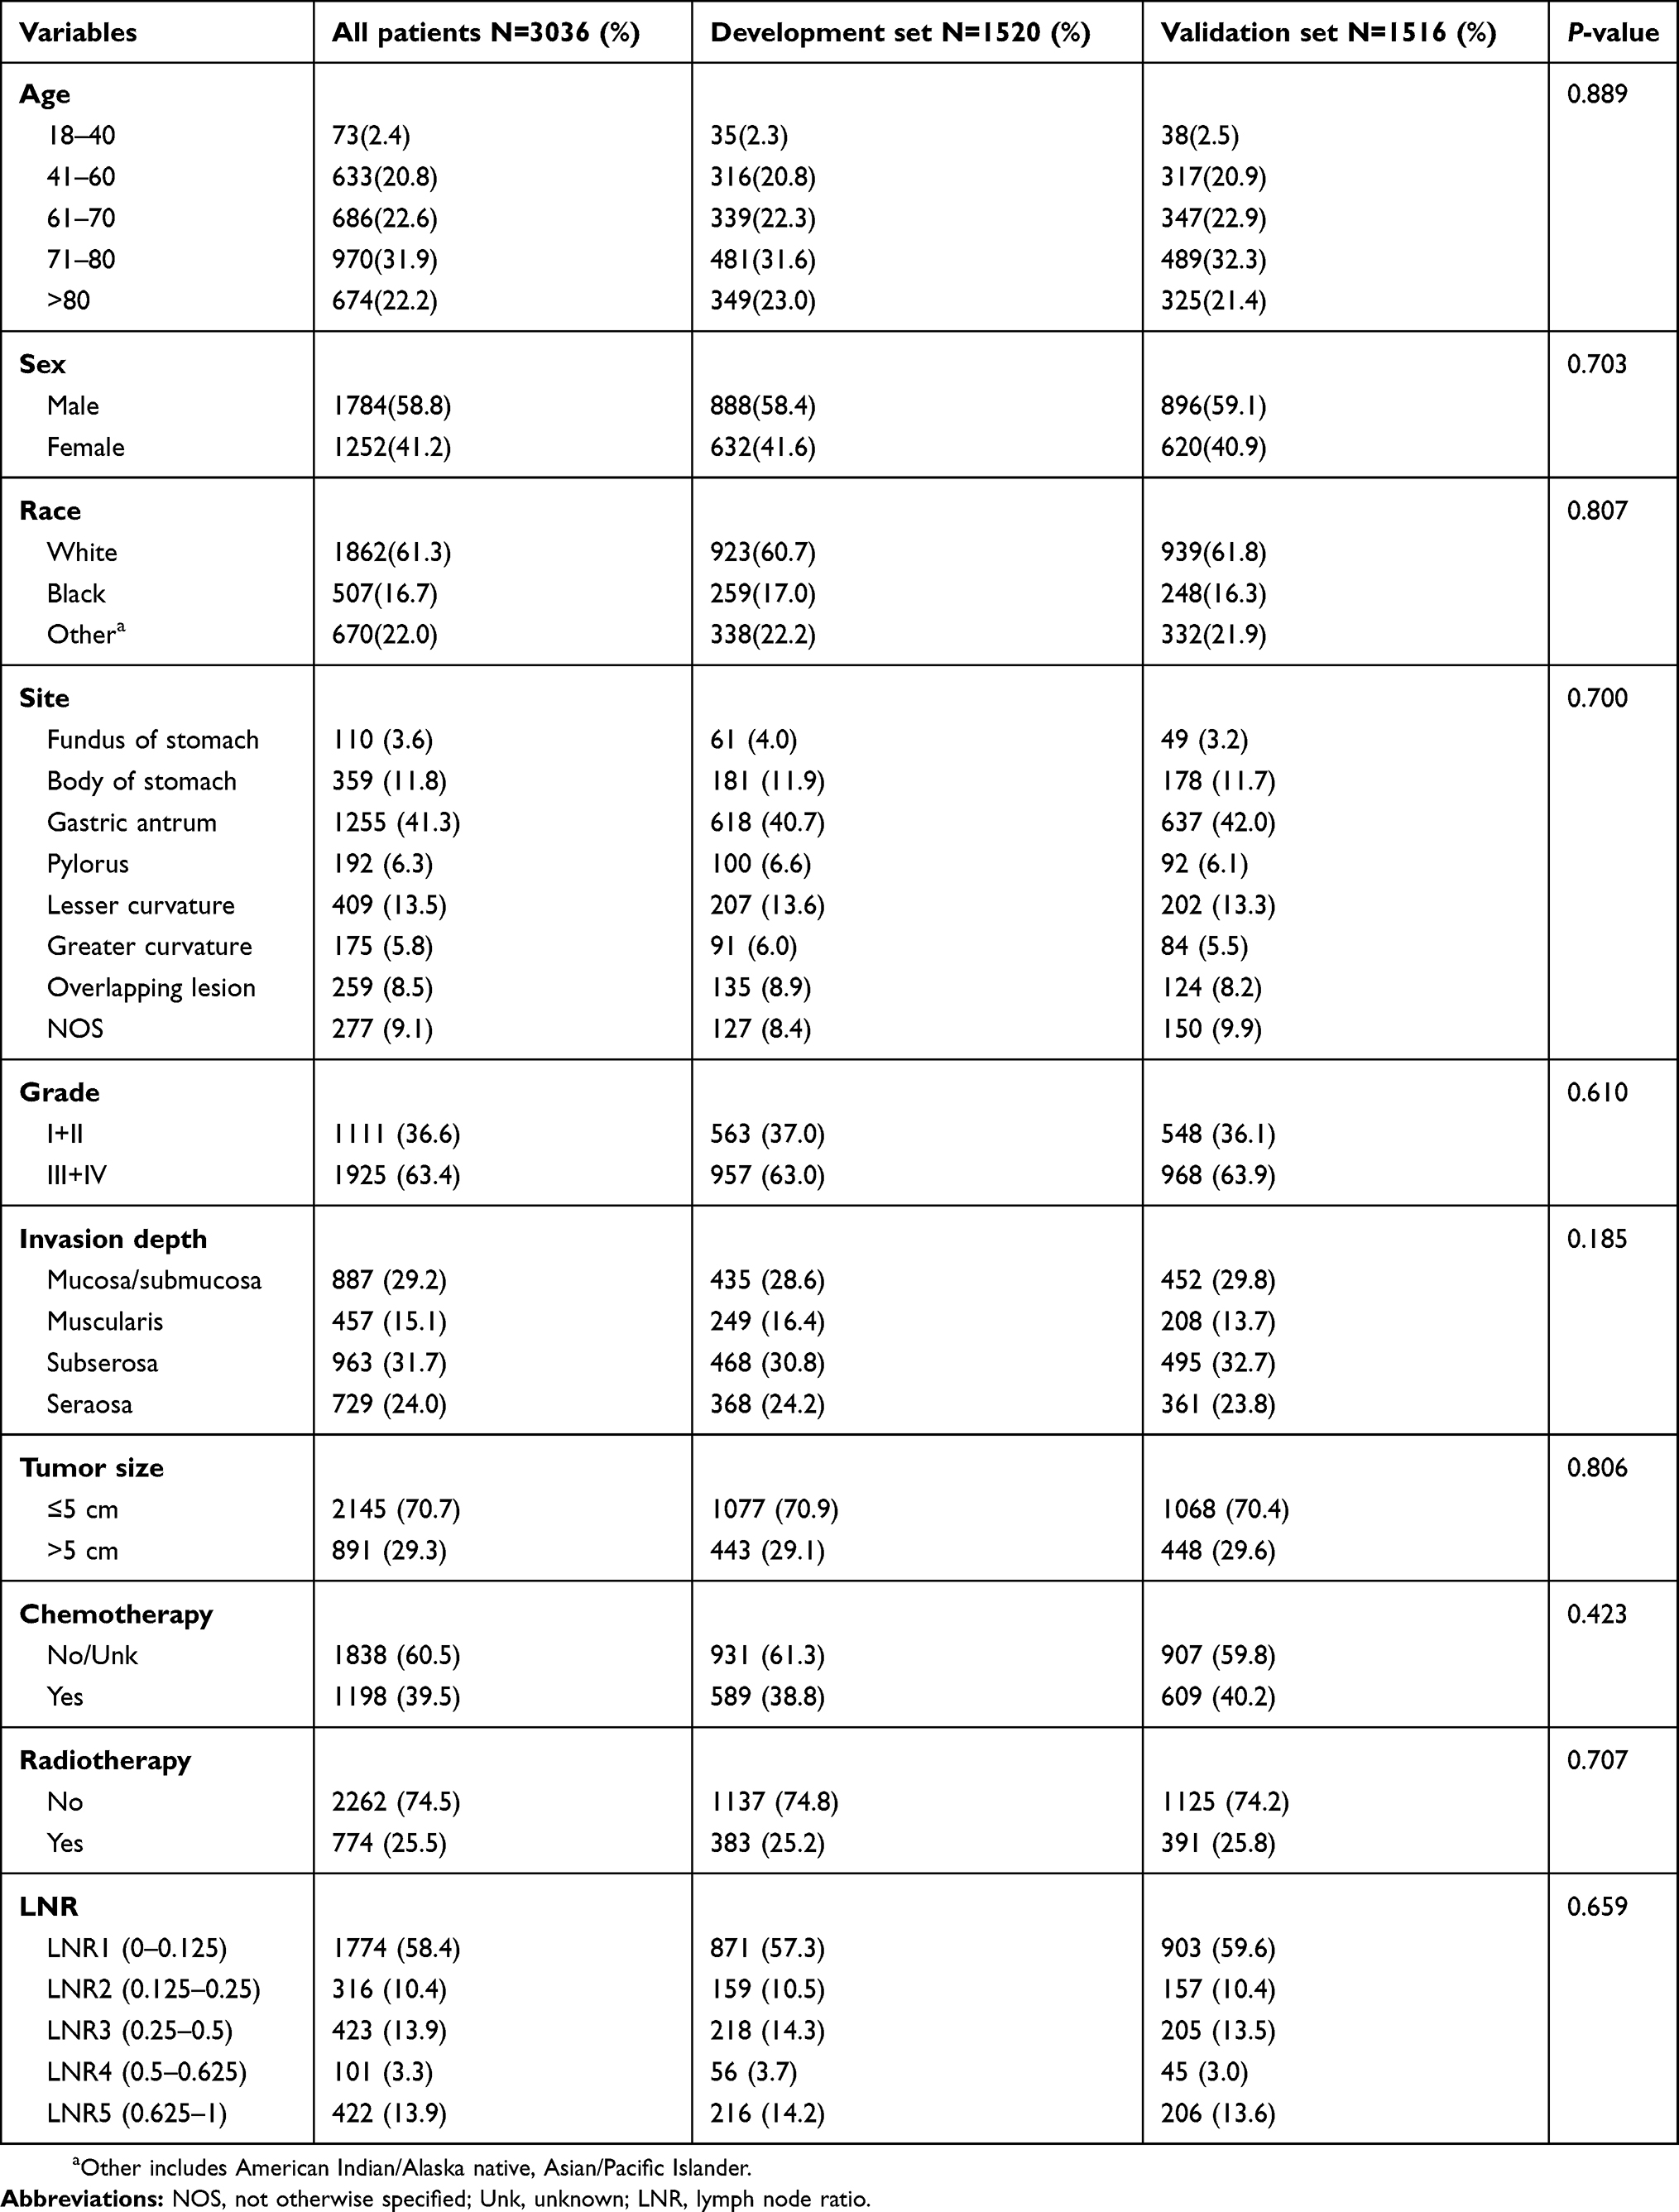 |
Table 1 Patients demographic and clinicopathological characteristics |
Nomogram construction and validation
Univariate analysis demonstrated that age, race, degree of differentiation, invasion depth, tumor size, and LNR were associated with OS. Several studies have shown that administration of radiotherapy or/and chemotherapy can improve the prognosis of patients undergoing surgery;26,27 hence, we still incorporated them into the multivariate analysis. Cox multivariate analysis was performed on the related factors (Table 2). Tumor size was not an independent prognostic factor, and Spearman correlation analysis furthermore showed that tumor size was positively correlated with invasion depth (r=0.426, p<0.001); however, tumor size was included in the model, minimizing AIC statistic (9668.015) can be achieved. Hence, 8 factors were eventually incorporated into the nomogram for predicting the 1-, 3-, and 5-year survival rates, namely, age, race, degree of differentiation, invasion depth, tumor size, chemotherapy, radiotherapy, and LNR (Figure 3). The score for individual factors in the nomogram may be determined by projecting upwards to points. The various scores were summated to obtain the total score. The downward projection of the total points may be used to determine the 1-, 3-, and 5-year OS for individual patients.
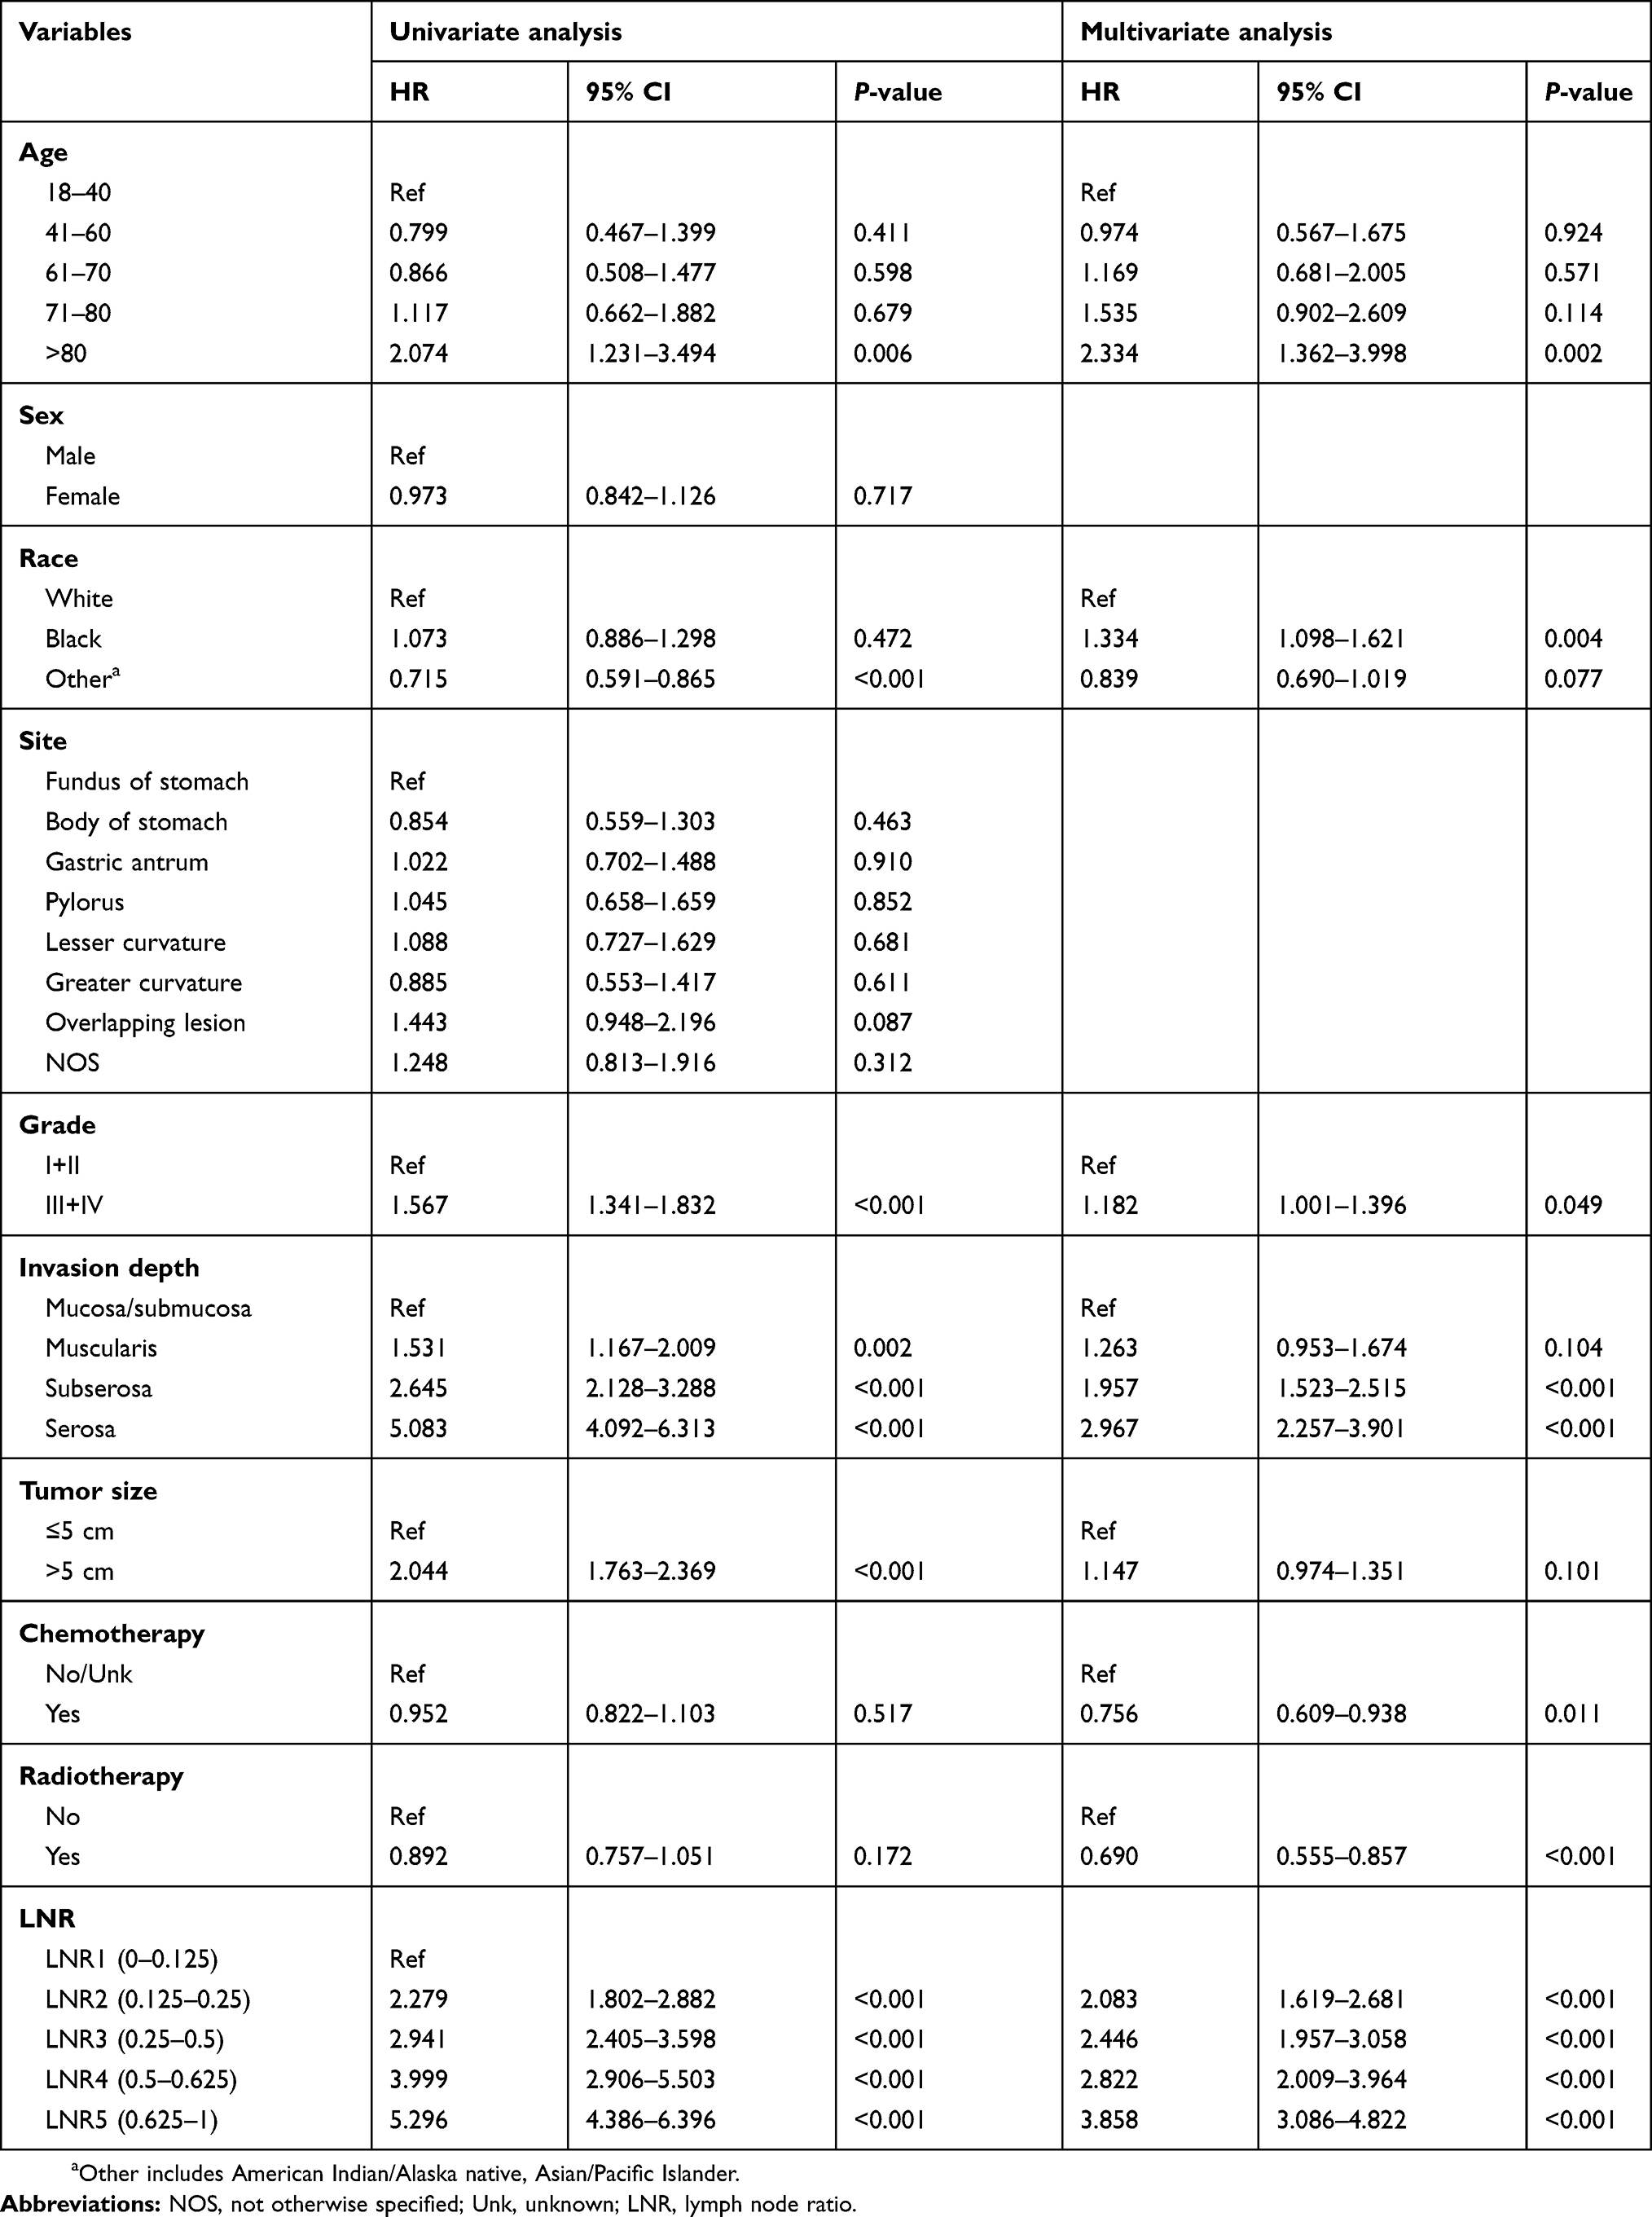 |
Table 2 Univariate and multivariate analyses in the developing set |
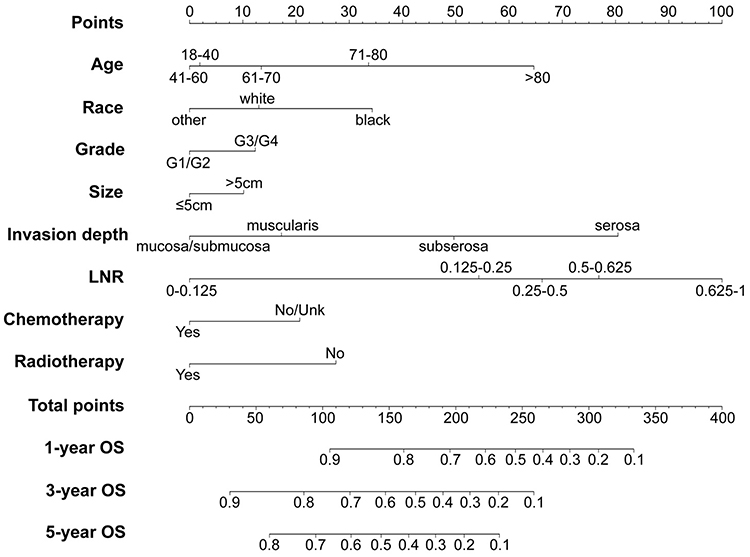 |
Figure 3 Nomogram for predicting 1-, 3-, and 5-year gastric cancer OS undergoing fewer than 16 eLNs. Abbreviations: eLNs, examined lymph node; LNR, lymph node ratio; OS, overall survival. |
The C-indices of the development and validation sets were 0.759 (95% CI: 0.741–0.777) and 0.742 (95% CI: 0.713–0.771), respectively, which indicated good predictive capability. Figure 4 shows the 1-, 3-, and 5-year calibration curves for the development and validation sets. The curves of the 2 sets are similar and close to the 45° diagonal, indicating consistency between the predicted and actual survival probabilities.
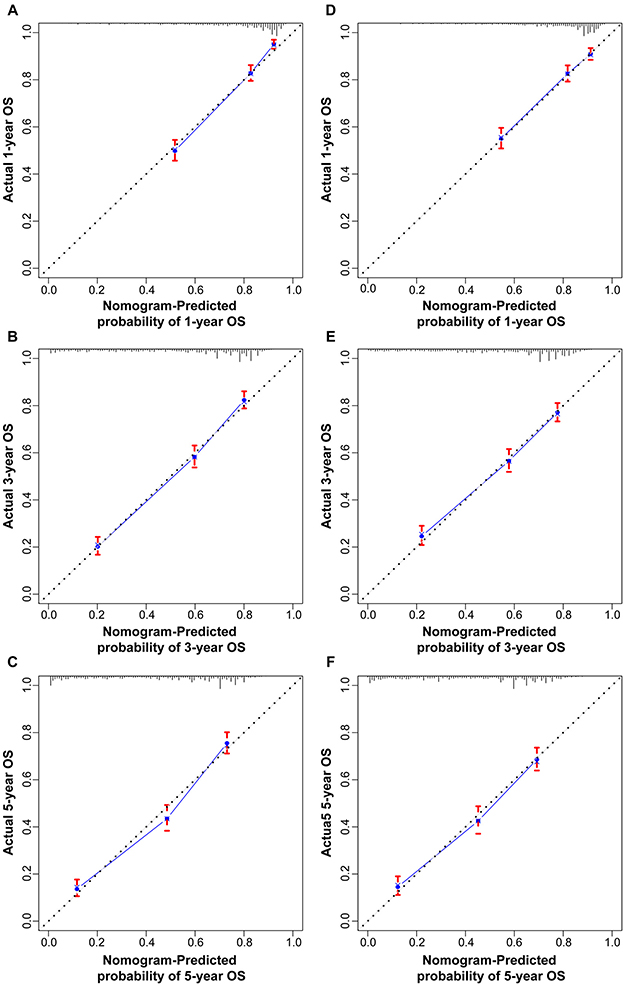 |
Figure 4 Calibration curves of the development and validation sets. Notes: (A) 1-year, (B) 3-year, and (C) 5-year OS calibration curves in development set. (D) 1-year, (E) 3-year, and (F) 5-year OS calibration curves in validation set.Abbreviation: OS, overall survival. |
Comparison of nomogram with the 7th staging system
The methods used to compare the prediction ability of the nomogram and the 7th AJCC staging system are described here. First, the total scores of the patients were used to group them by quartiles, and the Kaplan–Meier survival curve of the development set was plotted. This curve was well-suited to distinguish the survival of patients in different groups; the 5-year survival rates of quartiles 1–4 were 80.6%, 53.9%, 33.6%, and 8.6%, respectively. However, the discrimination ability of the 7th AJCC staging system was not as good as that of the nomogram (Figure 5). Second, the X-tile software package was used to set threshold values for the total score. Based on the same AJCC stage, the patients were divided into low-risk and high-risk groups; the HRs showed a significant difference, which reflected the good risk stratification ability of the nomogram (Table 3). Third, the area under the ROC curves of the nomogram was larger than that of the AJCC staging system, suggesting better predictive capabilities for 1-, 3-, and 5-year survival (Figure 6 and Table 4). Fourth, DCA was employed to assess the clinical validity of the prediction model. Comparison between the nomogram and the 7th AJCC staging system showed better net benefit with the nomogram. Therefore, the nomogram offers significantly greater clinical validity (Figure 7).
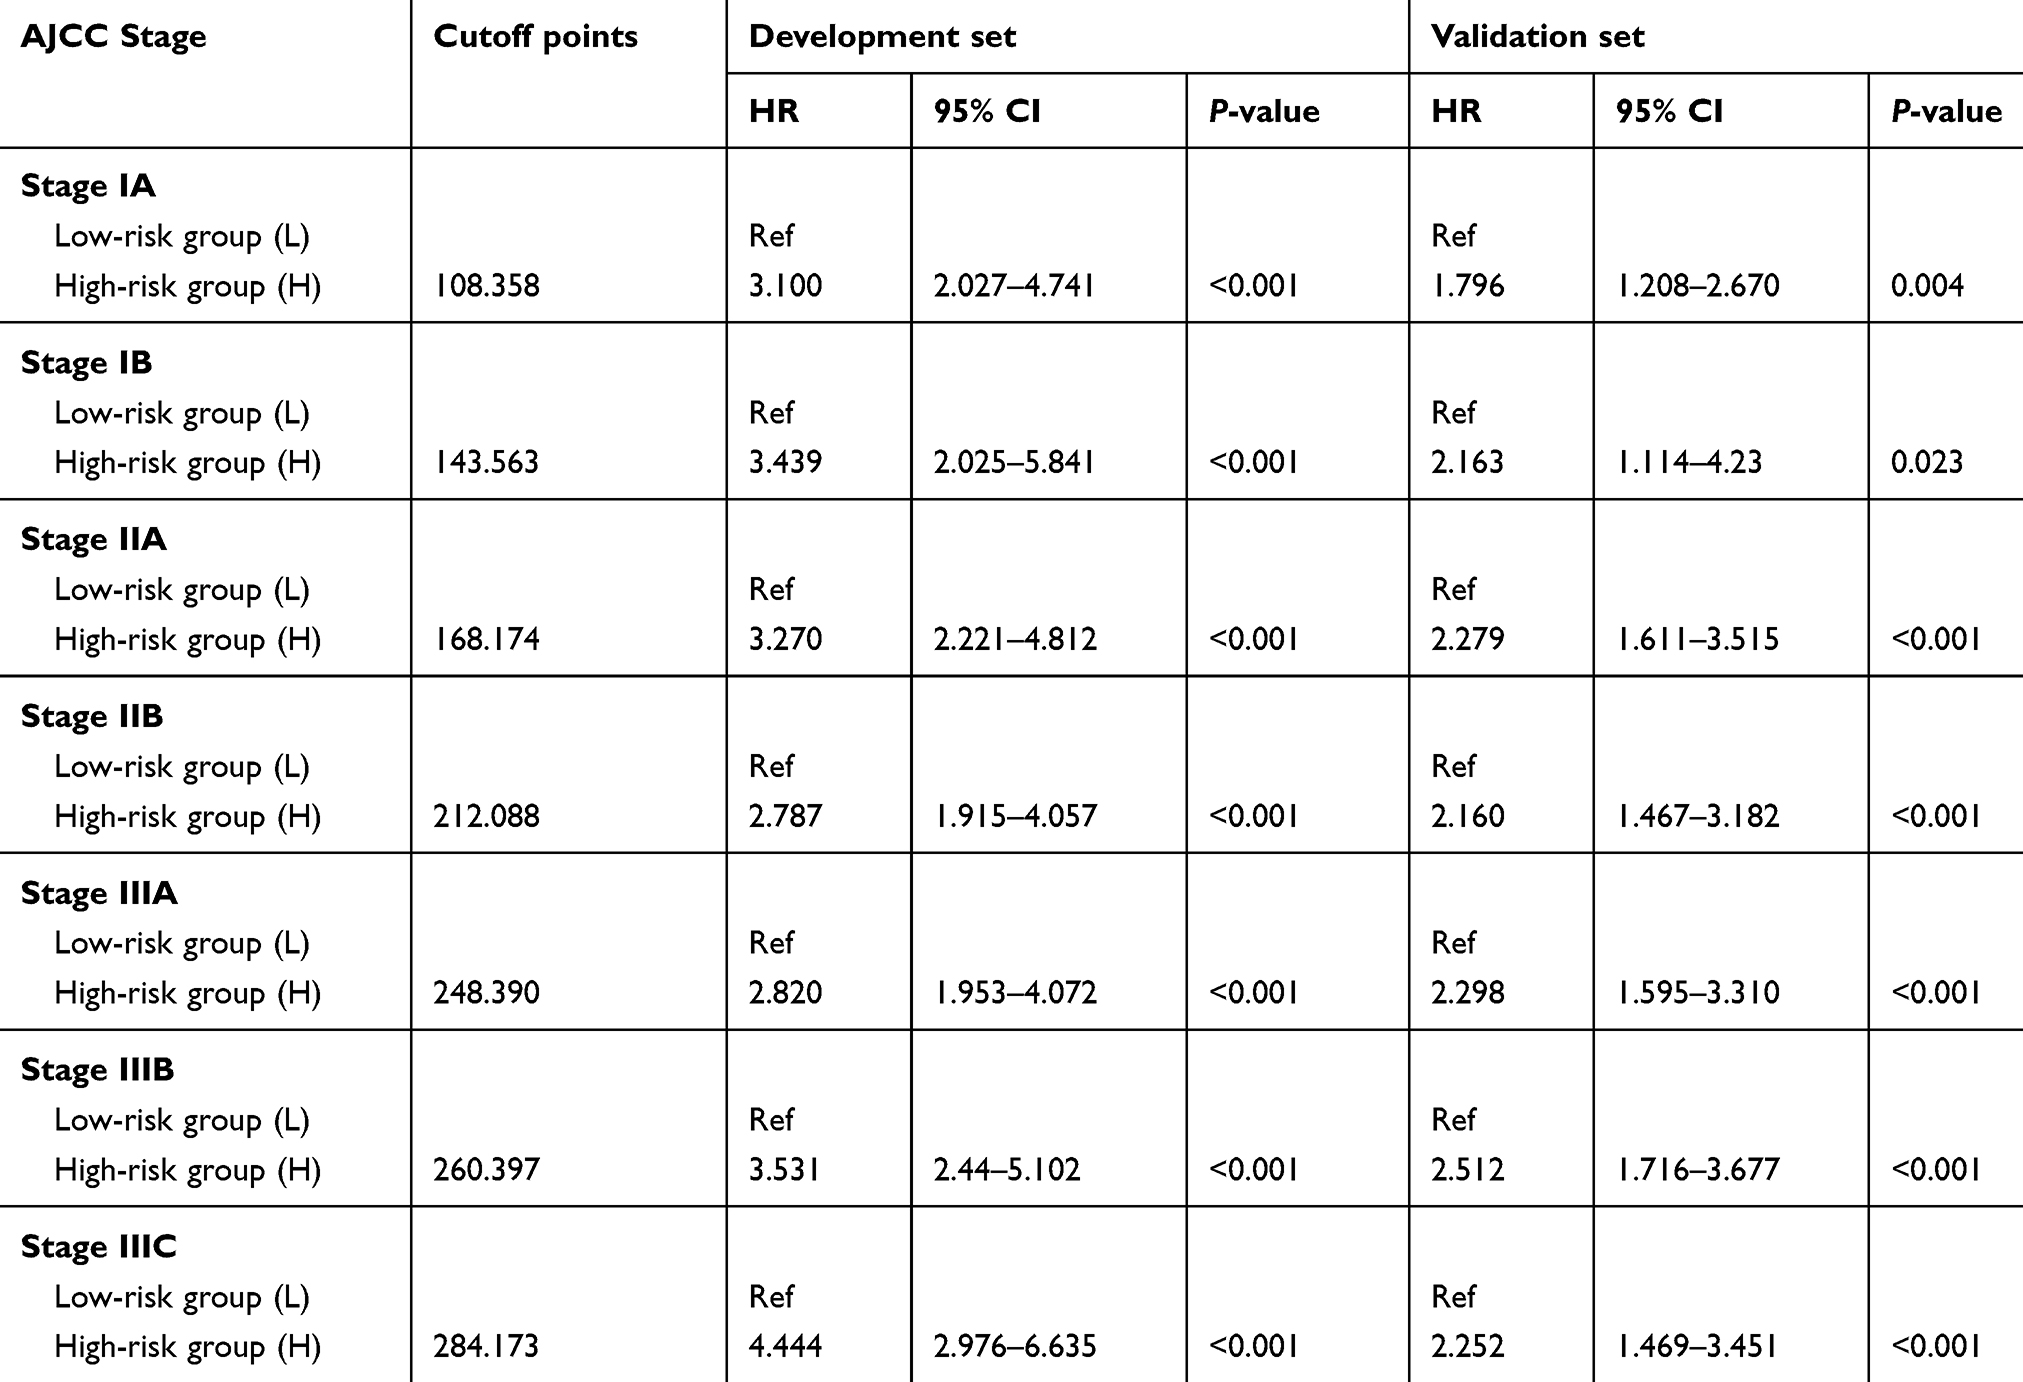 |
Table 3 Risk stratifications for each AJCC stage in development and validation sets |
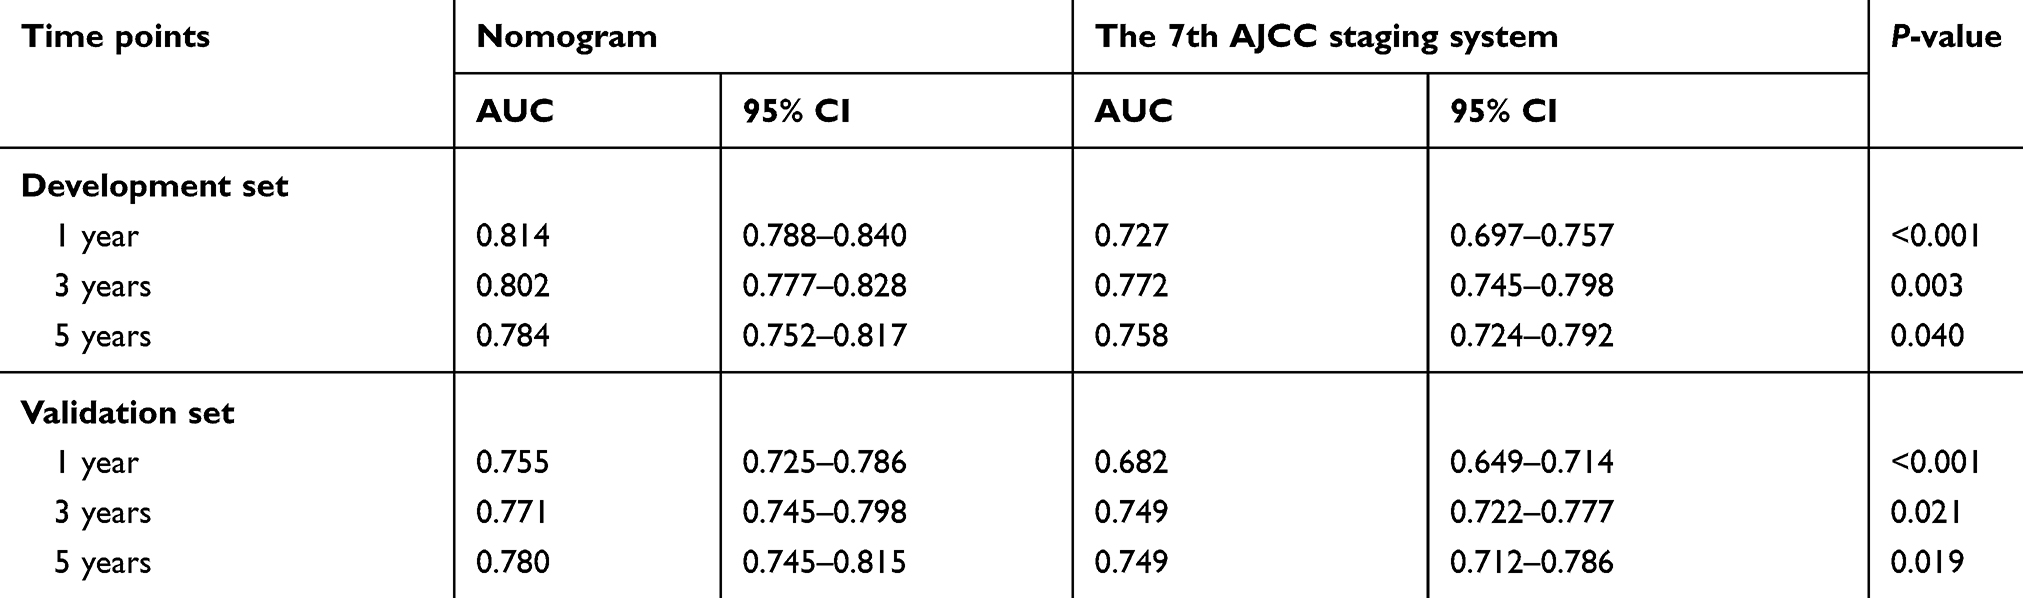 |
Table 4 Comparison of the areas under the ROC curves of nomogram and the 7th AJCC staging system in 1 year, 3 years, and 5 years |
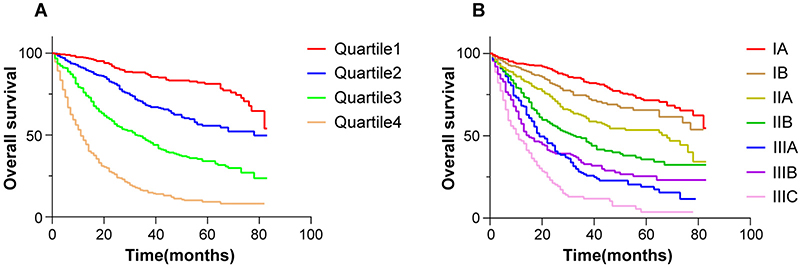 |
Figure 5 Kaplan–Meier survival curves of development set according to quartiles (A) and the 7th AJCC staging system (B). Abbreviation: AJCC, American Joint Committee on Cancer. |
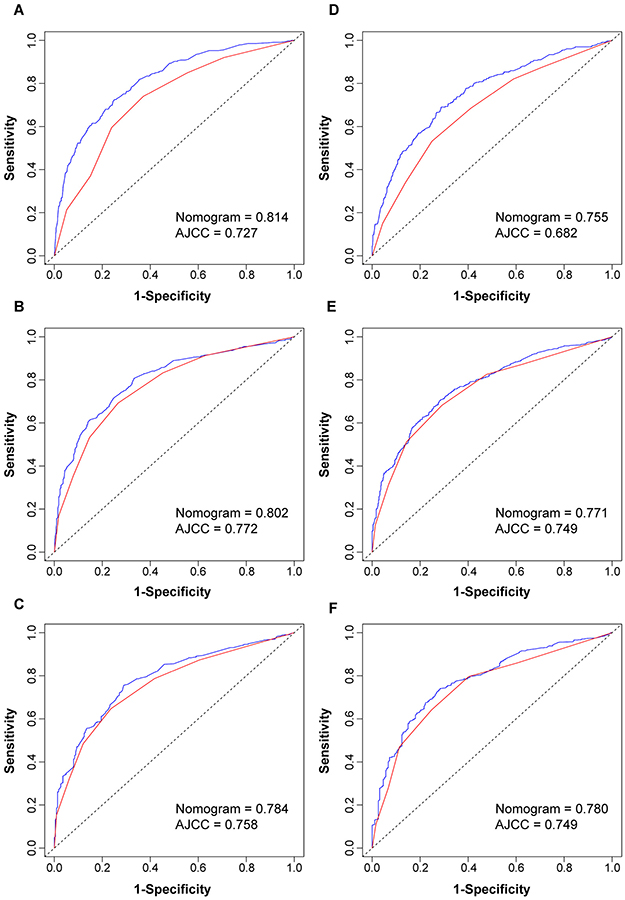 |
Figure 6 Comparison of the areas under the ROC curves of nomogram and the 7th AJCC staging system to prediction of OS at (A)1 year, (B) 3 years, and (C) 5 years in development set and (D)1 year, (E) 3 years, and (F) 5 years in validation set. Notes: Blue lines represent nomogram predicted OS. Red lines represent the 7th AJCC staging system predicted OS.Abbreviations: AUC, area under the curve; ROC, receiver-operating characteristic curve; OS, overall survival; AJCC, American Joint Committee on Cancer. |
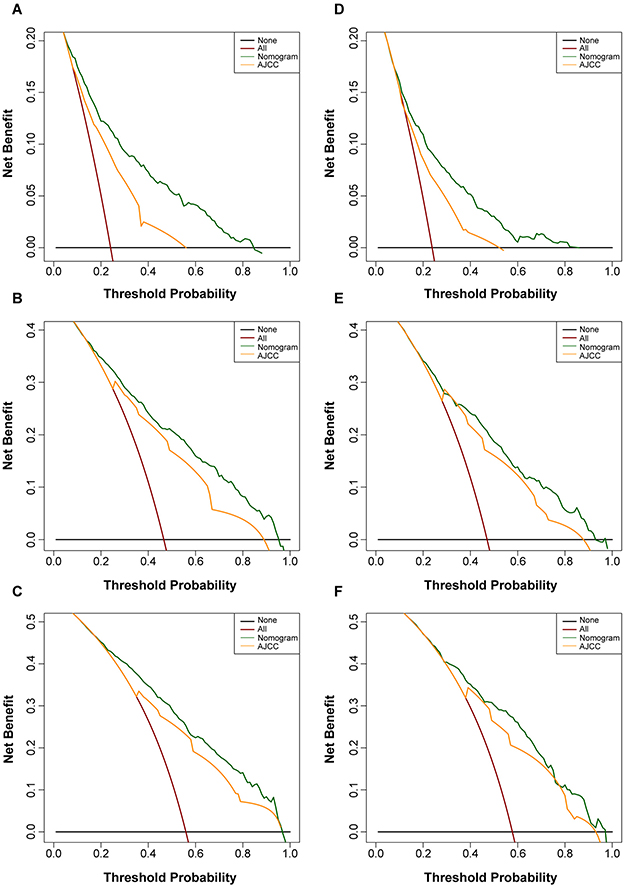 |
Figure 7 Comparison of the DCA of nomogram and the 7th AJCC staging system to evaluation of clinical validity at (A)1 year, (B) 3 years, and (C) 5 years in development set and (D)1 year, (E) 3 years, and (F) 5 years in validation set. Notes: Black lines represent no event occurring within a certain timespan. Crimson lines represent events occurring in all patients within a certain timespan. Green lines represent nomogram net benefit. Orange lines represent the 7th AJCC staging system net benefit. The higher green lines mean that nomogram has better net benefit.Abbreviations: DCA, decision curve analysis; AJCC, American Joint Committee on Cancer. |
Discussion
Gastric cancer has a high incidence and mortality rate, posing a considerable threat to human health. Accurate evaluation of stage is of vital importance in determining prognosis and deciding the treatment. Currently, the most commonly used staging system in clinical practice uses mLNs as a criterion for lymph node staging. However, mLNs tend to be affected by the number of eLNs and exhibit lymph node stage migration.
Smith et al found that the prognosis of patients with gastric cancer improves with an increase in every 10 lymph nodes examined.28 This is closely associated with stage migration and local disease control. Currently, a consensus has been reached on the extent of lymph node dissection, with D1+ and D2 lymph node dissection being usually used in early and advanced resectable gastric cancers, respectively.29 The 7th AJCC gastric cancer staging criteria recommend that the number of eLNs should not be fewer than 16. This is because proven metastases to least 16 lymph nodes are required to stage patients with pN3b disease. Moreover, reports have suggested that the survival of patients with 16 or more eLNs is better than that of patients with the number of eLNs fewer than 16.9 This suggests that an increase in the number of eLNs is beneficial for the prognosis of patients with gastric cancer. D2 lymph node dissection may be used to remove a larger number of metastatic lymph nodes, thereby decreasing lymph node stage migration after radical surgery. This will increase the accuracy of postoperative pathological staging and prognostication.30
However, more extensive lymph node dissection will increase the postoperative mortality rate and the risk of complications.31 The rarity of this dissection, poor surgical technique, and inadequate experience with perioperative management mainly contribute to these unfavorable outcomes. Owing to this, many consider D1 as the standard of lymph node dissection for radical surgery in gastric cancer. This increases the incidence of lymph node stage migration and reduces the accuracy of prognostication.
Inoue et al first proposed the use of LNR to predict the prognosis of patients with gastric cancer.32 Other studies suggested that LNR-based lymph node staging may decrease bias, is simpler, is more accurate than the 6th AJCC staging system, and is effective as a prognostic marker in cases where the number of eLNs fewer than 15.33–35 A meta-analysis that included 27 studies showed that LNR is an independent prognostic factor; it has been suggested that LNR should be included in future staging systems for gastric cancer.36 Spearman correlation analysis in our study showed that the correlation between the LNR and number of eLNs was lower than that observed between the number of mLNs and eLNs (r=0.094 vs r=0.244). Since pN staging is based on the number of mLNs, the pTNM staging criteria of the AJCC lead to lymph node stage migration in cases with inadequate lymph node biopsy. Therefore, LNR may be a better marker for this prediction model.
Many specialized prognostic models have been successively proposed to improve prognostication in gastric cancer. Studies have shown that the prognosis of patients with resectable gastric cancer is associated with many factors including age, race, tumor site, degree of differentiation, invasion depth, vascular invasion, tumor size, method of lymph node dissection, and the numbers of eLNs and mLNs.37–39 In one study, both eLNs and mLNs were simultaneously included in the nomogram to reduce lymph node stage migration. However, the number of patients in that study was small, and the relationship between eLNs and mLNs was not considered in the regression model.39 Another study included LNR and compared it with conventional prognostic systems, demonstrating better predictive ability.40 However, their subjects were all patients undergoing surgery. Therefore, a better prognostic model is urgently needed to reduce lymph node stage migration in patients with gastric cancer undergoing fewer than 16 lymph nodes biopsy.
Our findings showed that race was an independent prognostic factor, and the prognosis was better for others (American Indian/Alaska native, Asian/Pacific Islander) than whites or blacks. The result was consistent with those of previous studies.41 This may be related to different genetic backgrounds among different races. However, another study showed that race has less influence over outcomes the longer patients survive.42 The reasons for the reduction of racial disparities remain unclear and warrant future study.
Based on the Cox multivariate regression analysis, and according to the AIC, we finally incorporated age, race, degree of differentiation, invasion depth, tumor size, chemotherapy, radiotherapy, and LNR into the nomogram. The nomogram showed good predictive ability in discrimination and consistency between the development and validation sets. Furthermore, in contrast with the 7th AJCC staging system, the nomogram showed better predictive ability and clinical validity.
Our study shows that the nomogram may further divide patients with the same AJCC staging group into high-risk and low-risk groups; this may improve understanding of the variable prognosis within the same stage. Accordingly, patients with higher scores should be offered rigorous follow-up or further postoperative consolidation treatment.
Usually, the prediction ability of different models is compared by the area under the ROC curves. However, high predictive accuracy is not necessarily associated with clinical utility. False positives and false negatives are inevitable irrespective of the threshold value. Since the models offering more benefit are still unknown, we employed DCA to identify the models that may maximize net benefit among patients. In Figure 7, black and crimson represent the two extremes; the former represents no event occurring within a certain time span, while the latter represents events occurring in all patients within a certain timespan. The closer the 2 extreme curves are, the lower is the clinical application value. The DCA showed that the nomogram may offer higher net benefits in patients with gastric cancer undergoing fewer than 16 lymph nodes biopsy.
This study has some limitations. The first limitation is the definition of the LNR threshold. In our study, in accordance with RCS, LNR was converted to categorical variable (0–0.125, 0.125–0.25,0.25–0.5, 0.5–0.625, 0.625–1). The set threshold values are different from those of previous studies.40,43 At present, a unified standard for setting threshold values is lacking. This limits the promotion and application of the LNR. Further analysis of large-scale multicenter data is needed to determine the optimal threshold value for LNR. Second, our study subjects were from a single dataset, and an independent validation dataset for effective validation was lacking. In addition, being a retrospective study, the introduction of bias was inevitable. Further prospective studies with larger sample sizes will be needed for validation of these results. Lastly, recent studies have proven that laparoscopic surgery has a positive effect on prognosis.44 Fewer postoperative complications may reduce mortality in older patients. However, the SEER database did not provide details on laparoscopic surgery in these patients. Therefore, this may have affected the accuracy of the prediction model.
Conclusion
In conclusion, our study was based on the SEER database and analyzed patients undergoing a biopsy of fewer than 16 lymph nodes. Our results show that age, race, invasion depth, degree of differentiation, chemotherapy, radiotherapy, and LNR are independent prognostic factor in OS. The nomogram, constructed based on these factors including tumor size, underwent validation and demonstrated good predictive ability; its prediction accuracy and clinical validity are better than that of the 7th AJCC staging system. Further research is required on LNR-based nomograms to provide evidence for prognostication and guidance on treatment.
Acknowledgment
The authors would like to thank Editage for English language editing.
Disclosure
The authors report no conflicts of interest in this work.
References
1. Torre LA, Siegel RL, Ward EM, et al. Global cancer incidence and mortality rates and trends-an update. Cancer Epidemiol Biomarkers Prev. 2016;25(1):16–27. doi:10.1158/1055-9965.EPI-15-0578
2. Washington K. 7th edition of the AJCC cancer staging manual: stomach. Ann Surg Oncol. 2010;17(12):3077–3079. doi:10.1245/s10434-010-1362-z
3. Liu L, Hao H, Zhao L, et al. Analysis of survival and prognosis of 298 gastric adenocarcinoma patients with no distant metastasis. Oncol Lett. 2017;14(6):7813–7816. doi:10.3892/ol.2017.7202
4. Jian-Hui C, Shi-Rong C, Hui W, et al. Prognostic value of three different lymph node staging systems in the survival of patients with gastric cancer following D2 lymphadenectomy. Tumour Biol. 2016;37(8):11105–11113. doi:10.1007/s13277-015-4191-7
5. Deng J, Liang H, Sun D, et al. The prognostic analysis of lymph node-positive gastric cancer patients following curative resection. J Surg Res. 2010;161(1):47–53. doi:10.1016/j.jss.2008.12.019
6. Liu H, Deng J, Zhang R, et al. The RML of lymph node metastasis was superior to the LODDS for evaluating the prognosis of gastric cancer. Int J Surg. 2013;11(5):419–424. doi:10.1016/j.ijsu.2013.03.009
7. Cheong O, Oh ST, Kim BS, et al. Large metastatic lymph node size, especially more than 2 cm: independent predictor of poor prognosis in node-positive gastric carcinoma. World J Surg. 2008;32(2):262–266. doi:10.1007/s00268-007-9158-4
8. Deng J, Liang H. Discussion of the applicability of positive lymph node ratio as a proper N-staging for predication the prognosis of gastric cancer after curative surgery plus extended lymphadenectomy. Ann Surg. 2012;256(6):e35–e36. doi:10.1097/SLA.0b013e3182769545
9. Deng J, Zhang R, Pan Y, et al. Comparison of the staging of regional lymph nodes using the sixth and seventh editions of the tumor-node-metastasis (TNM) classification system for the evaluation of overall survival in gastric cancer patients: findings of a case-control analysis involving a single institution in China. Surgery. 2014;156(1):64–74. doi:10.1016/j.surg.2014.03.020
10. de Manzoni G, Verlato G, Roviello F, et al. The new TNM classification of lymph node metastasis minimises stage migration problems in gastric cancer patients. Br J Cancer. 2002;87(2):171–174. doi:10.1038/sj.bjc.6600432
11. Bando E, Yonemura Y, Taniguchi K, et al. Outcome of ratio of lymph node metastasis in gastric carcinoma. Ann Surg Oncol. 2002;9:775–784. doi:10.1007/BF02574500
12. Kong SH, Lee HJ, Ahn HS, et al. Stage migration effect on survival in gastric cancer surgery with extended lymphadenectomy: the reappraisal of positive lymph node ratio as a proper N-staging. Ann Surg. 2012;255:50–58. doi:10.1097/SLA.0b013e31821d4d75
13. Agnes A, Biondi A, Cananzi FM, et al. Ratio-based staging systems are better than the 7th and 8th editions of the TNM in stratifying the prognosis of gastric cancer patients: A multicenter retrospective study. J Surg Oncol. 2019. [Epub ahead of print]. doi:10.1002/jso.25411
14. Wang ZX, Qiu MZ, Jiang YM, et al. Comparison of prognostic nomograms based on different nodal staging systems in patients with resected gastric cancer. J Cancer. 2017;8(6):950–958. doi:10.7150/jca.17370
15. Muneoka Y, Akazawa K, Ishikawa T, et al. Nomogram for 5-year relapse-free survival of a patient with advanced gastric cancer after surgery. Int J Surg. 2016;35:153–159. doi:10.1016/j.ijsu.2016.09.080
16. Lorenzon L, Mercantini P, Ferri M, et al. Lymph-node ratio classification strongly correlates with cancer survivals of patients who underwent r0 resection for gastric cancer with more than 15 nodes harvested. Eur Surg Res. 2014;53(1–4):1–10. doi:10.1159/000360937
17. Balachandran VP, Gonen M, Smith JJ, et al. Nomograms in oncology: more than meets the eye. Lancet Onco. 2015;16(4):e173–e180. doi:10.1016/S1470-2045(14)71116-7
18. Liang W, Zhang L, Jiang G, et al. Development and validation of a nomogram for predicting survival in patients with resected nonsmall-cell lung cancer. J Clin Oncol. 2015;33(8):861–869. doi:10.1200/JCO.2014.56.6661
19. Song W, Miao DL, Chen L. monogram nomogram for predicting survival in patients with pancreatic cancer. Onco Targets Ther. 2018;11:539–545. doi:10.2147/OTT.S154599
20. Guan YJ, Fang SY, Chen LL, et al. Development and validation of prognostic nomograms for medullary thyroid cancer. Onco Targets Ther. 2019;12:2299–2309. doi:10.2147/OTT.S196205
21. Harrell F. Regression Modeling Strategies: Withapplications to Linear Models, Logistic Andordinal Regression, and Survival Analysis. Springer; 2015. Available from: http://www.springer.com/gb/book/9783319194240.
22. Han DS, Suh YS, Kong SH, et al. Nomogram predicting long-term survival after d2 gastrectomy for gastric cancer. J Clin Oncol. 2012;30(31):3834–3840. doi:10.1200/JCO.2012.41.8343
23. Wolbers M, Koller MT, Witteman JC, et al. Prognostic models with competing risks: methods and application to coronary risk prediction. Epidemiology. 2009;20(4):555–561. doi:10.1097/EDE.0b013e31819f38f1
24. Vickers AJ, Elkin EB. Decision curve analysis: a novel method for evaluating prediction models. Med Decis Making. 2006;26:565–574. doi:10.1177/0272989X06295361
25. Camp RL, Dolled-Filhart M, Rimm DL. X-tile: a new bio-informatics tool for biomarker assessment and outcomebased cut-point optimization. Clin Cancer Res. 2004;10:7252–7259. doi:10.1158/1078-0432.CCR-04-0713
26. Chang SC, Liu KH, Hung CY, et al. Adjuvant chemotherapy improves survival in stage III gastric cancer after D2 surgery. J Cancer. 2018;9(1):81–91. doi:10.7150/jca.21989
27. Stumpf PK, Amini A, Jones BL, et al. Adjuvant radiotherapy improves overall survival in patients with resected gastric adenocarcinoma: a national cancer data base analysis. Cancer. 2017;123(17):3402–3409. doi:10.1002/cncr.30748
28. Smith DD, Schwarz RR, Schwarz RE. Impact of total lymph node count on staging and survival after gastrectomy for gastric cancer: data from a large US-population database. J Clin Oncol. 2005;23(28):7114–7124. doi:10.1200/JCO.2005.14.621
29. Kodera Y .The current state of stomach cancer surgery in the world. Jpn J Clin Oncol.2016;46:1062–1071. [Epub ahead of print]. doi:10.1093/jjco/hyw117
30. Deng J. Progress in studies on lymphatic metastasis of gastric cancer. Clin Oncol China. 2012;39(20):1489–1491.
31. Shen Z, Ye Y, Xie Q, et al. Effect of the number of lymph nodes harvested on the long-term survival of gastric cancer patients according to tumor stage and location: a 12-year study of 1,637 cases. Am J Surg. 2015;210(3):431–440. doi:10.1016/j.amjsurg.2015.01.029
32. Inoue K, Nakane Y, Iiyama H, et al. The superiority of ratio-based lymph node staging in gastric carcinoma. Ann Surg Oncol. 2002;9(1):27–34.
33. Taghizadeh-Kermani A, Yahouiyan SZ, AliAkbarian M, et al. Prognostic significance of metastatic lymph node ratio in patients with gastric cancer: an evaluation in north-East of iran. Iran J Cancer Prey. 2014;7(2):73–79.
34. Zhang H, Chen C, Yue J, et al. Effect of number of metastatic lymph nodes and metastatic lymph node ratio on the prognosis in patients with adenocarcinoma of the esophagogastric junction after curative resection. Zhonghua Zhong Liu Za Zhi. 2014;36(2):141–146.
35. Kutlu OC, Watchell M, Dissanaike S. Metastatic lymph node ratio successfully predicts prognosis in western gastric cancer patients. Surg Oncol. 2015;24(2):84–88. doi:10.1016/j.suronc.2015.03.001
36. Zhu J, Xue Z, Zhang S, et al. Integrated analysis of the prognostic role of the lymph node ratio in node-positive gastric cancer: a meta-analysis. Int J Surg. 2018;57:76–83. doi:10.1016/j.ijsu.2018.08.002
37. Liu J, Geng Q, Liu Z, et al. Development and external validation of a prognostic nomogram for gastric cancer using the national cancer registry. Oncotarget. 2016;7(24):35853–35864. doi:10.18632/oncotarget.8221
38. Eom BW, Ryu KW, Nam BH, et al. Survival nomogram for curatively resected Korean gastric cancer patients: multicenter retrospective analysis with external validation. PLoS One. 2015;10(2):e0119671. doi:10.1371/journal.pone.0119671
39. Wang PL, Xiao FT, Gong BC, et al. A nomogram for predicting overall survival of gastric cancer patients with insufficient lymph nodes examined. J Gastrointest Surg. 2017;21(6):947–956. doi:10.1007/s11605-017-3401-6
40. Kim Y, Spolverato G, Ejaz A, et al. A nomogram to predict overall survival and disease-free survival after curative resection of gastric adenocarcinoma. Ann Surg Oncol. 2015;22(6):1828–1835. doi:10.1245/s10434-014-4230-4
41. Wang A, Squires MH
42. Luyimbazi D, Nelson RA, Choi AH, et al. Estimates of conditional survival in gastriccancer reveal a reduction of racial disparities with long-term follow-up. J Gastrointest Surg. 2015;19(2):251–257. doi:10.1007/s11605-014-2688-9
43. Kim Y, Squires MH, Poultsides GA, et al. Impact of lymph node ratio in selecting patients with resected gastric cancer for adjuvant therapy. Surgery. 2017;162(2):285–294. doi:10.1016/j.surg.2017.03.023
44. Yamamoto M, Shimokawa M, Kawano H, et al. Benefits of laparoscopic surgery compared to open standard surgery for gastric carcinoma in elderly patients: propensity score-matching analysis. Surg Endosc. 2019;33(2):510–519. doi:10.1007/s00464-018-6325-7
 © 2019 The Author(s). This work is published and licensed by Dove Medical Press Limited. The full terms of this license are available at https://www.dovepress.com/terms.php and incorporate the Creative Commons Attribution - Non Commercial (unported, v3.0) License.
By accessing the work you hereby accept the Terms. Non-commercial uses of the work are permitted without any further permission from Dove Medical Press Limited, provided the work is properly attributed. For permission for commercial use of this work, please see paragraphs 4.2 and 5 of our Terms.
© 2019 The Author(s). This work is published and licensed by Dove Medical Press Limited. The full terms of this license are available at https://www.dovepress.com/terms.php and incorporate the Creative Commons Attribution - Non Commercial (unported, v3.0) License.
By accessing the work you hereby accept the Terms. Non-commercial uses of the work are permitted without any further permission from Dove Medical Press Limited, provided the work is properly attributed. For permission for commercial use of this work, please see paragraphs 4.2 and 5 of our Terms.