")
Back to Journals » International Journal of General Medicine » Volume 14
Construction of a Ferroptosis-Related Gene Signature for Head and Neck Squamous Cell Carcinoma Prognosis Prediction
Authors Li Q, Jin Y, Shen Z , Liu H, Shen Y, Wu Z
Received 23 October 2021
Accepted for publication 8 December 2021
Published 21 December 2021 Volume 2021:14 Pages 10117—10129
DOI https://doi.org/10.2147/IJGM.S343233
Checked for plagiarism Yes
Review by Single anonymous peer review
Peer reviewer comments 2
Editor who approved publication: Dr Scott Fraser
Qun Li,1 Yangli Jin,2 Zhisen Shen,1 Huigao Liu,3 Yi Shen,1 Zhenhua Wu1
1Department of Otorhinolaryngology Head and Neck Surgery, Ningbo Medical Center Lihuili Hospital, Ningbo, Zhejiang, People’s Republic of China; 2Department of Doppler Ultrasonic, Ningbo Yinzhou No.2 Hospital, Ningbo, Zhejiang, People’s Republic of China; 3Department of Otorhinolaryngology Head and Neck Surgery, Ningbo Zhenhai Longsai Hospital, Ningbo, Zhejiang, People’s Republic of China
Correspondence: Zhenhua Wu
Department of Otorhinolaryngology Head and Neck Surgery, Ningbo Medical Center Lihuili Hospital, No. 57 Xingning Road, Yinzhou District, Ningbo, 315040, People’s Republic of China
Tel +86-574-87018634
Fax +86-574-87018634
Email [email protected]
Background: Head and neck squamous cell carcinoma (HNSCC) is one of the most common malignant cancers, and few studies have demonstrated the value of ferroptosis-related genes in prognosis.
Methods: The original counts of RNA sequencing data and clinicopathological data were obtained from TCGA and GSE65858 datasets. Common ferroptosis-related genes related to prognosis were identified from the training set and were included in LASSO to determine the best prognosis. To evaluate the efficacy, time-dependent ROC and Kaplan–Meier (KM) survival analyses were applied. Moreover, univariate and multivariate Cox regression analyses were used to screen independent parameters of prognosis and build a nomogram. Eventually, possible biological pathways were proposed based on GSEA.
Results: Among 242 ferroptosis-related genes, we identified that the FLT3, IL6, Keap1, NQO1, SOCS1 and TRIB3 genes were significantly connected with HNSCC patient prognosis as a six-gene signature. After, the patients were divided into high- and low-risk groups based on the six-gene signature. The KM survival curves demonstrated that the high-risk group had worse OS (p < 0.0001) and higher AUC values (0.654, 0.735, and 0.679 for 1-, 3-, and 5-year survival, respectively) for the prognostic signature of the six genes compared with other genes, which were also validated in the GSE65858 dataset. Moreover, GSEA suggested that the epithelial mesenchymal transition pathway was abundant and that the mesenchymal status in the high-risk group was substantially higher than that in the low-risk group. Finally, the immune microenvironment and differences in the content of immune cell types were demonstrated.
Conclusion: We established a six-ferroptosis-related-gene model crossing clinical prognostic parameters that can predict HNSCC patient prognosis and provide a reliable prognostic evaluation tool to assist clinical treatment decisions.
Keywords: head and neck squamous cell carcinoma, ferroptosis, prognosis, TCGA
Introduction
Head and neck squamous cell carcinoma (HNSCC) is a common, pathological, and fatal malignancy, with approximately 380,000 patients dying from the disease each year.1 Epidemiological investigations have indicated that the most common pathogenic factors of HNSCC include smoking, drinking and human papillomavirus (HPV) infection.2 Although some progress has been made in HNSCC treatment, approximately 50% of patients will die.3 Great progress has been made in multidisciplinary therapy, covering monoclonal antibody therapy, adoptive T cell transplantation, and cytokine therapy; however, for decades, there has been a stable overall survival rate.4 The high heterogeneity of potential risk factors, different tumor locations, and molecular abnormalities make prognosis prediction challenging.5 Therefore, novel prognostic models are urgently needed.
Successful avoidance of programmed cell death is a major feature of cancer.6 As a newly regulated pattern of cell death, ferroptosis depends on iron and reactive oxygen species.7 Molecular features different from other forms of regulatory cell death have been found in ferroptosis.8 Significantly, previous studies have demonstrated that tumor cells escape other forms of cell death, but their sensitivity to ferroptosis remains or is acquired.6 Therefore, studies of ferroptosis in cancer have provided approaches for cancer therapy.9 In addition to inducible factors of ferroptosis, many genes have been identified as regulatory factors or markers of ferroptosis. The inference that ferroptosis plays an important role in HNSCC has been verified in previous studies.10,11 Additionally, distinct ferroptosis regulation patterns have provided a new mechanistic view and insight for clinical therapy and prognosis in oral and laryngeal squamous cell carcinoma.12,13 Therefore, illustrating the value of ferroptosis-related genes in the prognosis of HNSCC is important.
In our study, to predict HNSCC prognosis, we built a gene-based model that integrated the clinical parameters of prognosis. Clinicopathological and RNA-seq data were obtained from TCGA. Six genes (FLT3, IL6, Keap1, NQO1, SOCS1 and TRIB3) were screened out and found to be significantly related to HNSCC patient prognosis. Based on Cox regression analysis, we used independent parameters of prognosis, including risk score and M stage, to establish a nomogram. Compared to the risk score and M stage in the validation sets, the time-related receiver operating characteristic (ROC) curve showed that the nomogram was the best predictor of patient survival rate. Good consistency between the predicted and observed results of the nomogram was displayed in the calibration plot. Eventually, functional enrichment analysis of the six genes was performed, and possible biological pathways were proposed.
Materials and Methods
Dataset Sources and Processing
As of February 8, 2021, the RNA sequencing (RNA-seq) data and clinical information of 495 HNSCC patients were downloaded from TCGA (https://portal.gdc.cancer.gov/repository). To standardize the gene expression profile, the scaling method provided in the “limma” R software package was used. TCGA data are public; therefore, this study did not need to be approved by the local ethics committees. The research strictly followed TCGA data access strategy and release guidelines. Another website (http://www.zhounan.org/ferrdb/) was the source of 242 ferroptosis-related genes and their expression data.14
Selection and Verification of Prognosis-Related Genes
The transcripts per million (TPM) method was used to standardize the original counts of RNA-seq data, and the subsequent survival analysis employed a log 2-based transformation (log2tpm).
After, based on the standardized expression data in the training set (n = 348), a set of polygenic signatures was built to predict HNSCC patient prognosis. In the univariate Cox proportional hazard regression analysis, the expression data of log2 TPM transformation and the relevant clinical data were applied to screen prognostic genes (hazard ratio (HR) ≠ 1, P < 0.05). A group of candidate genes was obtained by crossing the prognosis-related genes with ferroptosis-related genes. By applying the “glmnet” software package of R software15 and the least absolute shrinkage and selection operator (LASSO) regression method, a polygenic signature of OCGS was constructed to predict HNSCC prognosis.15
Establishment and Estimation of a Multigene Prognostic Signature
A multivariate Cox proportional hazards regression model was used to calculate the regression coefficients of the six genes most related to prognosis. After, the expression level and coefficient of each gene were combined using the linear combination method to obtain the risk score formula as follows: Risk score=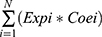 . Expi represents each prognostic gene expression level, N represents the number of genes, and Coei represents the regression coefficient. Based on the median risk score, the patients were partitioned into high- and low-risk groups in the training set. For KM survival analysis, a Log rank test was used to determine the difference in survival rate between the high-risk group and low-risk group for comparison. Comparison of the predictive ability of the risk score and a few clinical parameters (including age, sex, stage, smoking, T stage, N stage, M stage, grade, HPV and risk score) was based on univariate Cox proportional hazards regression analysis. The R package “timeROC” was used to draw the time-dependent ROC curve to evaluate the predictive accuracy of the clinical parameters.16 Additionally, multivariate Cox proportional hazard regression analysis was applied to identify whether the risk score can be an independent factor for HNSCC patient prognosis. The univariate Cox proportional hazards regression analysis included other clinical parameters with statistically significant differences (p < 0.05).
Validation of Multigene Prognostic Signature
To test the predictive ability and applicability of the polygenic prognostic signature in HNSCC, the testing set (n = 147), whole set (n = 495), and external validation set (n = 270) were used for internal and external validation. The calculation of the risk score for each patient was based on the coefficients of the above six genes in the validation set. After, consistent with the median risk score in the training set, the patients were partitioned into high- and low-risk groups. The characteristics of multiple genes related to prognosis were assessed using a Log rank test and ROC analysis.
Construction and Validation of the Prognostic Gene Nomogram
Based on the independent parameters of prognosis screened out by univariate and multivariate Cox proportional hazards regression analysis and time-dependent ROC curve analysis, two nomograms were constructed with the “rms” package of R software.17 The prediction capabilities of the two nomograms were evaluated through calibration curves and time-dependent ROC curves.
Functional Enrichment Analysis of Genes
To determine potential biological pathways, the “ClusterProfiler” R package was used for gene set enrichment analysis (GSEA). According to the median expression of prognosis-related genes, 495 HNSCC samples in the entire set were partitioned into two groups. The hallmark gene sets (h.all.v7.1.symbols.gmt) were downloaded from the GSEA website (https://www.gseamsigdb.org/gsea/index.jsp).
Computation of EMT Score
To compute the EMT score of each sample, we adopted an approach similar to that used in single-sample GSEA (ssGSEA).18 Published EMT gene signatures19–21 were analyzed using this method, yielding a single “EMT score” per signature for each sample.
Estimation of Immune Cell Type Content
To visualize the immune cell type content of each patient, the “CIBERSORT” R package was used to convert mRNA data into the infiltration fractions of nontumor cells in the tumor microenvironment. For each sample, the sum of all estimated immune cell type scores is equal to 1.
Statistical Analysis
Using the “sample” function of R software, tumor tissue samples were randomly partitioned into two groups. For Kaplan–Meier curves, a Log rank test and univariate Cox proportional hazard regression were used to determine the risk ratio (hazard ratio, HR) of the P value and the 95% confidence interval (Cl). R software version 3.6.1 (The R Foundation for Statistical Computing, 2019) and R software packages were used for all the above analyses. All statistical tests are bidirectional without exception. When P < 0.05, the result was considered statistically significant.
Results
Identification of Prognostic Ferroptosis-Related DEGs in the TCGA Cohort
Figure 1 shows the study flowchart. In total, 495 HNSCC patients were enrolled in the TCGA-HNSCC cohort. Through univariate Cox regression analysis, we analyzed 242 ferroptosis-related genes and retained 10 prognostic genes related to ferroptosis (Figure 2A). To further identify the genes significantly connected with HNSCC patient prognosis, tenfold cross-validation of LASSO regression was used to obtain the best lambda value from the least partial likelihood deviation. The lambda value was associated with seven ferroptosis-related genes that were significantly correlated with OS (Figure 2B and C).
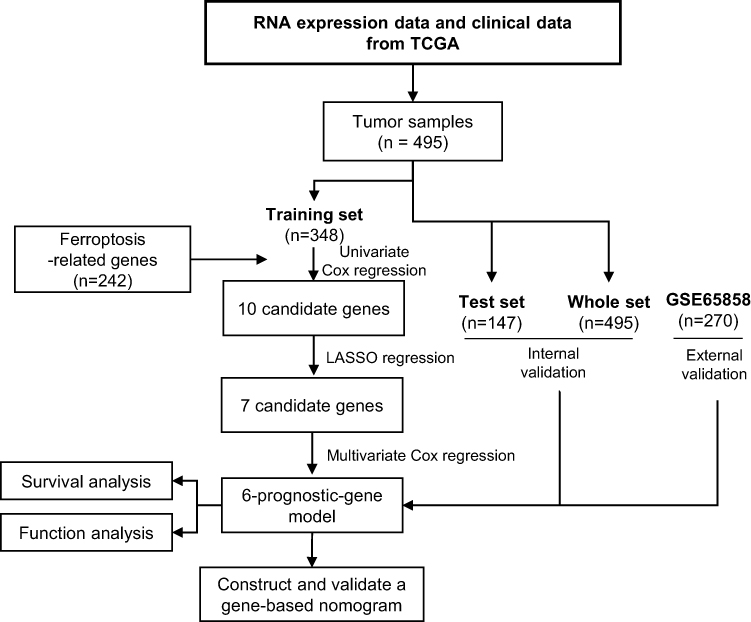 |
Figure 1 Study flowchart. |
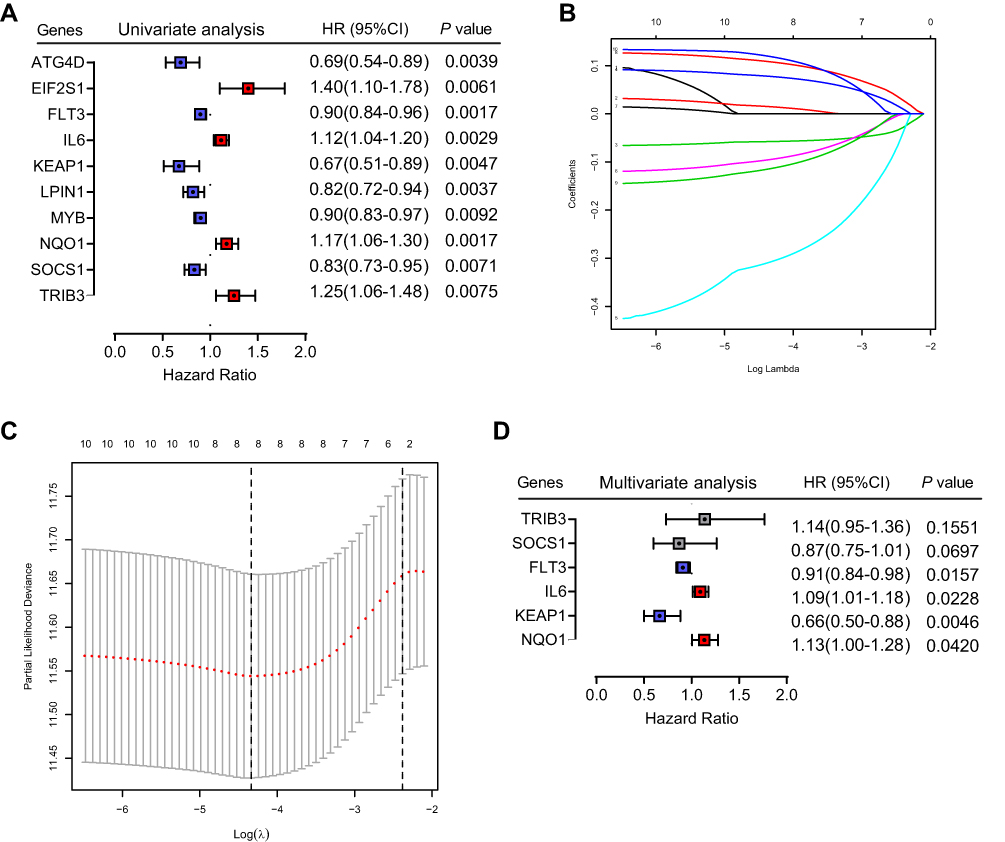 |
Figure 2 Identification of six significant prognostic genes in HNSCC. (A) Univariate Cox regression analysis of 242 ferroptosis-related genes. (B) LASSO coefficient profiles of 10 prognostic genes. (C) LASSO regression with tenfold cross-validation yielded seven prognostic genes using the minimum lambda value. (D) Multivariate Cox regression analysis of six prognostic genes. |
Establishment and Estimation of a Six-Gene Prognostic Signature
To determine whether each gene has prognostic significance in patients with HNSCC, multivariate Cox proportional hazard regression analysis was conducted using the six prognostic genes (Figure 2D). Then, consistent with their Cox coefficients, we constructed six gene-based risk scores: risk score = - 0.0966956 * exp (FLT3) + 0.0873983 * exp (IL6) − 0.4095449 * exp (Keap1) + 0.1254306 * exp (NQO1) − 0.1389582 * exp (SOCS1) + 0.1288005 * exp (TRIB3). After, we calculated each patient’s risk score, where we used the “survminer” R software package to obtain the median cutoff point and partitioned the patients into low- and high-risk groups (Figure 3A). In the training group, the survival status of all patients is shown in Figure 3B, and a heatmap of the six prognostic genes is shown in Figure 3C. The KM survival curves demonstrated that the high-risk group had worse OS than the low-risk group (Figure 3D). In addition, in the time-dependent ROC analysis, higher AUC values were observed for the prognostic signature of the six genes compared with other genes (Figure 3E). The above results indicate that the polygenic model has better predictive ability for 1-, 3-, and 5-year OS.
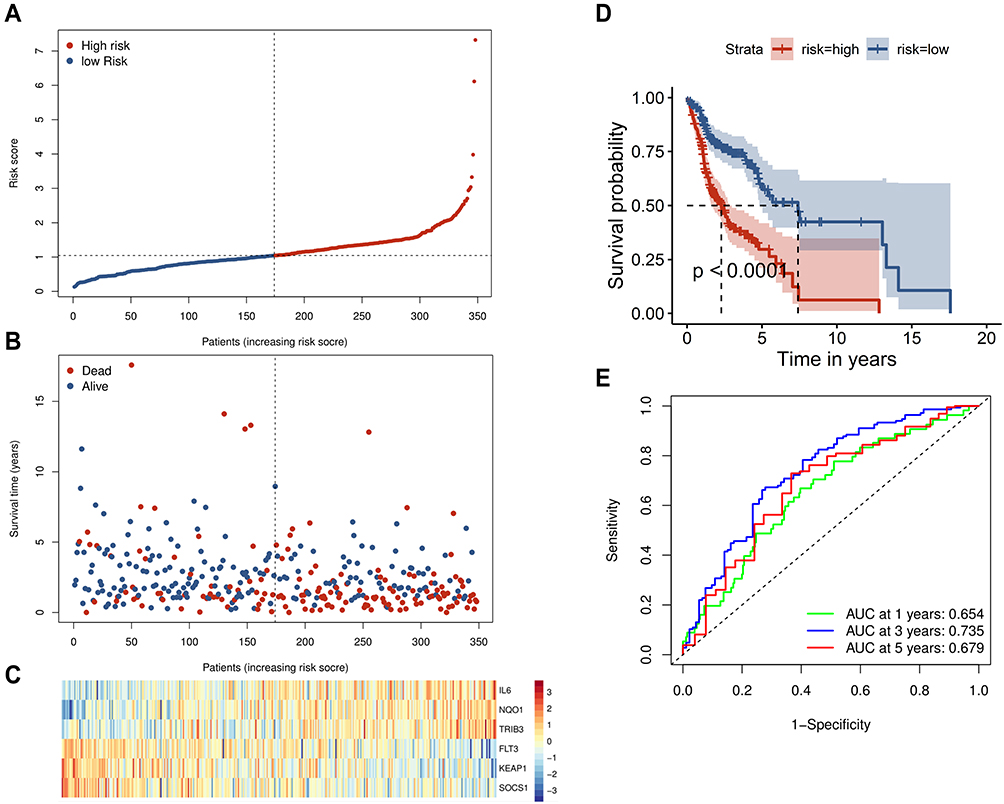 |
Figure 3 Prognostic analysis of the six-gene signature in the training set. (A) The curve of risk score. The dotted line represents the median risk score, and patients were divided into high- and low-risk groups. (B) Survival status of the patients. A higher risk score corresponded to higher mortality among patients. (C) Heatmap of six prognostic gene expression profiles in the high- and low-risk groups. (D) Kaplan–Meier survival analysis of the signature of six genes. (E) Time-dependent receiver operating characteristic analysis of the six-gene signature. |
Internal and External Validation of the Six-Gene Prognostic Signature
To validate the significant prognostic value of the six genes, the internal validation set (n = 147), the entire validation set (n = 495) and GSE65858 as the external validation set (n = 270) were used to evaluate the training set results. In accordance with the outcomes of the training set, the KM curves of the three test sets showed that the low-risk group had a better patient prognosis than the high-risk group (Figure 4A–C). As shown in Figure 4D–F, the AUCs for the internal validation set, overall validation set and external validation set for 1-, 3-, and 5-year OS were 0.64, 0.68, and 0.63; 0.65, 0.71, and 0.66; and 0.72, 0.63, and 0.57 in the time-dependent ROC analysis, respectively. In conclusion, in predicting OS in HNSCC patients, the prognostic signature of the six genes was good.
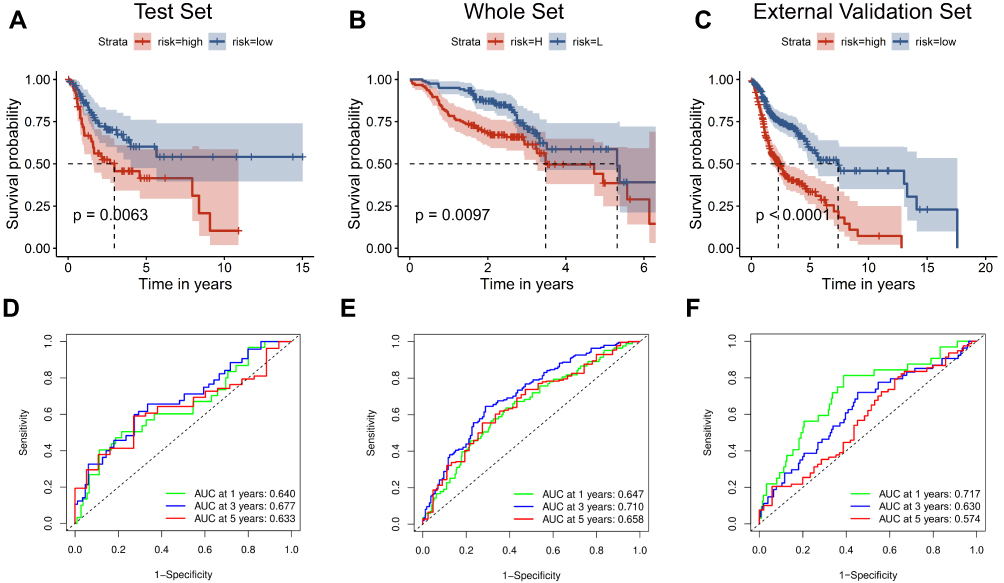 |
Figure 4 Validation of the six-gene signature. The external validation set analysis from GSE65858. Kaplan–Meier survival analysis was performed for the six-gene signature in the internal validation set (A) the entire set (B) and the external validation set (C). Time-dependent receiver operating characteristic analysis of the six-gene signature was used in the internal validation set (D) the entire set (E) and the external validation set (F). |
Construction and Validation of the Gene-Based Nomogram
After univariate and multivariate Cox proportional hazard regression analysis, the six-gene prognostic signature and M stage could be regarded as independent variables related to the prognosis of OS in the training set (Figure 5A and B). Moreover, the time-dependent ROC curve analysis indicated that risk score and age were better predictive factors than others (Figure 5C). To build a more reliable clinical prediction method, two composite nomograms using the risk score and M stage or the risk score and age were established (Figure 5D). The survival prediction in the calibration plot showed that the prediction results of the six-gene prognostic nomogram were consistent with the actual results, and the composite nomogram from risk score and M stage was closer to the actual result (Figure 5E–G). Moreover, time-dependent ROC curve analysis indicated that the composite nomogram based on the risk score and M stage had a high predictive ability (Figure 5H), and the nomogram based on the risk score and M stage is shown in Figure 5I. Furthermore, predicting 1-, 3-, and 5-year OS might be the best function for the six-gene prognostic nomogram, as the AUC value for 1-, 3-, and 5-year OS in the nomogram was higher than that of the risk score (Figure 6A–J). We used the testing set (n = 107), whole set (n = 495) and GSE65858 (n = 164) to validate the above findings.
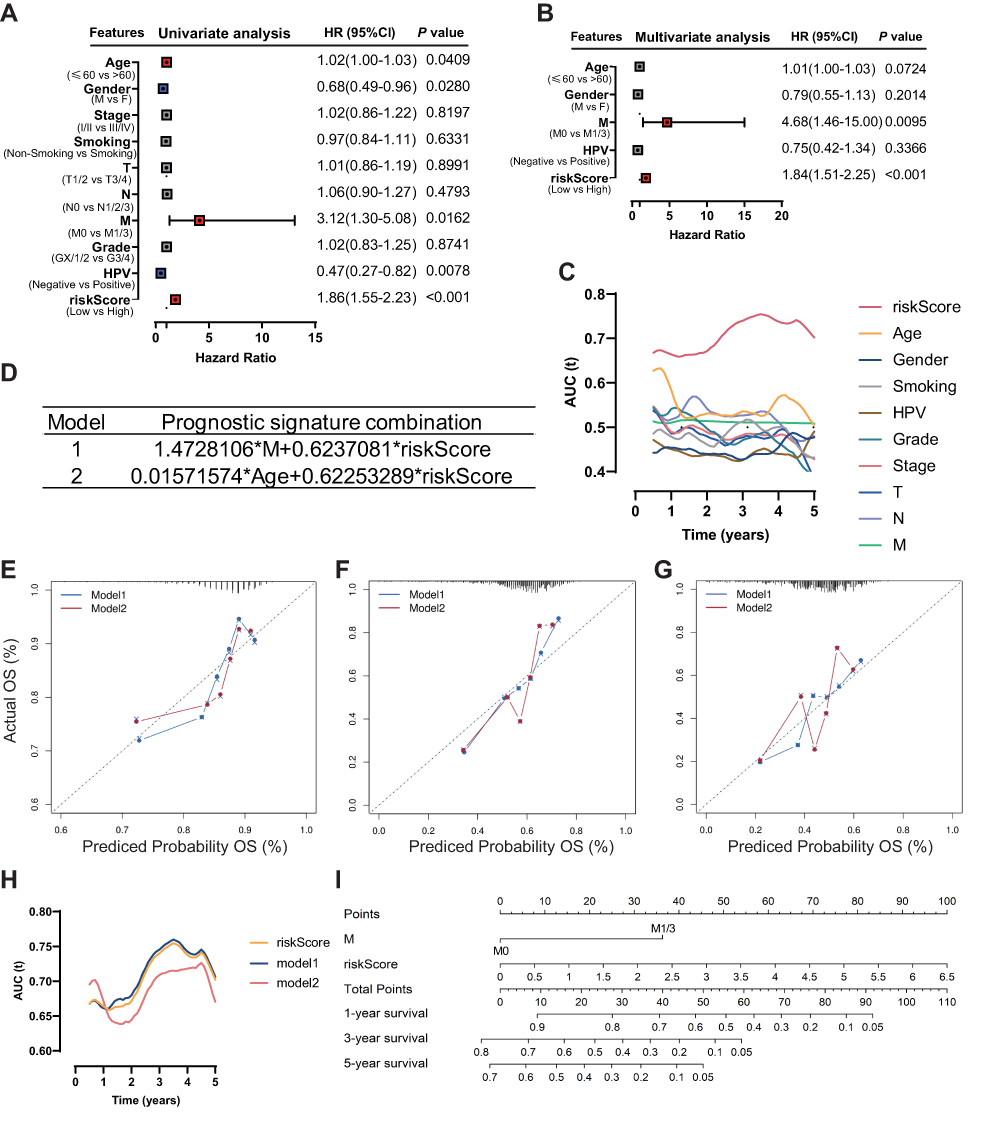 |
Figure 5 Identification of the independent prognostic parameters and construction of a gene-based prognostic model. (A) Forest plot of univariate Cox regression analysis in HNSCC. (B) Forest plot of multivariate Cox regression analysis in HNSCC. (C) ROC analysis indicated that risk score and age were accurate variables for survival prediction. (D) Formula to build the models. (E–G) Calibration curves showed the concordance between 1-, 3- and 5-year OS prediction and observation of the two models. (H) ROC analysis showed that the model combining M stage and risk score was an accurate variable for survival prediction. (I) Nomogram integrating six gene-based M stages and a risk score. |
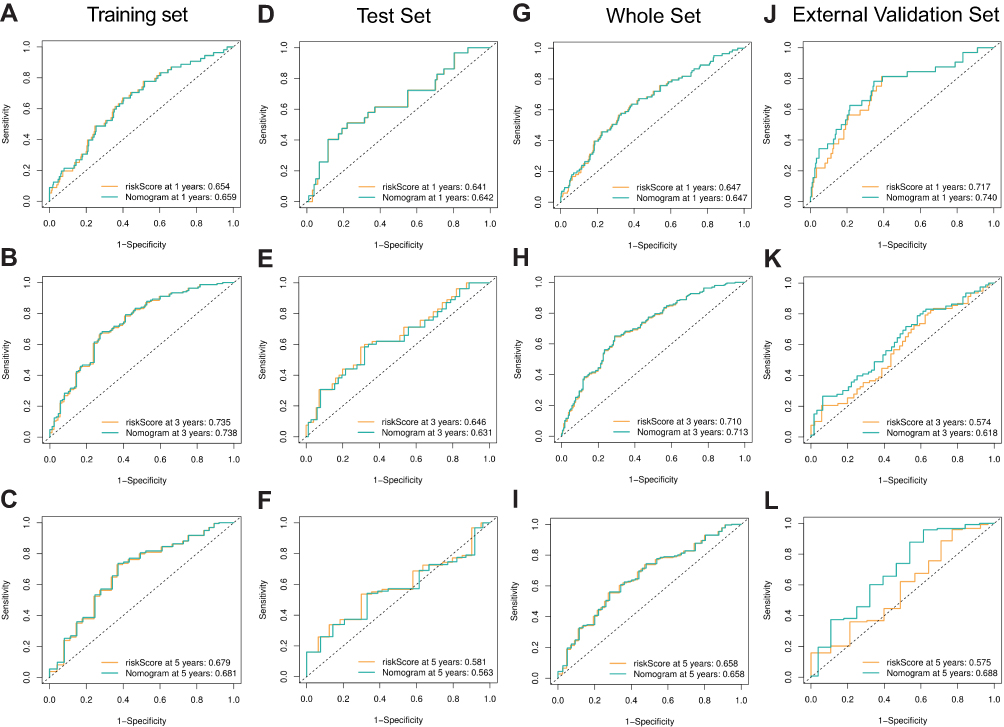 |
Figure 6 Performance of the gene-based nomogram in predicting survival probability and comparison of the predictive power among the gene-based nomogram, stage, and risk score. Time-dependent ROC curves of the nomogram and risk score in 1-, 3- and 5-year OS prediction in the training set (A–C), the internal validation set (D–I) and the external validation set (J–L). |
Gene Set Enrichment Analysis
To determine the potential biological processes of the six prognostic genes, GSEA was conducted. The results showed that all of the high-risk samples were rich in interferon alpha reaction, angiogenesis, interferon gel reaction and epithelial mesenchymal transition. Samples with high-risk genes in GSE65858 were enriched in angiogenesis, epithelial mesenchymal transition, myogenesis and TNFA signal transduction through NF-kB (Figure 7A and B). The epithelial mesenchymal transition (EMT) pathway was abundant in the two sets (Figure 7C and D). To verify the effects of the six ferroptosis-related gene signatures on EMT, we further performed ssGSEA using gene expression signatures associated with mesenchymal status. The EMT signal indicated that the mesenchymal status in the high-risk group was substantially higher than that in the low-risk group (Figure 7E).
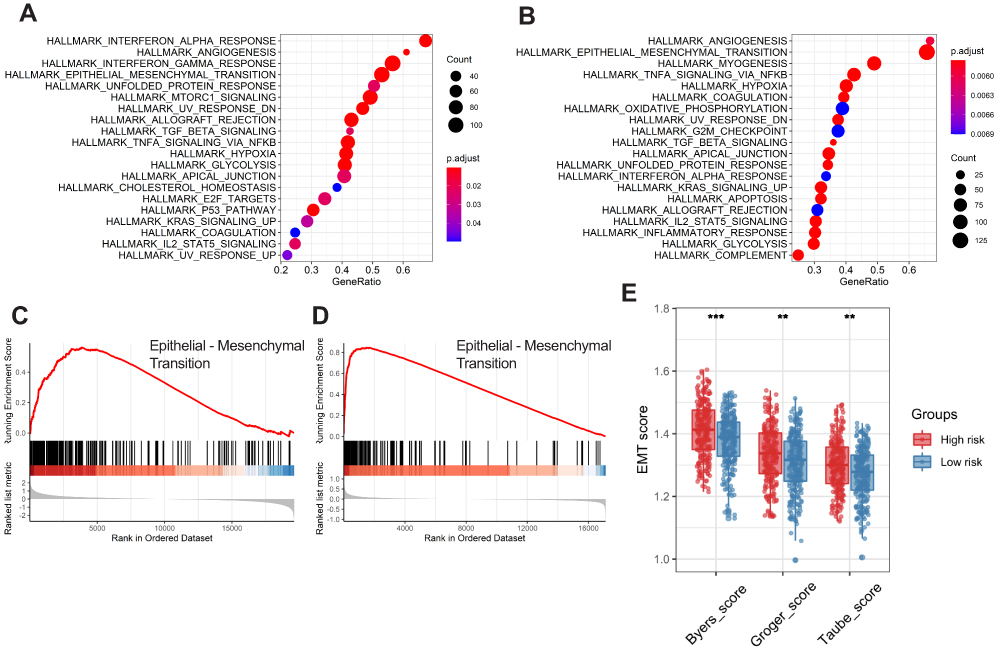 |
Figure 7 Functional enrichment analysis of the six-gene signature. Gene set enrichment analysis (GSEA) results in the training set (A) and external validation set (B) show the enriched signaling pathways associated with the six-gene signature. The epithelial-mesenchymal transition signaling pathway in the high-risk training set (C) and external validation set (D). Comparison of EMT scores between high- and low-risk groups in the training set (E). |
Comparison of the Immune Microenvironment of Patients with HNSCC Between the High- and Low-Risk Groups
IL6 was one of six ferroptosis-related genes. As a pleiotropic cytokine, IL6-activated signal transduction and transduction 3 (STAT3) signaling has an important impact on tumor infiltrating immune cells in the tumor immune microenvironment. Therefore, we compared the immune microenvironment of HNSCC patients in the high- and low-risk groups. Figure 8A shows that there were significant differences in the content of immune cell types. After univariate (Figure 8B) and multivariate (Figure 8C) Cox regression analyses, activated memory CD4 T cells, regulatory T cells and resting mast cells were considered to be positive independent prognostic factors.
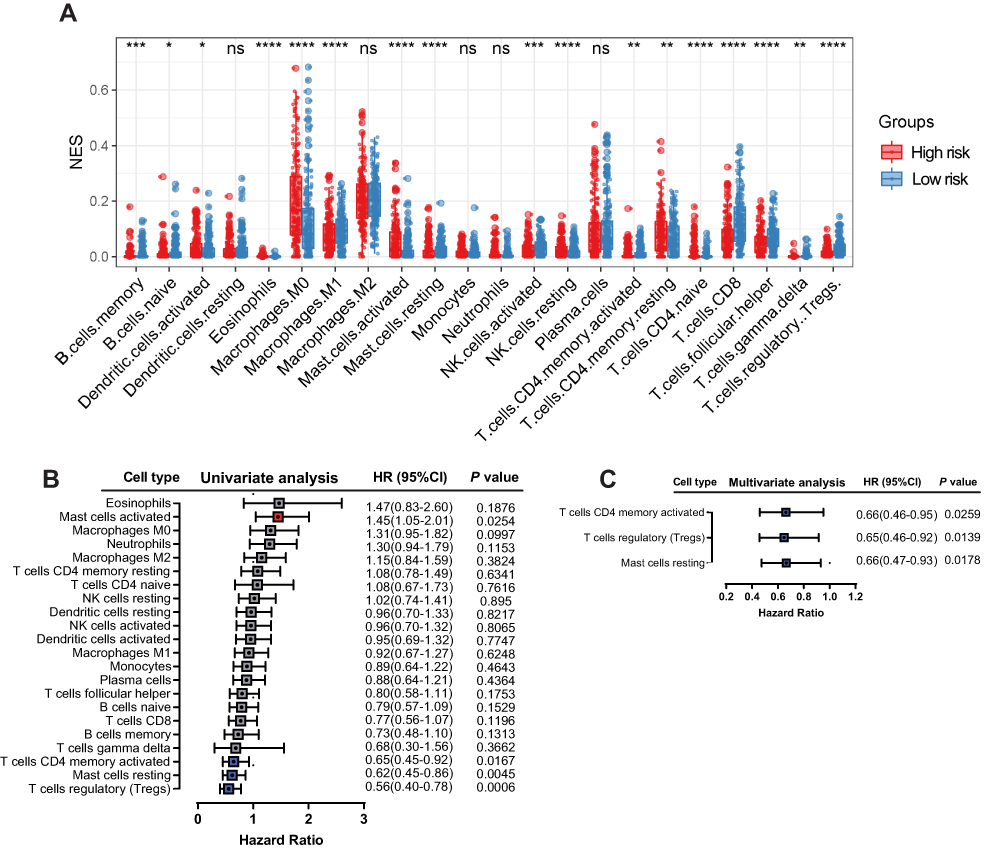 |
Figure 8 Correlation between immune infiltration and the six-gene signature. Relative abundance of immune cell types in the high- and low-risk groups (A). Univariate (B) and multivariate (C) Cox regression analyses showed that activated memory CD4 T cells, regulatory T cells and resting mast cells were positive independent prognostic factors. |
Discussion
Previous studies10,11 have shown that certain genes may regulate drug-induced ferroptosis in HNSCC, but their association with OS in HNSCC patients is still unclear. In our study, the expression of 242 ferroptosis-related genes in HNSCC and their relationship with OS were systematically studied. For the first time, by integrating six ferroptosis-related genes, a new prognostic model was built and validated in an external cohort. The prognostic model proposed in this study consists of six ferroptosis-related genes (FLT3, IL6, Keap1, NQO1, SOCS1 and TRIB3). As a receptor tyrosine kinase, activation of FLT3 mediates hematopoietic progenitor cell survival, proliferation and differentiation.22 Valuable studies have confirmed that FLT3 inhibitors are effective protective agents that prevent lipid peroxidation from resisting glutamate toxicity, and glutamate toxicity is related to ferroptosis.23 As an inflammatory cytokine, IL6 is related to various biological processes, including immune disorders and cancer.24 IL6 exposure induces cartilage cell ferroptosis by inducing oxidative stress and interfering with iron homeostasis.25 KEAP1, a component of the Cullin 3-based E3 ubiquitin ligase complex, regulates the stability and accumulation of Nrf2. Activation of the p62-keap1-nrf2 pathway can prevent ferroptosis in hepatocellular carcinoma cells.26,27 NQO1, a double electron reductase, is responsible for the detoxification of quinones and the biological activity of some quinones. NQO1 is overexpressed in many tumors, closely related to various carcinogenic processes and considered a cancer-specific therapeutic target.28 Knockdown of NQO1 increased the inhibitory effect of ferroptosis inducers26 on the growth of hepatoma cells. SOCS1 is regarded as a negative feedback regulator of cytokine and growth factor receptor signaling. Loss of its expression may affect the classical checkpoint pathway in various tumors.29 Exogenous SOCS1 regulates the expression of p53 target genes and cell sensitivity to ferroptosis. This effect was related to the ability of SOCS1 to downregulate SLC7A11 expression and reduce glutathione levels.30 TRIB3, a multifunctional protein, has recently been demonstrated to play a key regulatory role in many signaling pathways and is involved in various cellular processes. As reported, TRIB3 can directly bind to AKT and block its activation by regulating the phosphorylation status at Ser473 and Thr308.31 The role of TRIB3 in inhibiting Akt in ferroptosis is still unclear. In addition, some antitumor drugs, such as tetrahydrocannabinol and salinomycin, can induce TRIB3 expression.31 In summary, the six genes in the prognostic model are related to ferroptosis and cancer to different degrees. In our study, FLT3, KEAP1, and SOCS1 were associated with a good prognosis in HNSCC, while the remaining three genes (IL6, NQO1, and TRIB3) were related to a poor prognosis. Whether these genes are involved in HNSCC patient prognosis by affecting the process of ferroptosis remains to be clarified because there is little research on these genes.
He et al32 also reported the ferroptosis-related gene signature in prognosis in HNSCC during our paper submission. He et al selected differentially expressed genes based on the comparison between HNSCC and adjacent nontumorous tissues and obtained prognosis-related genes through univariate Cox regression analysis. In our study, first, in univariate Cox regression analysis, 242 ferroptosis-related genes were analyzed, and 10 predictive ferroptosis-related genes remaining in the training set were used in LASSO regression analysis. Then, the best lambda value was obtained from the least partial likelihood deviation by using the tenfold cross-validation LASSO regression method, which was related to six ferroptosis-related genes that have a significant association with OS. Moreover, there are large differences during cancer initiation and development. Some genes will have little difference in the cancer initiation stage, while they could have an important influence on cancer development. Therefore, we think that screening based on the comparison between tumors and adjacent nontumors will lose some important genes that have important functions during cancer development. Furthermore, we used univariate Cox regression analysis, LASSO regression analysis, and multivariate Cox regression analysis for the screening and identification of prognostic models, which would be more reasonable and accurate. As a result, more reliable AUC values for 1-, 3-, and 5-year survival were obtained in our data compared to He et al’s paper data (AUC-1 year: 0.740 vs 0.717, −3 years: 0.618 vs 0.574, −5 years: 0.688 vs 0.575). Of note is that one common gene, KEAP1, which mediates the proteasomal degradation of the key ferroptosis regulator Nrf2, was reported in both papers, suggesting feasibility in workflow and approaches in both paper concepts.
The poor prognosis association of IL6, NQO1, and TRIB3 was further identified based on the Human Pathology Atlas project (HPA) (www.proteinatlas.org) to analyze protein expression with immunohistochemistry staining between normal and cancer tissues33 and the overall survival analysis from the Gene Expression Profiling Interactive Analysis (GEPIA) (http://gepia.cancer-pku.cn/)34. (Supplemental Figure 1), which indicated the tendency of increased expression level and worse overall survival.
Moreover, our GSEA indicated that the six-gene prognostic signature corresponding to biological functions was highly related to angiogenesis, epithelial-mesenchymal transition, and cytokine-related pathways and strongly linked to poor prognosis. The quantified EMT scores indicate that the high-risk group with poor prognosis is characterized by high mesenchymal levels. In addition, the significant differences in immune cell infiltration and univariate and multivariate Cox regression analysis suggest that the poor prognosis of the high-risk group is characterized by a decrease in memory CD4+ T cells, regulatory T cells and resting mast cells.
Nevertheless, first, our prediction model was built and validated with retrospective data from a public database. Second, it is inevitable that only one marker is considered to establish a prognostic model because many significant prognostic genes in HNSCC may be excluded. Third, in the TCGA database, there were significant differences in the protein levels of the six genes between cancer and its surrounding normal tissues. Most patients in the TCGA database are white and Asian. Therefore, more public databases or experiments are needed to explore whether there is geographical significance in the expression levels of the six genes.
In addition to HNSCC, we found that the concept of selecting and validating ferroptosis-related genes or lncRNA signatures developed rapidly in various other cancers, such as hepatocellular carcinoma,35,36 bladder cancer,37 lung adenocarcinoma,38 and breast cancer39,40, during our paper submission. These papers used ferroptosis-related genes from FerrDb and developed prognosis prediction utilizing TCGA and GEO database-based univariate Cox regression analysis and LASSO regression analysis, as in our paper, further indicating the feasibility of the methodology and the importance of ferroptosis-related genes in cancer development and prognosis. However, no common ferroptosis-related gene could predict prognosis in various cancers, indicating the cancer type-dependent role of ferroptosis. Thus, further investigation, such increasing the number of samples, experimental validation, or mechanistic demonstration, would be helpful.
Conclusion
In conclusion, a new prognostic model comprising six ferroptosis-related genes that were independently related to OS in the derivation and validation cohorts was constructed, providing insights for the prediction of HNSCC patient prognosis. This model provides a suggestive reliable prognostic evaluation tool for clinicians and might need further deeper analyses on new datasets to identify the “core ferroptosis genes” strongly involved in prognosis and their different potential associations with different HNSCC subsites.
Abbreviations
HNSCC, Head and Neck Squamous Cell Carcinoma; TCGA, The Cancer Genome Atlas; LASSO, the Least Absolute Shrinkage and Selection Operator; GSEA, Gene Set Enrichment Analysis; GEO, Gene Expression Omnibus; KM, Kaplan–Meier; ROC, Receiver Operating Characteristic; HPV, Human Papilloma Virus.
Data Sharing Statement
The data are available from the corresponding author upon reasonable request.
Ethical Committee Approval and Informed Consent
The study was performed based on the TCGA and GEO public databases. Because no personal identifying information was used in the current study, it was granted an exemption from ethics approval from the Institutional Review Board of the Ningbo Medical Center Lihuili Hospital.
Acknowledgment
This work was supported by the Zhejiang Provincial Natural Science Foundation of China [LY19H160014; LQ21H130001], Ningbo Medical and Health Brand Discipline [No. PPXK2018-02], Medical and Health Research Project of Zhejiang Province [2019ZD018; 2021KY307], Ningbo Natural Science Foundation [202003N4239], and Ningbo “Technology Innovation 2025” Major Special Project [2020Z098; 2018B10015].
Disclosure
The authors declare no conflicts of interest.
References
1. Ferlay J, Soerjomataram I, Dikshit R, et al. Cancer incidence and mortality worldwide: sources, methods and major patterns in GLOBOCAN 2012. Int J Cancer. 2015;136(5):E359–386. doi:10.1002/ijc.29210
2. Leemans CR, Snijders PJF, Brakenhoff RH. The molecular landscape of head and neck cancer. Nat Rev Cancer. 2018;18(5):269–282. doi:10.1038/nrc.2018.11
3. Cohen EE, LaMonte SJ, Erb NL, et al. American cancer society head and neck cancer survivorship care guideline. CA Cancer J Clin. 2016;66(3):203–239. doi:10.3322/caac.21343
4. Hoesli RC, Moyer JS. Immunotherapy for head and neck squamous cell carcinoma. Curr Oral Health Rep. 2016;3(2):74–81. doi:10.1007/s40496-016-0082-2
5. Liang B, Tao Y, Wang T. Profiles of immune cell infiltration in head and neck squamous carcinoma. Biosci Rep. 2020;40(2):BSR20192724.
6. Bebber CM, Muller F, Prieto Clemente L, Weber J, von Karstedt S. Ferroptosis in cancer cell biology. Cancers. 2020;12(1):164. doi:10.3390/cancers12010164
7. Shen Z, Song J, Yung BC, Zhou Z, Wu A, Chen X. Emerging strategies of cancer therapy based on ferroptosis. Adv Mater. 2018;30(12):e1704007.
8. Hirschhorn T, Stockwell BR. The development of the concept of ferroptosis. Free Radic Biol Med. 2019;133:130–143. doi:10.1016/j.freeradbiomed.2018.09.043
9. Mou Y, Wang J, Wu J, et al. Ferroptosis, a new form of cell death: opportunities and challenges in cancer. J Hematol Oncol. 2019;12(1):34. doi:10.1186/s13045-019-0720-y
10. Lee J, You JH, Shin D, Roh JL. Inhibition of glutaredoxin 5 predisposes cisplatin-resistant head and neck cancer cells to ferroptosis. Theranostics. 2020;10(17):7775–7786. doi:10.7150/thno.46903
11. Shin D, Lee J, You JH, Kim D, Roh JL. Dihydrolipoamide dehydrogenase regulates cystine deprivation-induced ferroptosis in head and neck cancer. Redox Biol. 2020;30:101418. doi:10.1016/j.redox.2019.101418
12. Gu W, Kim M, Wang L, Yang Z, Nakajima T, Tsushima Y. Multi-omics analysis of ferroptosis regulation patterns and characterization of tumor microenvironment in patients with oral squamous cell carcinoma. Int J Biol Sci. 2021;17(13):3476–3492. doi:10.7150/ijbs.61441
13. Han F, Li W, Chen T, et al. Ferroptosis-related genes for predicting prognosis of patients with laryngeal squamous cell carcinoma. Eur Arch Otorhinolaryngol. 2021;278(8):2919–2925. doi:10.1007/s00405-021-06789-3
14. Zhou N, Bao J. FerrDb: a manually curated resource for regulators and markers of ferroptosis and ferroptosis-disease associations. Database (Oxford). 2020;2020. doi:10.1093/database/baaa021
15. Friedman J, Hastie T, Tibshirani R. Regularization paths for generalized linear models via coordinate descent. J Stat Softw. 2010;33(1):1–22. doi:10.18637/jss.v033.i01
16. Heagerty PJ, Lumley T, Pepe MS. Time-dependent ROC curves for censored survival data and a diagnostic marker. Biometrics. 2000;56(2):337–344. doi:10.1111/j.0006-341X.2000.00337.x
17. Nunez E, Steyerberg EW, Nunez J. [Regression modeling strategies]. Rev Esp Cardiol. 2011;64(6):501–507. Spanish. doi:10.1016/j.recesp.2011.01.019
18. Barbie DA, Tamayo P, Boehm JS, et al. Systematic RNA interference reveals that oncogenic KRAS-driven cancers require TBK1. Nature. 2009;462(7269):108–112. doi:10.1038/nature08460
19. Byers LA, Diao L, Wang J, et al. An epithelial-mesenchymal transition gene signature predicts resistance to EGFR and PI3K inhibitors and identifies Axl as a therapeutic target for overcoming EGFR inhibitor resistance. Clin Cancer Res. 2013;19(1):279–290. doi:10.1158/1078-0432.CCR-12-1558
20. Groger CJ, Grubinger M, Waldhor T, Vierlinger K, Mikulits W. Meta-analysis of gene expression signatures defining the epithelial to mesenchymal transition during cancer progression. PLoS One. 2012;7(12):e51136. doi:10.1371/journal.pone.0051136
21. Taube JH, Herschkowitz JI, Komurov K, et al. Core epithelial-to-mesenchymal transition interactome gene-expression signature is associated with claudin-low and metaplastic breast cancer subtypes. Proc Natl Acad Sci U S A. 2010;107(35):15449–15454. doi:10.1073/pnas.1004900107
22. Kazi JU, Ronnstrand L. FMS-like tyrosine kinase 3/FLT3: from basic science to clinical implications. Physiol Rev. 2019;99(3):1433–1466. doi:10.1152/physrev.00029.2018
23. Kang Y, Tiziani S, Park G, Kaul M, Paternostro G. Cellular protection using Flt3 and PI3Kalpha inhibitors demonstrates multiple mechanisms of oxidative glutamate toxicity. Nat Commun. 2014;5(1):3672. doi:10.1038/ncomms4672
24. Rossi JF, Lu ZY, Jourdan M, Klein B. Interleukin-6 as a therapeutic target. Clin Cancer Res. 2015;21(6):1248–1257. doi:10.1158/1078-0432.CCR-14-2291
25. Bin S, Xin L, Lin Z, Jinhua Z, Rui G, Xiang Z. Targeting miR-10a-5p/IL-6R axis for reducing IL-6-induced cartilage cell ferroptosis. Exp Mol Pathol. 2021;118:104570. doi:10.1016/j.yexmp.2020.104570
26. Sun X, Ou Z, Chen R, et al. Activation of the p62-Keap1-NRF2 pathway protects against ferroptosis in hepatocellular carcinoma cells. Hepatology. 2016;63(1):173–184. doi:10.1002/hep.28251
27. Taguchi K, Yamamoto M. The KEAP1-NRF2 system in cancer. Front Oncol. 2017;7:85. doi:10.3389/fonc.2017.00085
28. Zhang K, Chen D, Ma K, Wu X, Hao H, Jiang S. NAD(P)H:quinone oxidoreductase 1 (NQO1) as a therapeutic and diagnostic target in cancer. J Med Chem. 2018;61(16):6983–7003. doi:10.1021/acs.jmedchem.8b00124
29. Ilangumaran S, Bobbala D, Ramanathan S. SOCS1: regulator of T cells in autoimmunity and cancer. Curr Top Microbiol Immunol. 2017;410:159–189. doi:10.1007/82_2017_63
30. Saint-Germain E, Mignacca L, Vernier M, Bobbala D, Ilangumaran S, Ferbeyre G. SOCS1 regulates senescence and ferroptosis by modulating the expression of p53 target genes. Aging. 2017;9(10):2137–2162. doi:10.18632/aging.101306
31. Lin RJ, Wu IJ, Hong JY, et al. Capsaicin-induced TRIB3 upregulation promotes apoptosis in cancer cells. Cancer Manag Res. 2018;10:4237–4248. doi:10.2147/CMAR.S162383
32. He F, Chen Z, Deng W, et al. Development and validation of a novel ferroptosis-related gene signature for predicting prognosis and immune microenvironment in head and neck squamous cell carcinoma. Int Immunopharmacol. 2021;98:107789. doi:10.1016/j.intimp.2021.107789
33. Asplund A, Edqvist PH, Schwenk JM, Ponten F. Antibodies for profiling the human proteome-The human protein atlas as a resource for cancer research. Proteomics. 2012;12(13):2067–2077. doi:10.1002/pmic.201100504
34. Tang Z, Li C, Kang B, Gao G, Li C, Zhang Z. GEPIA: a web server for cancer and normal gene expression profiling and interactive analyses. Nucleic Acids Res. 2017;45(W1):W98–W102. doi:10.1093/nar/gkx247
35. Liang J, Zhi Y, Deng W, et al. Development and validation of ferroptosis-related lncRNAs signature for hepatocellular carcinoma. PeerJ. 2021;9:e11627. doi:10.7717/peerj.11627
36. Liu Y, Zhang X, Zhang J, Tan J, Li J, Song Z. Development and validation of a combined ferroptosis and immune prognostic classifier for hepatocellular carcinoma. Front Cell Dev Biol. 2020;8:596679. doi:10.3389/fcell.2020.596679
37. Sun J, Yue W, You J, et al. Identification of a novel ferroptosis-related gene prognostic signature in bladder cancer. Front Oncol. 2021;11:730716. doi:10.3389/fonc.2021.730716
38. Zhang A, Yang J, Ma C, Li F, Luo H. Development and validation of a robust ferroptosis-related prognostic signature in lung adenocarcinoma. Front Cell Dev Biol. 2021;9:616271. doi:10.3389/fcell.2021.616271
39. Wang D, Wei G, Ma J, et al. Identification of the prognostic value of ferroptosis-related gene signature in breast cancer patients. BMC Cancer. 2021;21(1):645. doi:10.1186/s12885-021-08341-2
40. Zhang K, Ping L, Du T, et al. A ferroptosis-related lncRNAs signature predicts prognosis and immune microenvironment for breast cancer. Front Mol Biosci. 2021;8:678877.
 © 2021 The Author(s). This work is published and licensed by Dove Medical Press Limited. The full terms of this license are available at https://www.dovepress.com/terms.php and incorporate the Creative Commons Attribution - Non Commercial (unported, v3.0) License.
By accessing the work you hereby accept the Terms. Non-commercial uses of the work are permitted without any further permission from Dove Medical Press Limited, provided the work is properly attributed. For permission for commercial use of this work, please see paragraphs 4.2 and 5 of our Terms.
© 2021 The Author(s). This work is published and licensed by Dove Medical Press Limited. The full terms of this license are available at https://www.dovepress.com/terms.php and incorporate the Creative Commons Attribution - Non Commercial (unported, v3.0) License.
By accessing the work you hereby accept the Terms. Non-commercial uses of the work are permitted without any further permission from Dove Medical Press Limited, provided the work is properly attributed. For permission for commercial use of this work, please see paragraphs 4.2 and 5 of our Terms.