Back to Journals » International Journal of General Medicine » Volume 16
Construction and Validation of a Model for Predicting Impaired Fasting Glucose Based on More Than 4000 General Population
Authors Wang C, Zhang X, Li C, Li N ![]() , Jia X, Zhao H
, Jia X, Zhao H
Received 21 February 2023
Accepted for publication 12 April 2023
Published 19 April 2023 Volume 2023:16 Pages 1415—1428
DOI https://doi.org/10.2147/IJGM.S409426
Checked for plagiarism Yes
Review by Single anonymous peer review
Peer reviewer comments 3
Editor who approved publication: Dr Scott Fraser
Cuicui Wang,1,* Xu Zhang,2,* Chenwei Li,2 Na Li,3 Xueni Jia,1 Hui Zhao1
1Department of Health Examination Center, The Second Affiliated Hospital of Dalian Medical University, Dalian, People’s Republic of China; 2Department of Respiratory Medicine, The Second Affiliated Hospital of Dalian Medical University, Dalian, People’s Republic of China; 3Department of General Practice, Xi’an People’s Hospital (Xi’an Fourth Hospital), Xi’an, People’s Republic of China
*These authors contributed equally to this work
Correspondence: Hui Zhao, Department of Health Examination Center, The Second Affiliated Hospital of Dalian Medical University, No. 467 Zhongshan Road, Shahekou District, Dalian, 116023, People’s Republic of China, Tel +86-17709875689, Email [email protected]
Purpose: Impaired fasting glucose (IFG) is associated with an increased risk of multiple diseases. Therefore, the early identification and intervention of IFG are particularly significant. Our study aims to construct and validate a clinical and laboratory-based nomogram (CLN) model for predicting IFG risk.
Patients and Methods: This cross-sectional study collected information on health check-up subjects. Risk predictors were screened mainly by the LASSO regression analysis and were applied to construct the CLN model. Furthermore, we showed examples of applications. Then, the accuracy of the CLN model was evaluated by the receiver operating characteristic (ROC) curve, the area under the ROC curve (AUC) values, and the calibration curve of the CLN model in the training set and validation set, respectively. The decision curve analysis (DCA) was used to estimate the level of clinical benefit. Furthermore, the performance of the CLN model was evaluated in the independent validation dataset.
Results: In the model development dataset, 2340 subjects were randomly assigned to the training set (N = 1638) and validation set (N = 702). Six predictors significantly associated with IFG were screened and used in the construction of the CLN model, a subject was randomly selected, and the risk of developing IFG was predicted to be 83.6% by using the CLN model. The AUC values of the CLN model were 0.783 in the training set and 0.789 in the validation set. The calibration curve demonstrated good concordance. DCA showed that the CLN model has good clinical application. We further performed independent validation (N = 1875), showed an AUC of 0.801, with the good agreement and clinical diagnostic value.
Conclusion: We developed and validated the CLN model that could predict the risk of IFG in the general population. It not only facilitates the diagnosis and treatment of IFG but also helps to reduce the medical and economic burdens of IFG-related diseases.
Keywords: glucose metabolism, nomogram model, risk prediction, disease prevention
Introduction
Impaired fasting glucose (IFG) is a hidden and dangerous early stage of abnormal glucose metabolism, and most IFG patients have no typical easily identifiable symptoms or signs.1 Generally speaking, IFG is reversible. Tips from previous research suggest that abnormal glucose metabolism in patients with IFG can be alleviated through health education, dietary intervention, physical exercise, drug treatment, and other measures,2–5 and without timely intervention, the abnormal state of glucose metabolism in IFG may continue to deteriorate and lead to irreversible damage. IFG has been shown to be closely associated with an increased risk of type 2 diabetes mellitus (T2DM) and cardiovascular disease (CVD),6,7 and IFG is also associated with atrial fibrillation, heart failure, ventricular septal hypertrophy, cerebral hemorrhage, all-cause mortality, and cardiovascular event outcomes.8–11 No doubt, IFG has become a public health problem that cannot be ignored, because IFG-related diseases bring a huge burden to medical care and the economy, and the worst is the burden of T2DM and CVD.12–14
In recent years, affected by a combination of factors, the global incidence of IFG has been increasing, resulting in a substantial increase in medical and economic burdens of IFG-related diseases. The Centers for Disease Control and Prevention (CDC) indicated in the National Health and Nutrition Examination Survey (NHANES) that IFG affects a large portion of the US population and increases healthcare costs.15 The WOBASZ survey in Poland found that the age and sex-standardized prevalence of IFG increased from 9.3% to 18.4% from 2005 to 2014.16 As early as 2004, a survey of nearly 770000 people in Tianjin, China, found that the age-standardized prevalence of IFG was 13.7% in men and 14.5% in women, and the overall age-standardized IFG prevalence was as high as 14.1%.17 However, a nationally representative study conducted in 31 provinces in mainland China from 2015 to 2017 showed that according to the 2018 American Diabetes Association (ADA) IFG diagnostic criteria, IFG and impaired glucose tolerance (IGT) weighted incidence rate is as high as 35.2%.18 The increasing incidence of IFG suggests that we should promote prevention before treatment, improve early diagnosis of IFG, and seize the critical period of early intervention.
Currently, fasting blood glucose and oral glucose tolerance test (OGTT) are commonly used clinical detection methods to diagnose IFG. However, in reality, blood glucose monitoring may cause some IFG patients to be missed during screening, OGTT cannot carry out a comprehensive assessment accurately in a wide range of people because of cumbersome, time-consuming, and low acceptability. Therefore, an efficient and convenient tool is needed other than the two methods mentioned above to more accurately and comprehensively predict the risk of IFG, and risk prediction models may meet this need. Precisely, in health care systems, predictive models play an essential role in tertiary disease prevention systems as an effective tool for risk assessment, decision selection, and benefit evaluation. Based on this situation, our study aims to construct an efficient clinical and laboratory-based nomogram (CLN) model which could prominently increase the early diagnosis rate of IFG in the general population and then strengthen the prevention of IFG-related diseases.
Materials and Methods
Study Population
All subjects were health checkers at the Health Management Center of the Second Hospital of Dalian Medical University, and two datasets from different years were obtained. Since personal information was collected anonymously before analysis, and no intervention and therapeutic measures were involved in this study, a waiver of written informed consent was requested, and through the strict process review of the relevant departments of the hospital. To build a model with the best predictive performance possible, among the two independent datasets, we chose to use the data with the most variables as the model development dataset (from 2020), it contains thirty-nine common features of 3561 subjects, mainly used for model development and internal validation. Another dataset from health checkers in 2016 was used for independent validation of the CLN model. Ethical review was granted by the Institutional Ethics Committee of the Second Hospital of Dalian Medical University (Version number: 01; Version date: 2020, 12, 01), and our study complies with the Declaration of Helsinki. A flow diagram of the study is shown in (Figure 1).
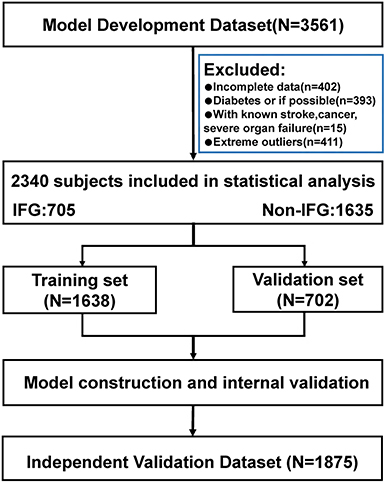 |
Figure 1 Flow chart of the research. |
Model Development Dataset
It includes 3561 subjects (age range: 20–83 years) for the period from January 2020 to December 2020. Exclusion criteria: a: presence of diabetes or if possible; b: stroke; c: cancer; d: severe organ failure; e: extreme outliers (defined as values beyond 4 standard deviations of the mean level); f: missing data. A total of 3561 subjects were retrieved in the construction of this dataset, we excluded 402 subjects because of inadequate data collection; 393 subjects for known diabetes or if possible; 15 subjects for known stroke, cancer, or severe organ failure, as well, data for 411 subjects had extreme outliers were excluded, too. Finally, 2340 subjects were included in the statistical analysis system eventually, and these subjects were randomized to the training set (N = 1638) and validation set (N = 702) in a 7:3 ratio based on computer-generated random numbers.
Independent Validation Dataset
To comprehensively evaluate the application effect of the CLN model in the general population, we only excluded the subjects that had missing data in the independent validation dataset, which made it impossible to output the evaluation results, and the rest of the subjects were included in the validation analysis. The independent validation dataset finally included 1875 subjects in 2016, 448 subjects with IFG.
Variables Measurement
We collected demographic information, anthropometric results, blood laboratory measurements, and auxiliary examination results. Demographic information included examination time, gender, age, family history (FH), history of alcohol and tobacco (HAT), and history of diseases; these items were collected by the physicians before the physical examination. All anthropometric items were completed by medical staff with extensive work experience. Height, weight, and waist circumference (WC) were measured from a standing position. Systolic blood pressure (SBP) and diastolic blood pressure (DBP) were measured on the right upper arm after 5 minutes of rest. The body mass index (BMI) was derived as weight divided by the square of height (kg/m2). After overnight fasting for at least 8 hours, blood samples (venous blood) were collected in the morning and processed by automated chemistry analyzers. The main indexes were fasting blood glucose (FBG), vitamin D (VD, 25-OH-D), vitamin D2 (VD2, 25-OH-D2), vitamin D3 (VD3, 25-OH-D3), white blood cell count (WBC), red blood cell count (RBC), neutrophil count (NEU), lymphocyte count (LYM), hemoglobin (Hb), platelet count (PLT), alanine aminotransferase (ALT), aspartate aminotransferase (AST), total protein (TP), albumin (ALB), globulin (GLO), gamma-glutamyl transpeptidase (γ-GGT), alkaline phosphatase (ALP), total Bilirubin (TBIL), direct Bilirubin (DBIL), albumin/globulin (A/G), blood urea nitrogen (UREA), serum creatinine (CREA), uric acid (UA), total cholesterol (TC), triglyceride (TG), low-density lipoprotein cholesterol (LDL) and high-density lipoprotein cholesterol (HDL). The imaging examination in this study mainly referred to thyroid ultrasound and abdominal ultrasound, carried out by professional sonographers.
Definitions
Key Event
IFG, meeting the following criteria can be defined as IFG: fasting glucose: 100–125mg/L (5.6–6.9 mmol/L).1
Other Events
Increased blood pressure (IBP), meeting any of the following criteria can be defined as IBP, a: single SBP ≥140 mmHg and/or DBP≥ 90 mmHg, b: self-reported diagnosis of hypertension or intake of anti-hypertension medicine. Diabetes and possible diabetic patients refer to self-reported medical history with a definitive diagnosis of diabetes or fasting glucose ≥ 7.0mmol/L). Diabetic family history (DFH) was categorized into yes/no based on self-reported family history information (primarily first-degree relatives). Thyroid nodule/thyroid cyst (TN/TC) and fatty liver disease (FLD) were all diagnosed on ultrasound, no matter the size or severity.
Statistical Analyses
Statistical analysis was performed using SPSS (version 25.0) and R software (version 4.0.5). Categorical variables were reported as frequency and proportions (n, %). The normality test (Kolmogorov–Smirnov test) was carried out for continuous variables, continuous variables were reported as median (IQR, interquartile range) or mean ± standard deviation (M ± SD). Mann–Whitney U-test was used to compare continuous variables, while categorical variables were compared by the Chi-square test. The least absolute shrinkage and selection operator (LASSO) regression analysis was performed using the “glmnet” R package. The logistic regression analysis, the CLN model construction plot, and the CLN model calibration plots were performed in the ‘rms’ R package. The DCA was performed using a “dca” function in R. Differences were considered statistically significant at two-sided p-values of <0.05.
Model Construction
Firstly, we identified independent predictive variables using three main steps. In the training set, variables with statistically significant differences between the IFG and NON-IFG groups were identified by univariate analysis. Then, filter out components with non-zero coefficients by LASSO regression, and the suitable tuning parameter (λ) for the LASSO regression was determined using cross-validation. Subsequently, the predictors used to construct the CLN model were confirmed by stepwise multinomial logistic regression, with results presented as odds ratio (OR) with an associated 95% confidence interval (95% CI) and corresponding p-value. Secondly, the CLN model was constructed based on the variables screened in the above steps. In addition, we randomly selected a subject to show an application example of the CLN model.
Performance Assessment
Forecasting ability was calculated for subjects according to the formula used to construct the CLN model. The receiver operating characteristic (ROC) curves and the area under the ROC curve (AUC) values were then used to evaluate the predictive discrimination of the CLN model in both training and validation sets (the AUC value was the same as Harrell’s concordance index (C-index)). The goodness of fit in both sets was also evaluated using the calibration curves. DCA was used to evaluate the clinical utility of the CLN model based on net benefits at different threshold probabilities. In addition to the above, the performance of the CLN model was independently validated at the AUC level of the independent validation dataset.
Results
Characteristics of Subjects in Model Development Dataset
Out of 2340 total subjects, 705 (about 30.13%) of them were with IFG. Meanwhile, 1638 subjects were included in the training set (487 were in the IFG group), and 702 subjects were assigned to the validation set (218 were in the IFG group). There was no significant difference between the variables in the training set and the validation set (all variables: p>0.05). The chi-square test analysis clarified that there was no statistically significant difference between the training set and the validation set in the IFG group and the Non-IFG group (χ2=0.408, p>0.05).
In the training set, the differences were statistically significant between the IFG and non-IFG groups for most variables, except for VD2, DFH, TN/TC, GLO, TBIL, DBIL, and A/G (p=0.070–0.990). In the validation set, GLO is slightly different from the results in the training set, the differences in GLO were also statistically significant between the IFG and Non-IFG groups. Although DFH was a recognized influence factor with diabetes, no significant difference was found between IFG and non-IFG groups in the training set (p=0.921) and the validation set (p=0.442). Summarized in Table 1.
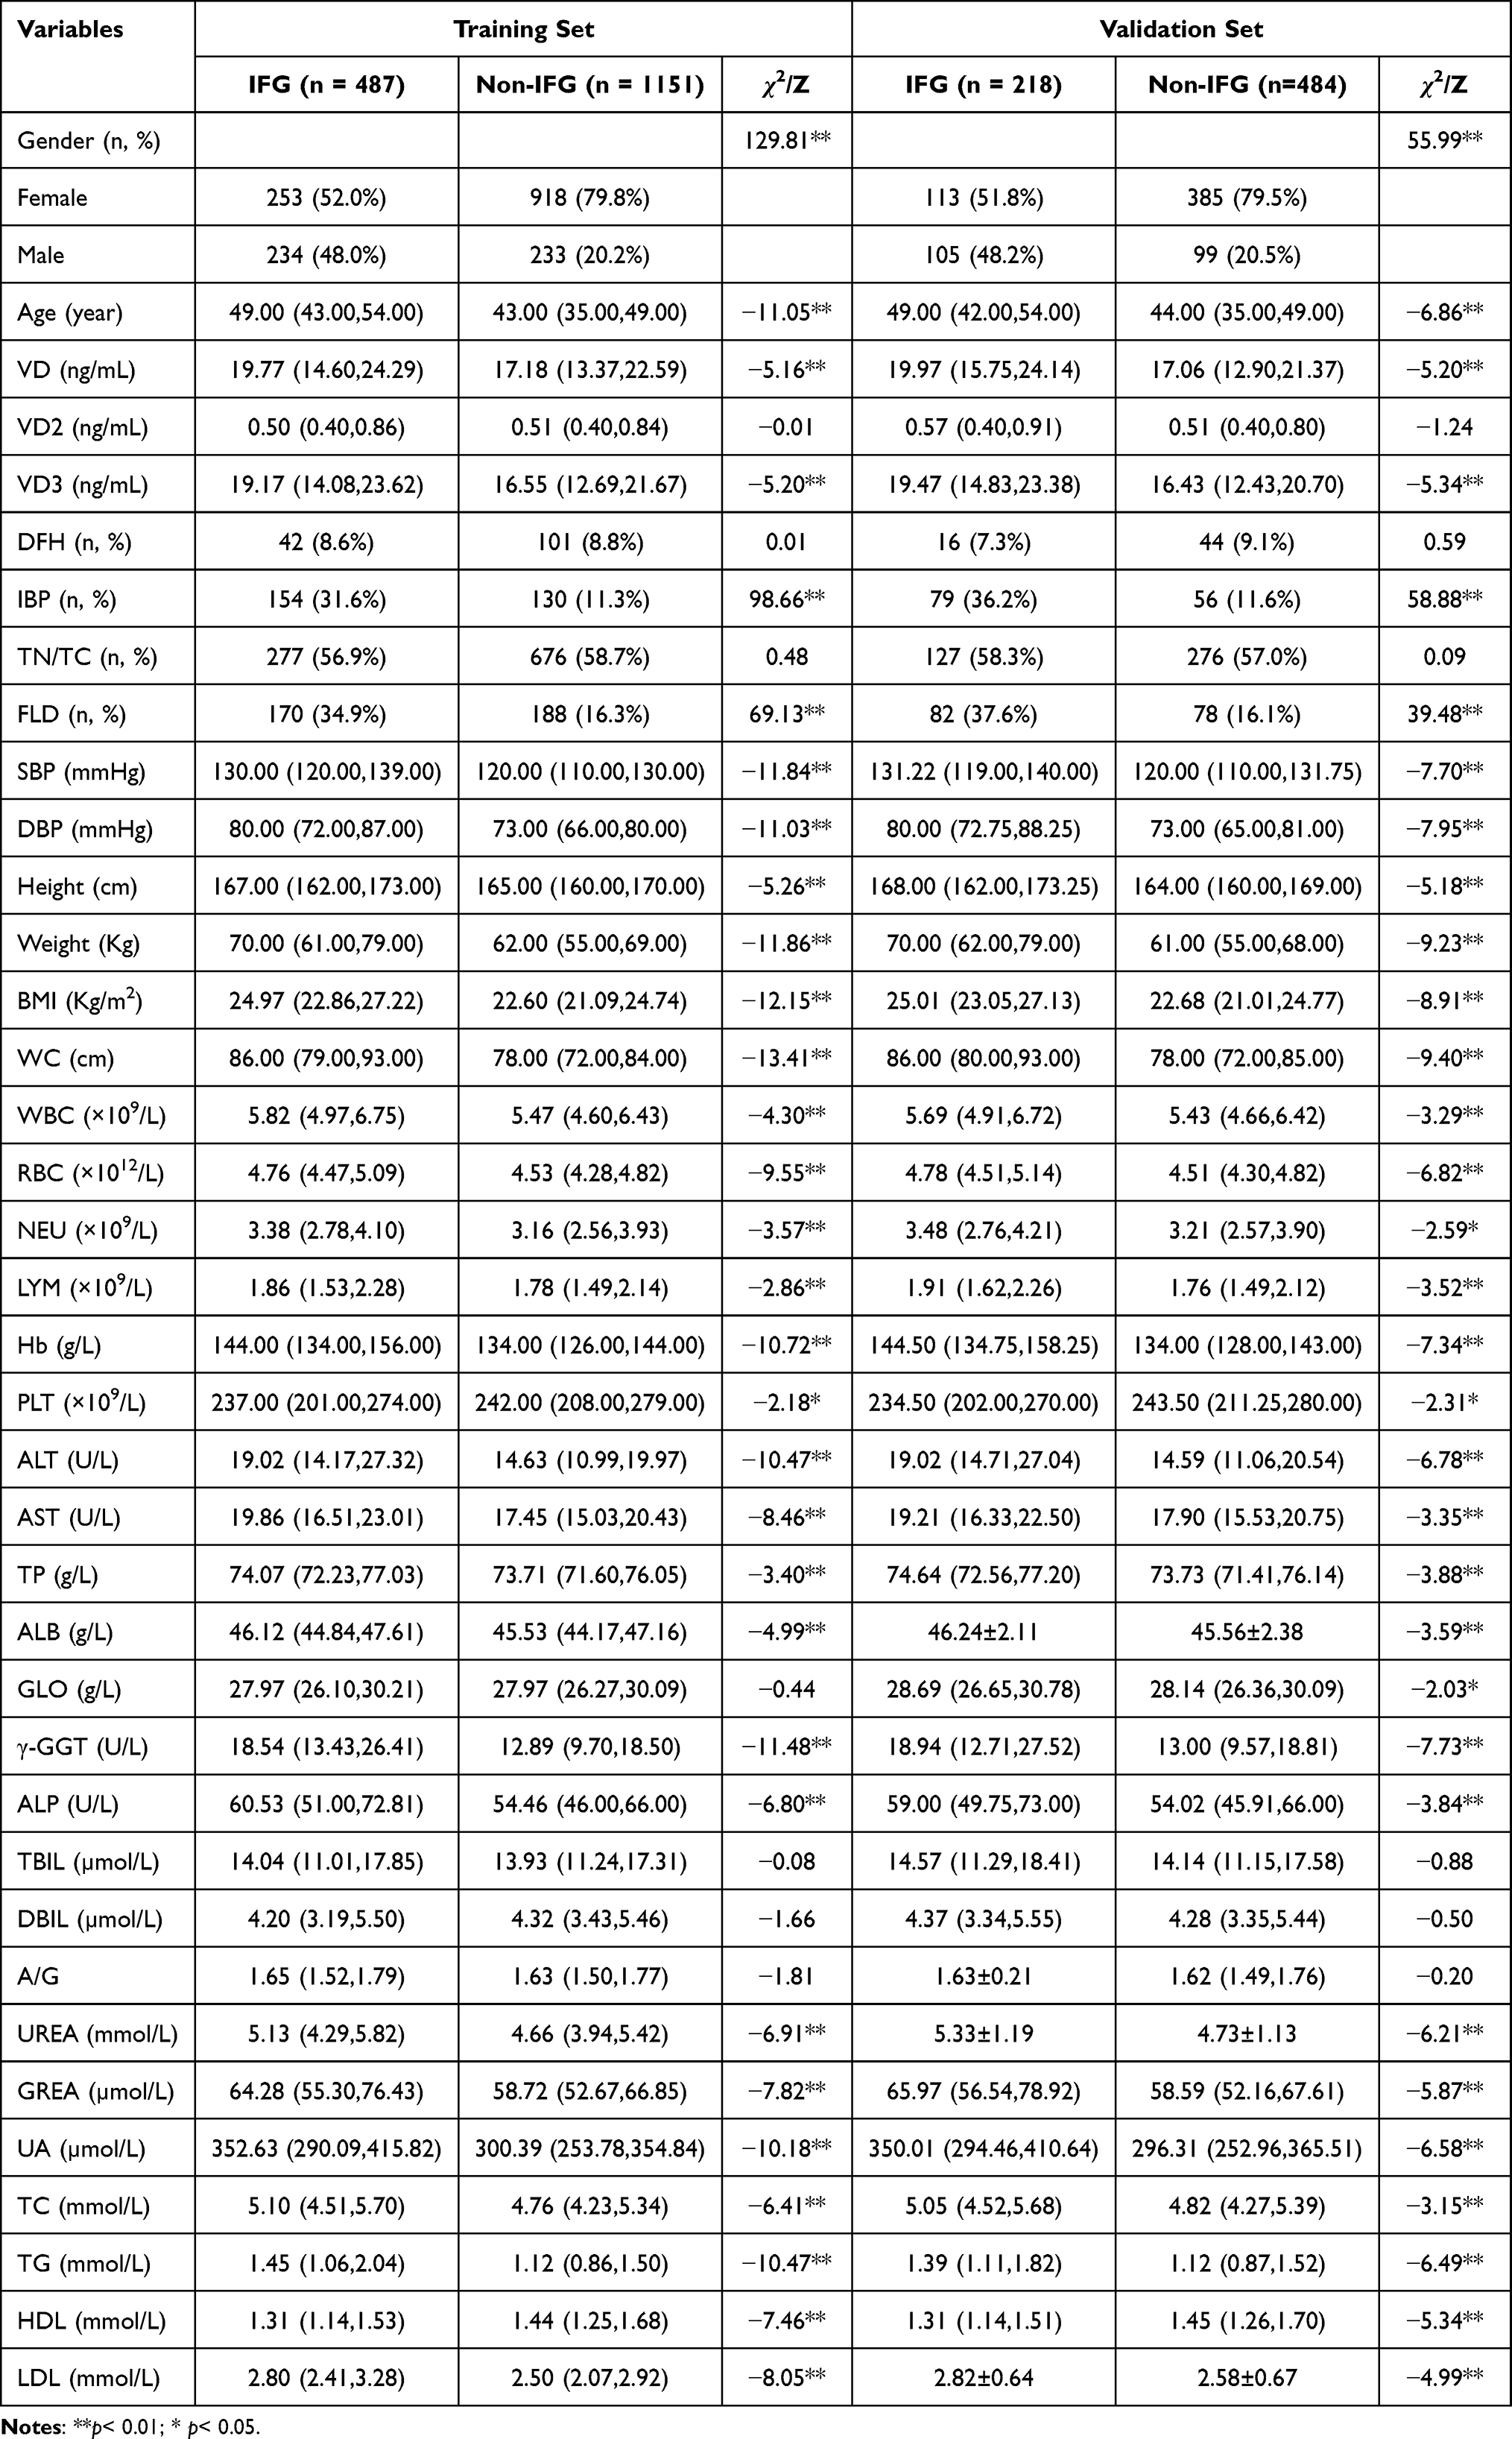 |
Table 1 Demographic and Clinical Variables of Subjects in the Model Development Dataset |
Independent Risk Factors in the Training Set
Univariate analysis showed that in the training set, the variables with statistically significant differences between IFG and Non-IFG groups were Gender, Age, VD, VD3, IBP, FLD, SBP, DBP, Height, Weight, BMI, WC, WBC, RBC, NEU, LYM, Hb, PLT, ALT, AST, TP, ALB, γ-GGT, ALP, UREA, CREA, UA, TC, TG, HDL, and LDL. They were further selected by the LASSO regression algorithm, and 15 variables with non-zero coefficients were subsequently selected through ten-fold cross-validation with an optimal lambda value of 0.008603015 (Figure 2). Eventually, backward stepwise regression analysis screened out six predictors, and age, SBP, BMI, ALB, UREA, and TG were optimal factors for the risk forecasting model.
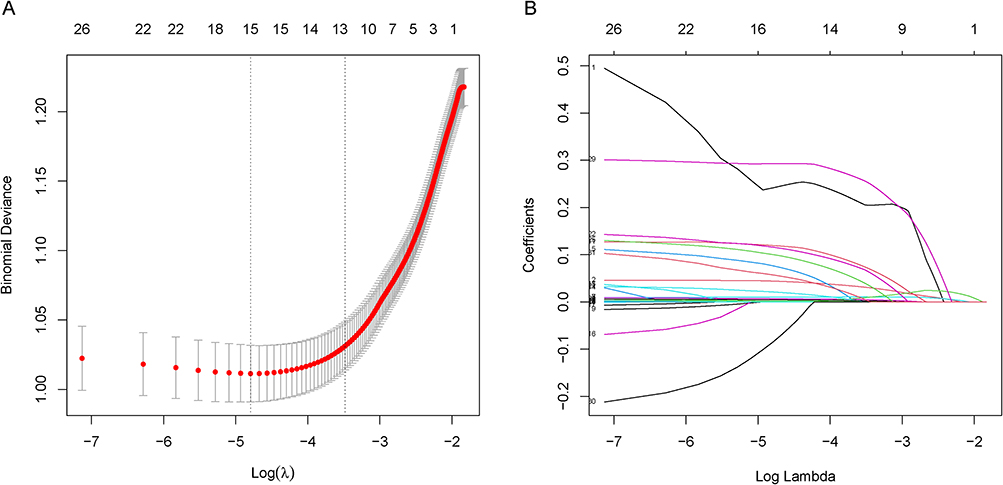 |
Figure 2 Variable selection by the LASSO logistic regression model in the training set. (A) The tuning parameter (λ) was selected via 10-fold cross-validation based on minimum criteria, and fifteen variables with non-zero coefficients were selected. (B) A coefficient profile plot of the variables was constructed against the log (lambda) sequence. |
Model Construction
The results of the backward stepwise regression analysis of these six variables are shown in Table 2. So, the CLN model ultimately included six variables: age, SBP, BMI, ALB, UREA, and TG. The CLN model constructed from the above variables was shown in (Figure 3A). Using the CLN model, the above-mentioned 6 variables of each individual will be given corresponding scores, which will be aggregated into the total points of the individual, so as to predict the risk of IFG of the individual. According to the characteristic predictors selected by the CLN model, a subject was randomly selected from the population. The subject of age 55 years, SBP of 140mmHg, BMI of 26.45 kg/m2, ALB of 48.47g/L, UREA of 6.01 mmol/L, and TG of 3.27 mmol/L, has an estimated probability of IFG of 83.60%. We can see that the CLN model can efficiently assess the risk of IFG in individuals, as was displayed in Figure 3B.
 |
Table 2 Variables Associated with IFG by the Backward Stepwise Regression Analysis |
 |
Figure 3 The CLN model for predicting IFG. (A) Presentation of the CLN model constructed based on the 6 screened predictors. (B) An example of applying the CLN model to predict the risk of IFG (The red dots represent the measured values and corresponding scores of the predictors in the model, linked by dotted lines; the small red diamonds represent the total risk scores for individuals, and the arrows indicate the individual risk prediction values for developing IFG). |
Validation and Accuracy of the CLN Model
Figure 4 demonstrates the ROC curves of the CLN model in the training set and validation set, and the AUC value of the CLN model was 0.783 (95CI:0.759–0.807) in the training set (p<0.05) and 0.789 (95CI: 0.753–0.825) in the validation set (p<0.05), after 1000 bootstrap resamples, the AUC values were 0.780 (the training set) and 0.789 (the validation set). From the ROC analysis, we identified the cut-off values using the Youden Index, and the cut-off value was −0.956 in the training set and −0.829 in the validation set. The sensitivity and specificity of the CLN model were 70.2%, and 76.4% in the training set, 73.1%, and 73.9% in the validation set, respectively. The calibration curves of the CLN model for predicting IFG demonstrated good agreement between both the training set and the validation set. The Hosmer–Lemeshow (HL) goodness-of-fit test showed that the CLN model fit was good (p= 0.1181 for the training set, p= 0.4832 for the validation set). Second, the Unreliability test results showed p=0.983>0.05 in the training set and p=0.812>0.05 in the validation set, indicating that they passed the calibration degree test (Figure 5).
 |
Figure 4 The AUC values of the CLN model (A) for the training set and (B) for the validation set. |
 |
Figure 5 The calibration curves of the CLN model (A) for the training set and (B) for the validation set. |
DCA of the Clinical Utility of the CLN Model
The DCA curve demonstrated a higher net benefit of the CLN model in both training and validation sets, and the threshold probability of the CLN model was 2–72% in the training set and 7–71% in the validation set (Figure 6). Because the CLN model has good clinical benefits and has no contraindications to its use, it can be used as an early screening tool for IFG.
 |
Figure 6 The DCA curve of the CLN model for (A) training set and for (B) validation set. |
Independent Validation of the CLN Model
To evaluate the practical application performance of the CLN model, we selected data from 2016 health check-up subjects for independent validation, and the details of the independent validation dataset are presented in Table 3. The AUC of the CLN model in this dataset is 0.801 (Figure 7), which showed that the CLN model has good application performance.
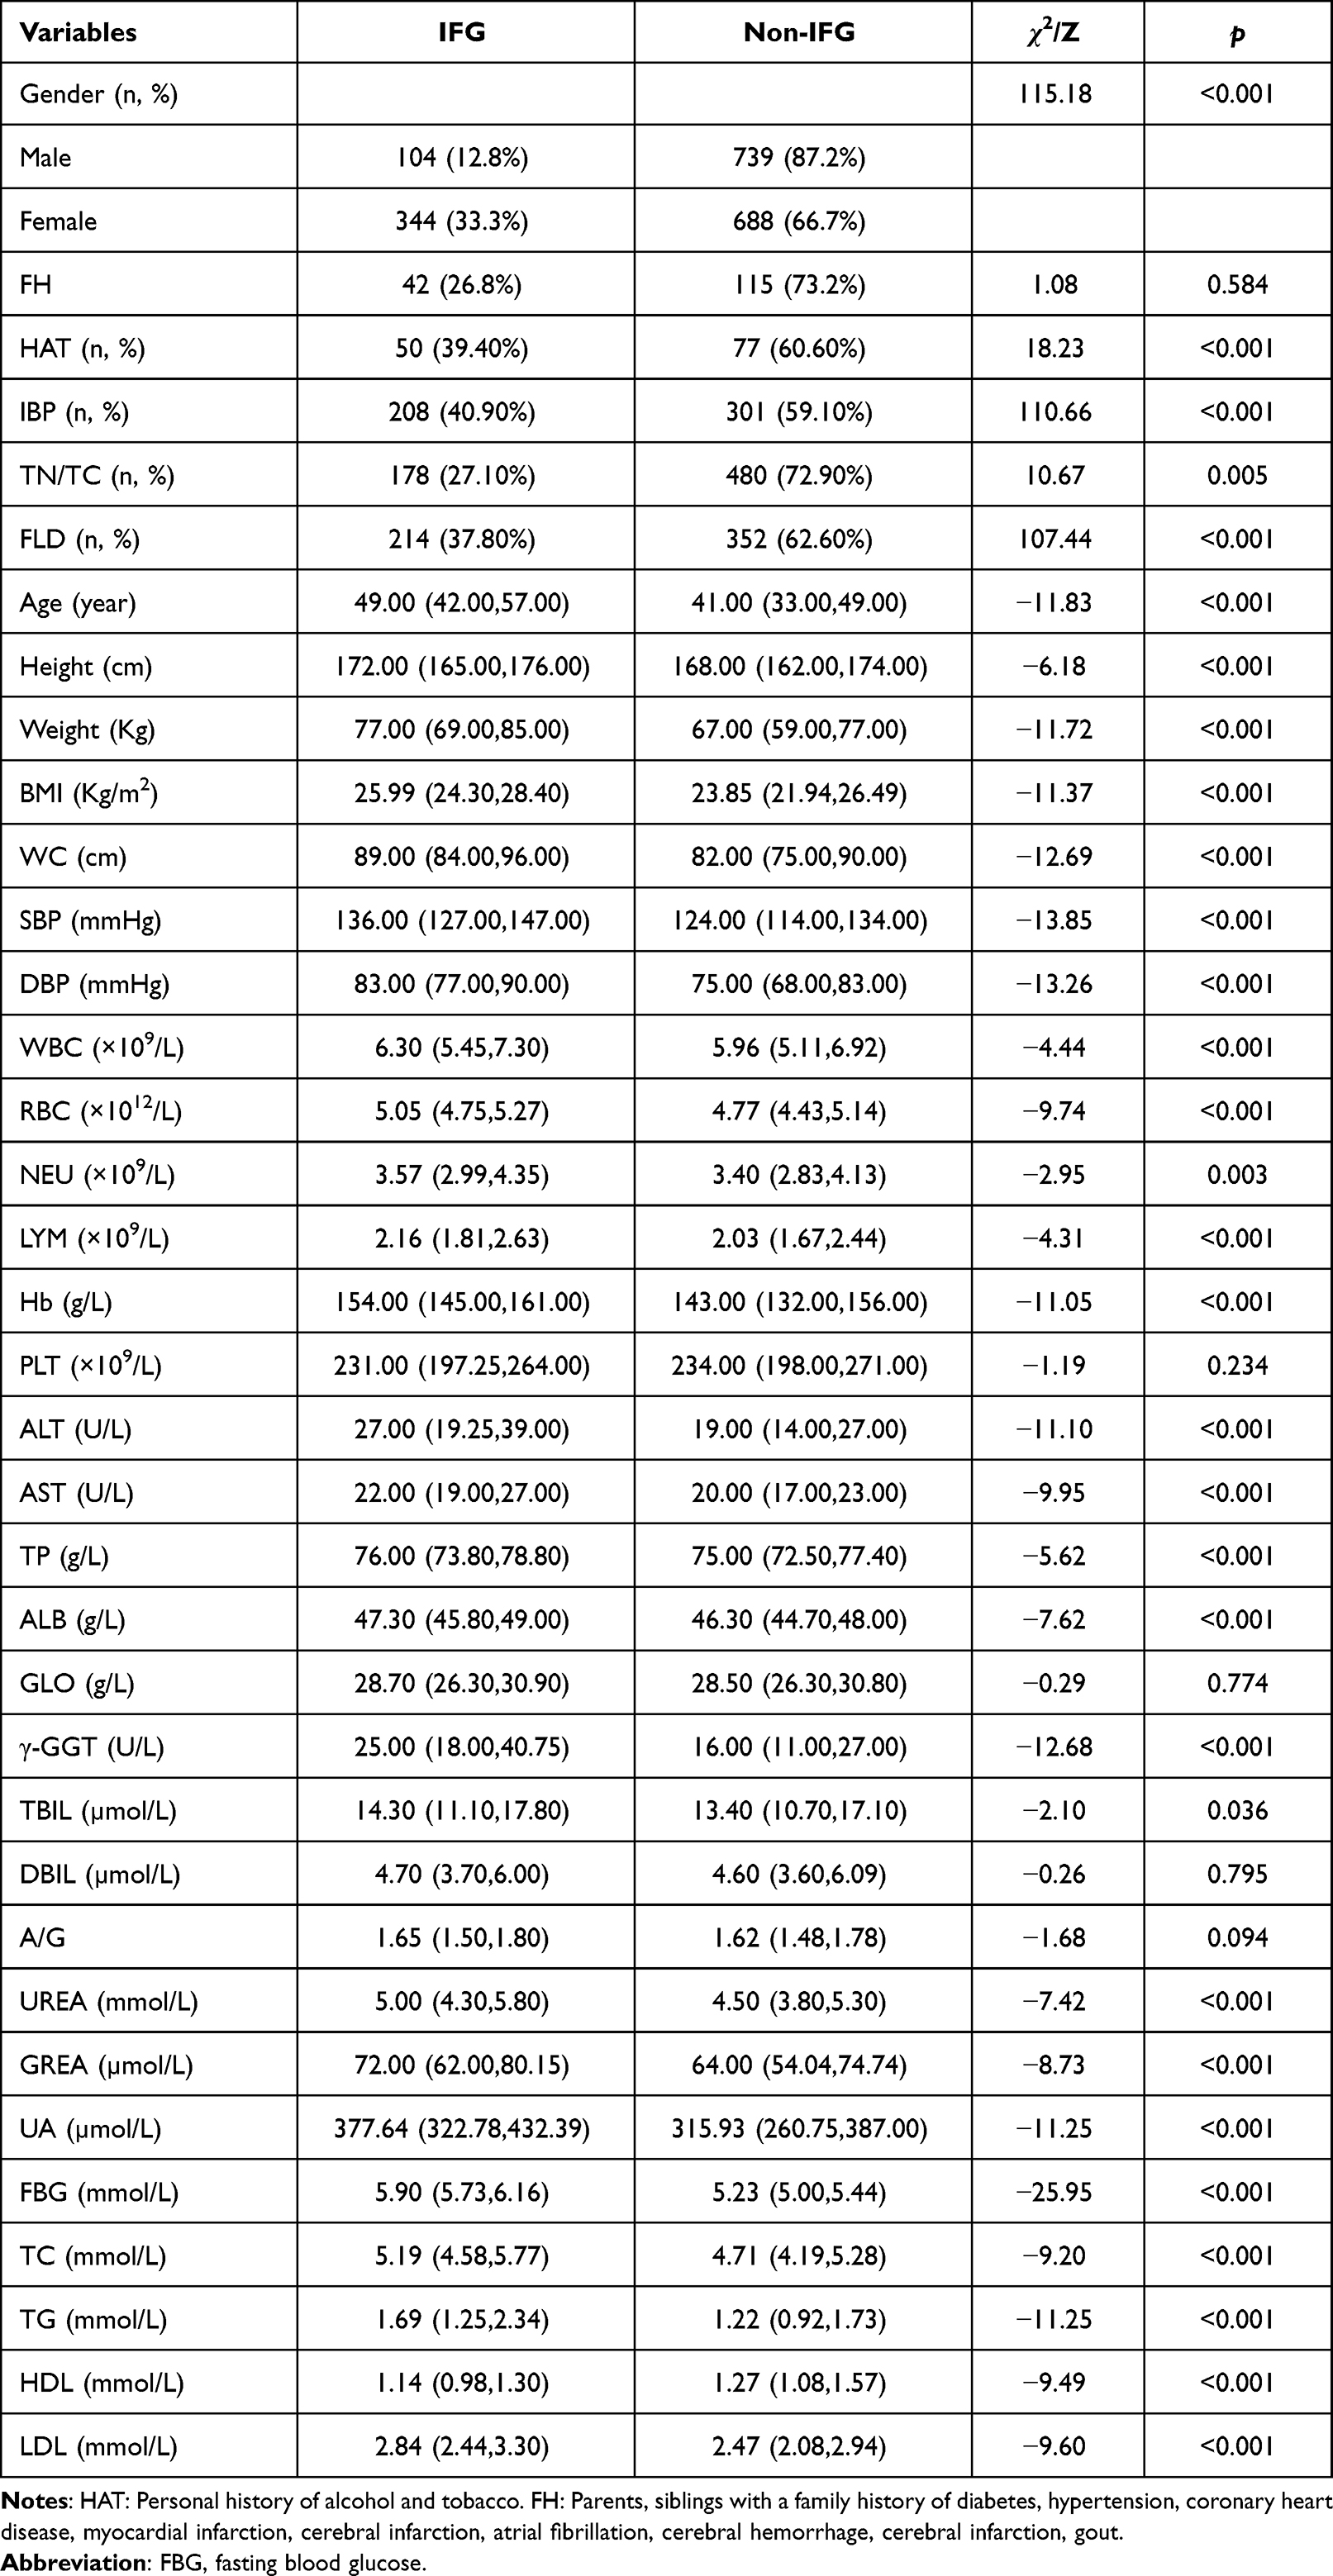 |
Table 3 Demographic and Clinical Variables of Subjects in the Model Independent Validation Dataset |
 |
Figure 7 Independent validation of the CLN model. |
Discussion
For a long time, researchers have found that IFG is associated with chronic non-infectious diseases such as T2DM and CVD. However, since the outbreak of Corona Virus Disease 2019 (COVID-19), and with the deepening of research, it is found that IFG is associated with higher risks of complications and mortality among patients with COVID-19.19 From this, it can be seen that IFG plays an important role in the clinical development and progression of non-infectious and infectious diseases, therefore, there is a greater need to enhance the screening and management of IFG.
Several predictive tools are available to assess the risk of IFG; however, the predictive performance of these tools is relatively low and has not been independently validated in the study. For example, Haewon Byeon used the categorical boosting machine method to explore the top eight variables most relevant to the impact of IFG risk: age, high cholesterol, WHtR, BMI, drinking more than one shot per month for the past year, marital status, hypertension, and smoking, then developed a nomogram for predicting groups vulnerable to IFG in South Korean non-diabetics, its predictive performance in the non-diabetic population was AUC: 0.75,20 the predictive performance of the model in the Chinese population is unclear. Similarly, Wang et al used multivariate generalized estimating equations (GEE) to construct a model for predicting IFG risk for physical examination data from 4926 individuals, predictor variables of GEE model include male, age, WC, SBP, DBP, obesity, TG, HDL, LDL, blood urea, serum uric acid, TC, and serum creatinine levels, the AUC of the GEE model was 0.74 in the training set and 0.75 in the validation set.21
In this study, we constructed the CLN model to assist in the diagnosis of IFG among the general population of China. The AUC of the CLN model is as high as 0.783 and 0.789 in the training and validation sets, respectively. Further, we independently validate the performance of the CLN model, we comprehensively evaluated the predictive performance of the CLN model in a mixed population that included different states of glucose metabolism, and the results indicated that the AUC of the CLN model was 0.801. These results all demonstrate that the CLN model has the good predictive ability and guiding clinical significance.
The CLN model included six independent risk factors that were significantly associated with the occurrence of IFG. Among them, age, SBP, BMI, and TG as risk factors for IFG have been extensively confirmed in previous studies.22–26 Noteworthily, ALB and UREA were considered as indicators for IFG in the CLN model. For ALB and glucose metabolism, Bhat et al by mass spectrometry analysis of circulating immune complexes showed that serum albumin levels in the plasma of diabetic mice were higher than those of control animals and considered that this phenomenon was associated with altered advanced glycation end product (AGE) modifications.27 The results of this study suggest that serum albumin increases when blood glucose is elevated, thus providing better discriminatory power for albumin as a predictor of IFG. Similarly, we found ALB to be a significant risk factor for IFG in a multifactorial stepwise regression analysis, with an OR second only to TG. Moreover, UREA is an important predictor in the CLN model, and in previous studies, it was used less as a predictor of abnormal glucose metabolism. Only a part of studies have mentioned that IFG patients have higher UREA levels than normal glucose metabolizers.21,28 Our study further confirms the important value of UREA in IFG risk prediction.
With the CLN model, we would expect to effectively identify individuals who are at high risk for IFG. Afterward, we can do early health care interventions, lifestyle changes, and advanced treatment processes, thus greatly slowing down the progression or ultimately reducing the incidence of diseases such as diabetes and CVD,29 which will contribute to reducing the economic burden of IFG-related medical care. In summary, the CLN model composed of the simple and available clinical variables has good reliability for clinical screening in the general population.
The CLN model with excellent predictive power was constructed from 6 common clinical measures and laboratory indicators. Efficient prediction and the absence of contraindications to use are some of the strengths of the CLN model. Independent validation confirms that the high performance of the CLN model is another strength of this study. Some limitations of our study have to be underlined. This was a single-area study, and if research can be conducted in a multi-region setting, or further validated in other parts of China, the value of the model may be better explored.
Conclusion
We constructed and validated the CLN model to predict the risk of IFG. Through the application of the CLN model, we can identify individuals who are at a high risk of IFG. Even if a patient is missed in blood glucose tests, we can predict the risk of IFG by considering other risk factors and thus alerting the patient to early prevention. It is not only helpful for early intervention but also helpful to reduce the medical burden of IFG-related diseases.
Data Sharing Statement
The datasets generated for this study are available on request to the corresponding author.
Acknowledgments
We gratefully acknowledge all the subjects who enabled this study. We sincerely thank all authors for their hard work and dedication.
Author Contributions
All authors made a significant contribution to the work reported, whether that is in the conception, study design, execution, acquisition of data, analysis and interpretation, or in all these areas; took part in drafting, revising or critically reviewing the article; gave final approval of the version to be published; have agreed on the journal to which the article has been submitted; and agree to be accountable for all aspects of the work.
Funding
This work was supported by the United Fund of the Second Hospital of Dalian Medical University, Dalian Institute of Chemical Physics, Chinese Academy of Sciences (UF-ZD-202011), Project of Education Department of Liaoning Province (LZ2020009), and Liaoning Provincial Natural Science Foundation (2023-MS-272).
Disclosure
The authors declare that they have no competing interests.
References
1. American Diabetes Association. 2. classification and diagnosis of diabetes: standards of medical care in diabetes-2020. Diabetes Care. 2020;43(Suppl1):S14–S31. doi:10.2337/dc20-S002
2. Gong Q, Zhang P, Wang J, et al. Efficacy of lifestyle intervention in adults with impaired glucose tolerance with and without impaired fasting plasma glucose: a post hoc analysis of Da Qing diabetes prevention outcome study. Diabetes Obes Metab. 2021;23(10):2385–2394. doi:10.1111/dom.14481
3. Hibi M, Hari S, Yamaguchi T, Mitsui Y, Kondo S, Katashima M. Effect of short-term increase in meal frequency on glucose metabolism in individuals with normal glucose tolerance or impaired fasting glucose: a randomized crossover clinical trial. Nutrients. 2019;11(9):2126. doi:10.3390/nu11092126
4. Sampson M, Clark A, Bachmann M, et al. Lifestyle intervention with or without lay volunteers to prevent type 2 diabetes in people with impaired fasting glucose and/or nondiabetic hyperglycemia: a randomized clinical trial. JAMA Intern Med. 2021;181(2):168–178. doi:10.1001/jamainternmed.2020.5938
5. Jeong S, Min Cho J, Kwon YI, Kim SC, Yeob Shin D, Ho Lee J. Chitosan oligosaccharide (GO2KA1) improves postprandial glycemic response in subjects with impaired glucose tolerance and impaired fasting glucose and in healthy subjects: a crossover, randomized controlled trial. Nutr Diabetes. 2019;9(1):31. doi:10.1038/s41387-019-0099-4
6. Kim MK, Han K, Koh ES, et al. Cumulative exposure to impaired fasting glucose and future risk of type 2 diabetes mellitus. Diabetes Res Clin Pract. 2021;175:108799. doi:10.1016/j.diabres.2021.108799
7. Wang X, Zhou YF, Huang Z, et al. Changes in impaired fasting glucose and borderline high low-density lipoprotein-cholesterol status alter the risk of cardiovascular disease: a 9-year prospective cohort study. Front Cardiovasc Med. 2022;9:882984. doi:10.3389/fcvm.2022.882984
8. Lind V, Hammar N, Lundman P, et al. Impaired fasting glucose: a risk factor for atrial fibrillation and heart failure. Cardiovasc Diabetol. 2021;20(1):227. doi:10.1186/s12933-021-01422-3
9. Zupo R, Castellana F, Sardone R, et al. Impaired fasting plasma glucose is a risk indicator of interventricular septum thickening among non-diabetic subjects with obesity. Diabetes Res Clin Pract. 2020;169:108436. doi:10.1016/j.diabres.2020.108436
10. Jin C, Li G, Rexrode KM, et al. Prospective study of fasting blood glucose and intracerebral hemorrhagic risk. Stroke. 2018;49(1):27–33. doi:10.1161/STROKEAHA.117.019189
11. Lee SH, Han K, Kwon HS, Kim MK. Frequency of exposure to impaired fasting glucose and risk of mortality and cardiovascular outcomes. Endocrinol Metab. 2021;36(5):1007–1015. doi:10.3803/EnM.2021.1218
12. Bommer C, Sagalova V, Heesemann E, et al. Global economic burden of diabetes in adults: projections from 2015 to 2030. Diabetes Care. 2018;41(5):963–970. doi:10.2337/dc17-1962
13. Bragg F, Li L, Yang L, et al. Risks and population burden of cardiovascular diseases associated with diabetes in China: a prospective study of 0.5 million adults. PLoS Med. 2016;13(7):e1002026. doi:10.1371/journal.pmed.1002026
14. Global Burden of Metabolic Risk Factors for Chronic Diseases Collaboration. Cardiovascular disease, chronic kidney disease, and diabetes mortality burden of cardiometabolic risk factors from 1980 to 2010: a comparative risk assessment. Lancet Diabetes Endocrinol. 2014;2(8):634–647. doi:10.1016/S2213-8587(14)70102-0
15. Centers for Disease Control and Prevention (CDC). Prevalence of diabetes and impaired fasting glucose in adults – United States, 1999–2000. MMWR Morb Mortal Wkly Rep. 2003;52(35):833–837.
16. Rutkowski M, Wojciechowska A, Śmigielski W, et al. Prevalence of diabetes and impaired fasting glucose in Poland in 2005–2014: results of the WOBASZ surveys. Diabet Med. 2020;37(9):1528–1535. doi:10.1111/dme.14333
17. Tian H, Song G, Xie H, Zhang H, Tuomilehto J, Hu G. Prevalence of diabetes and impaired fasting glucose among 769,792 rural Chinese adults. Diabetes Res Clin Pract. 2009;84(3):273–278. doi:10.1016/j.diabres.2009.03.015
18. Li Y, Teng D, Shi X, et al. Prevalence of diabetes recorded in mainland China using 2018 diagnostic criteria from the American Diabetes Association: national cross sectional study. BMJ. 2020;369:m997. doi:10.1136/bmj.m997
19. Zhang J, Kong W, Xia P, et al. Impaired fasting glucose and diabetes are related to higher risks of complications and mortality among patients with coronavirus disease 2019. Front Endocrinol. 2020;11:525. doi:10.3389/fendo.2020.00525
20. Byeon H. Exploring the risk factors of impaired fasting glucose in middle-aged population living in South Korean communities by using categorical boosting machine. Front Endocrinol. 2022;13:1013162. doi:10.3389/fendo.2022.1013162
21. Wang Y, Wang L, Su Y, Zhong L, Peng B. Prediction model for the onset risk of impaired fasting glucose: a 10-year longitudinal retrospective cohort health check-up study. BMC Endocr Disord. 2021;21(1):211. doi:10.1186/s12902-021-00878-4
22. Lin SX, Berlin I, Younge R, et al. Does elevated plasma triglyceride level independently predict impaired fasting glucose?: the multi-ethnic study of atherosclerosis (mesa). Diabetes Care. 2013;36(2):342–347. doi:10.2337/dc12-0355
23. Rutkowski M, Bandosz P, Czupryniak L, et al. Prevalence of diabetes and impaired fasting glucose in Poland--The NATPOL 2011 study. Diabet Med. 2014;31(12):1568–1571. doi:10.1111/dme.12542
24. Zhao Q, Zhen Q, Li Y, et al. Prevalence and risk factors of impaired fasting glucose among adults in northeast China: a cross-sectional study. Endocr Pract. 2018;24(7):677–683. doi:10.4158/EP-2018-0046
25. Li S, Guo S, He F, et al. Prevalence of diabetes mellitus and impaired fasting glucose, associated with risk factors in rural Kazakh adults in Xinjiang, China. Int J Environ Res Public Health. 2015;12(1):554–565. doi:10.3390/ijerph120100554
26. Zhang FL, Xing YQ, Guo ZN, Wu YH, Liu HY, Yang Y. Prevalence and risk factors for diabetes and impaired fasting glucose in Northeast China: results from the 2016 China National Stroke Screening Survey. Diabetes Res Clin Pract. 2018;144:302–313. doi:10.1016/j.diabres.2018.09.005
27. Bhat S, Jagadeeshaprasad MG, Patil YR, et al. Proteomic insight reveals elevated levels of albumin in circulating immune complexes in diabetic plasma. Mol Cell Proteomics. 2016;15(6):2011–2020. doi:10.1074/mcp.M116.058008
28. Gao Y, Xu B, Yang Y, et al. Association between serum uric acid and carotid intima-media thickness in different fasting blood glucose patterns: a case-control study. Front Endocrinol. 2022;13:899241. doi:10.3389/fendo.2022.899241
29. Braga T, Kraemer-Aguiar LG, Docherty NG, Le Roux CW. Treating prediabetes: why and how should we do it? Minerva Med. 2019;110(1):52–61. doi:10.23736/S0026-4806.18.05897-4
 © 2023 The Author(s). This work is published and licensed by Dove Medical Press Limited. The
full terms of this license are available at https://www.dovepress.com/terms
and incorporate the Creative Commons Attribution
- Non Commercial (unported, 3.0) License.
By accessing the work you hereby accept the Terms. Non-commercial uses of the work are permitted
without any further permission from Dove Medical Press Limited, provided the work is properly
attributed. For permission for commercial use of this work, please see paragraphs 4.2 and 5 of our Terms.
© 2023 The Author(s). This work is published and licensed by Dove Medical Press Limited. The
full terms of this license are available at https://www.dovepress.com/terms
and incorporate the Creative Commons Attribution
- Non Commercial (unported, 3.0) License.
By accessing the work you hereby accept the Terms. Non-commercial uses of the work are permitted
without any further permission from Dove Medical Press Limited, provided the work is properly
attributed. For permission for commercial use of this work, please see paragraphs 4.2 and 5 of our Terms.