Back to Journals » Infection and Drug Resistance » Volume 16
Construction and Analysis of ceRNA Networks Reveal the Key Genes Associated with Bovine Herpesvirus Type 1 Infection
Authors Song B, Huang Y, Ma J, Yu L, Yu Y, Peng C, Wu W
Received 17 May 2023
Accepted for publication 28 July 2023
Published 31 August 2023 Volume 2023:16 Pages 5729—5740
DOI https://doi.org/10.2147/IDR.S411034
Checked for plagiarism Yes
Review by Single anonymous peer review
Peer reviewer comments 2
Editor who approved publication: Prof. Dr. Héctor Mora-Montes
Baifen Song,1 Yanmei Huang,2 Jinzhu Ma,2 Liquan Yu,2 Yongzhong Yu,2 Chen Peng,1 Wenxue Wu1
1Key Laboratory of Animal Epidemiology and Zoonosis, College of Veterinary Medicine, China Agricultural University, Beijing, People’s Republic of China; 2The College of Life Science and Technology, Heilongjiang Bayi Agricultural University, Daqing, People’s Republic of China
Correspondence: Wenxue Wu, Key Laboratory of Animal Epidemiology and Zoonosis, College of Veterinary Medicine, China Agricultural University, Beijing, 100193, People’s Republic of China, Tel/Fax +86-010-62733048, Email [email protected]
Background: Virus infection can cause the changes of lncRNA expression levels to regulate the interaction between virus and host, but the relationship between BHV-1 infection and lncRNA has not been reported.
Methods: In this study, in order to reveal the molecular mechanism of RNA in BoHV-1 infection, the Madin-Darby bovine kidney (MDBK) cells were infected with BoHV-1, transcriptome sequencing were performed by next-generation sequencing at 18 h or 24 h or 33 h of viral infection and then based on the competitive endogenous RNA (ceRNA) theory, lncRNA-miRNA-mRNA networks were constructed using these high-throughput sequencing data. The network analysis, Gene Ontology (GO) and Kyoto Encyclopedia of Genes and Genomes (KEGG) pathway analysis were performed for functional annotation and exploration of ncRNA ceRNAs in BoHV-1 infection.
Results: The results showed that 48 lncRNAs, 123 mRNAs and 20 miRNAs as differentially expressed genes, and the mitogen activated protein kinase (MAPK) pathway and calcium signaling pathway were significantly enriched in the ceRNA network. Some differentially expressed lncRNA genes were randomly selected for verification by RT-qPCR, and the results showed that their expression trend was consistent with the results of transcriptome sequencing data.
Conclusion: This study revealed that BoHV-1 infection can affect the expression of RNAs in MDBK cells and the regulation of ceRNA network to carry out corresponding biological functions in the host, but further experimental studies are still necessary to prove the hub genes function in ceRNA network and the molecular mechanism in BoHV-1 infection.
Keywords: BoHV-1, bioinformatics analysis, ceRNA network, next-generation sequencing
Introduction
BoHV-1, Alphaherpesvirinae subfamily of the family Herpesviridae1 with double-stranded DNA in the capsule, is a primary virulent pathogen of cattle diseases.2 The genome of BoHV-1 is about 135 KB, its diameter of virus particles is about 150 to 220 nm, enabling it to invade mucosal epithelial cells of the upper respiratory tract and those of the reproductive tract of cattle and proliferate in large numbers at the site of infection, resulting in cytopathic effects (CPE).3 BoHV-1 mainly infects cattle and causes respiratory and reproductive diseases and is associated with other clinical symptoms and systemic diseases of newborn calves,4 which causes significant economic losses to beef and dairy cattle industry all over the world.
Competing endogenous RNA (ceRNA) is the RNA in the complex transcriptional regulation network of an organism, which mainly includes messenger RNA (mRNA), long-chain non-coding RNA (lncRNA), microRNA (miRNA), circular RNA (circRNA) and pseudogenes.5,6 The regions of these RNAs that can be bound by miRNAs are called microRNA response elements (MRE).7 These RNAs compete through common MREs to bind common miRNAs, affecting and regulating the expression of target gene transcripts. In organisms, these ceRNA interactions play important biological functions, such as lncRNA five prime to Xist (LncRNA FTX) can regulate the progression of colorectal cancer (CRC) through miR-192-5p/EIF5A2 Axis.8 LncRNA34977 is a lncRNA that is highly expressed in canine mammary tumors. It can promote progression of canine mammary tumors through regulating the expression of miR-8881/ELAVL4,9 LncRNA DANCR functions as a miR-33b sponge to positively regulate proliferation and metastasis in pancreatic cancer.10 Suman Ghosal et al11 identified a large number of non-coding transcripts as immune response-related genes through the ceRNA network. Rahmani-Kukia N and Abbasi A12 identified the potential application of circRNAs as an antiviral vaccine such as SARS-CoV-2 through ceRNA network analysis.
In recent years, RNA sequencing (RNA-Seq) based on next-generation sequencing technology has become an effective tool for screening genomic variation associated with different phenotypic traits and identifying molecular mechanisms of viral infection,13 but to the best of our knowledge, there is no report on ceRNA networks in BoHV-1 virus infected cells. MDBK cells were infected and sequenced by next-generation sequencing in this study. lncRNA-miRNA-mRNA networks were constructed using these high-throughput sequencing data to analyze the potential specific molecular functions and mechanisms. Then, function enrichment analyses and annotation were used to explore the importance of ncRNA ceRNAs in MDBK cells of BoHV-1 infection. From this, ceRNA function in virus-infected cells was analyzed and this enhanced the understanding of ncRNA regulatory networks.
Materials and Methods
Cells and Viruses
The Madin-Darby bovine kidney (MDBK) cell line (NBL-1) (ATCC CCL-22) was stored in the Cell Biology Laboratory of Heilongjiang Bayi Agricultural University. Bovine herpesvirus 1 (BoHV-1) was presented by Professor Zhu Zhanbo of Heilongjiang Bayi Agricultural University and stored in the Cell Biology Laboratory of Heilongjiang Bayi Agricultural University.
Cell Culture
The frozen MDBK cells (13 passages) were removed from liquid nitrogen and seeded onto T25 breathable cell culture flask (NEST, China) containing Dulbecco’s modified eagle medium with 10% Fetal bovine serum (Gibco, USA) at 37°C in 5% CO2 atmosphere for 24 to 48 h in the cell incubator. When the cell confluence reached 80 to 90%, the cells were digested with Trypsin-EDTA (0.25%) without phenol red (Solarbio, China), then passaged with the ratio of 1:2 in 10 cm cell culture dishes.
When the concentration of cells reached 1 × 10⁷ cells per dish, 1 MOI of BoHV-1 was inoculated to MDBK cells and cultured in DMEM media (Gibco, USA) without serum at 37°C in 5% CO2 atmosphere. Cytopathic effects (CPE) were observed by light microscopy when virus-infected cells were cultured for 18, 24, and 33 h. The samples were harvested when the CPE reached varying degrees of monolayer at 18, 24 and 33 h. The sample from each dish was washed three times with Hank’s solution (Gibco, USA) and digested with 1 mL TRIzol reagent (Life, USA). The sample was then collected into nuclease-free cell cryopreservation tubes and sealed with All-Purpose Parafilm M Laboratory Film (Parafilm, USA) before being stored in liquid nitrogen for quick freezing. Finally, the samples were sequenced by Guangzhou Genedenovo Biotechnology Co., Ltd (Guangzhou, China).
Next Generation Sequencing for Cell Samples
The extraction of cell total RNA refers to the Experimental methods of Yongfei Bai et al14 and the quality of the RNA was assessed by an Agilent 2100 Bioanalyzer and agarose gel electrophoresis without RNA enzyme. Illumina HiSeqTM 4000 platform was used for PCR amplification and sequencing by Guangzhou Genedenovo Biotechnology Co., Ltd (Guangzhou, China). Specific methods.
Data Processing
Data processing methods are mainly based on the methods of Chen S and Langmead B et al, including the filtering of read by fastp15 (version 0.18.0) and the reads were compared to the ribosomal RNA (rRNA) database using the short read comparison tool Bowtie216 (version 2.2.8). The alignment with the reference genome was determined by using HISAT2 (version 2.1.0) and detailed steps refer to the methods of Kim D et al.17 Transcripts were reconstructed using the Stringtie software (version 1.3.4).18,19 Stringtie software was used to analyze transcript abundances in a reference-based approach. The edgeR package was used to analyze the differentially expressed transcripts between the two groups (http://www.bioconductor.org/packages/release/bioc/html/edgeR.html)20. The mRNA and lncRNA were identified with a fold change greater than or equal to two and a false discovery rate (FDR) of less than 0.05 in a comparison of significantly differentially expressed genes (DEGs), and miRNA with a fold change greater than or equal to two and p < 0.05. The genes that had been rising and falling were selected in the experiment to prepare for later analysis. Mireap (Version 0.20), miRanda (Version 3.3a) and TargetScan (Version 7.0) were used for miRNA target prediction, and miRNA sequences and family information were obtained from the TargetScan website (http://www.targetscan.org/).21 The results were visualized by using R (version 3.6.1) software with Pheatmap package.22
Construction of the lncRNA-miRNA-mRNA Network
All co-expressed competing triples identified based on ceRNA theory were used to construct the mRNA-lncRNA-miRNA network and visualized using Cytoscape software (version 3.6.0).23,24 The networks were analyzed by using “Network Analyzer” which is a plug-in unit of Cytoscape software.25
Functional Enrichment Analysis
To assess the function of differentially expressed genes, GO biological processes term and KEGG pathway analyses were performed by using mRNAs in the ceRNA network. All ceRNAs were mapped to GO terms in the gene ontology database (http://www.geneontology.org/), gene numbers were calculated according to the method of Zhan S and Yu.26,27 The results were visualized by R (version 3.6.1) software with ggplot 2 package.27
Validation of Differentially Expressed lncRNAs by RT−qPCR
In order to verify the accuracy of sequencing data, RT−qPCR was used to analyze DEGs. Twelve DEGs, namely, 6up, 7up, 12up, 15up, 16up, 17up, 19up, 20up, Hub1, 3D, 4D and 5D (Table 1) were randomly selected for RT-qPCR validation. The total RNA 20 ng was used to carry out reverse transcription and RT-qPCR reactions. Some differentially expressed lncRNA genes were randomly selected, and their primers (Table 1) were designed using Primer Express software. Ubiquitin C-terminal Hydrolase L5 (UCHL5) gene was used as a reference gene.
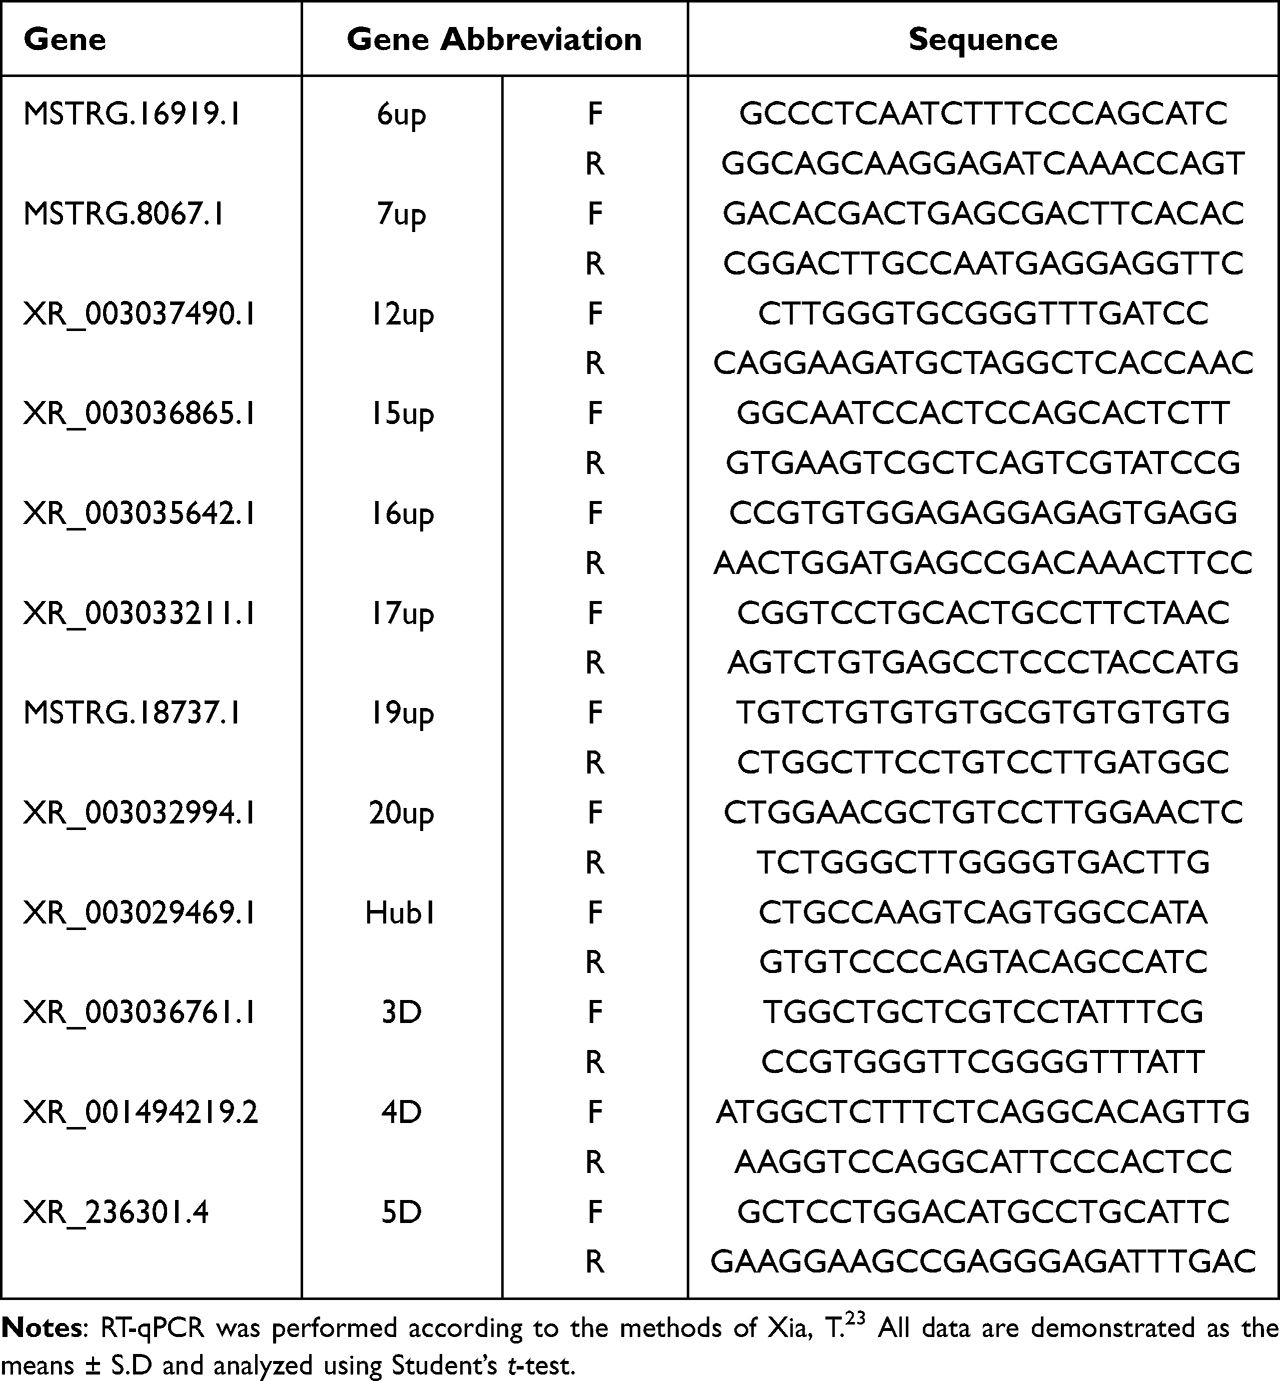 |
Table 1 The Primer Sequences of RT-qPCR |
Results
States of MDBK Cells by BoHV-1 Infection at Different Points in Time
To understand the morphology of MDBK cells which infected by BoHV-1 virus, the morphology of MDBK cells was observed as uninfected and then, post-infection at 18, 24, and 33 h (Figure 1). In the uninfected group, the edges of MDBK cells were evident, and there was no cell disruption and necrosis present (Figure 1a). At 24 h post-infection, the cell boundary became blurred, appeared necrotic and plaques appeared (Figure 1c) and at 33 h post-infection, the plaques became bigger and cell necrosis was severe (Figure 1d).
 |
Figure 1 States of MDBK cells by BoHV-1 infection at different points in time. (a) MDBK cells uninfected with BoHV-1 were used as a negative control; (b) MDBK cells post-infection 18 h, characterized by focal rounding; (c) MDBK cells post-infection 24 h, detachment of cells from the surface of the cell-culture dish; (d) MDBK cells post-infection 33 h, aggregation of the cells into vacuoles. All cell morphology under the light microscope in multiple rate 100-fold. Arrows indicate the state of cytopathic effects (CPE). |
Identification of Differentially Expressed mRNAs, miRNAs, and lncRNAs
We conducted differential expression analysis for each two groups, aiming to observe the differential expression of lncRNA, micRNA and mRNA at different periods. Analysis of differential expression transcripts showed that 984 lncRNAs, 4584 mRNAs, and 374 miRNAs were differentially expressed in this experiment (Figure 2). Moreover, the number of differentially expressed RNAs in the 33-hour group was higher than that in any other group, indicating that the number of differentially expressed RNAs increased with the time of virus infection. These changed RNAs may be involved in virus–host interactions. lncRNAs, mRNAs, and miRNAs with significantly different expression levels in this study were selected from their expression plot on heat maps (Figure 3). From the plot, 68 lncRNAs (46 up-regulated and 22 down-regulated), 162 mRNAs (89 up-regulated and 73 down-regulated) and 43 miRNAs (26 up-regulated and 17 down-regulated) were found. These lncRNAs, mRNAs and miRNAs were continuously up-regulated or down-regulated and conducted for follow-up analysis. The horizontal coordinate indicates that samples clustered into one class are more similar, and the vertical coordinate indicates clusters of different RNAs that have the same or similar functions.
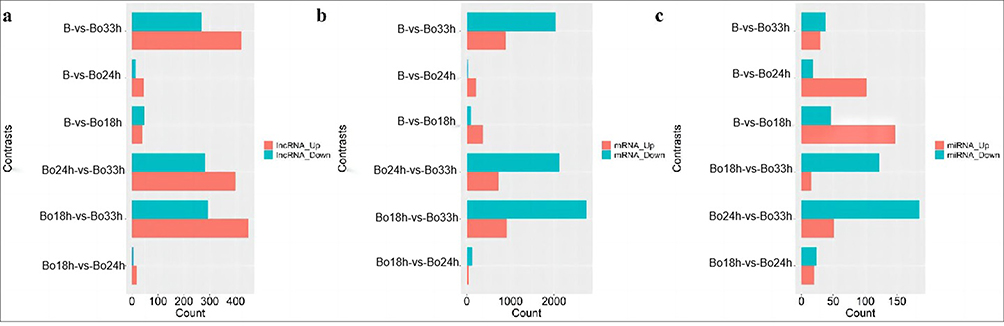 |
Figure 2 Differential expression analysis of lncRNA, mRNA and miRNA in every two groups The horizontal coordinate is the number of differentially expressed genes, The ordinates represent different groups. Red represents up-regulated genes and blue represents down-regulated genes. The differential expression analysis in two groups was taken by method as follow: lncRNA (a) and mRNA (b) with a fold change ≥ 2 and a false discovery rate (FDR) < 0.05 were chosen, and miRNA (c) with a fold change ≥ 2 and p < 0.05, and visualized by R software with ggplot2 package. B: MDBK cells uninfected with BoHV-1 were used as a negative control; Bo18h:MDBK cells post-infection 18 h; Bo24h:MDBK cells post-infection 24 h; Bo33h:MDBK cells post-infection 33 h. |
 |
Figure 3 Heat map analysis of differential expression of lncRNA, mRNA and miRNA for each sample The differential expression heat map in every sample was visualized by R software with a pheatmap package. (a) Heat map of differentially expressed lncRNAs; (b) Heat map of differentially expressed mRNAs; (c) Heat map of differentially expressed miRNAs. Each column represents one sample, and Each row represents a gene. The color legend is on the top-right of the figure, and compound relative abundances were standardized prior to unsupervised hierarchical clustering of samples (rows). Red indicates the expression of genes is up-regulated. Blue indicates the expression of genes is down-regulated. The darker the color, the more up-regulated the gene expression. The color legend named group indicates the sample group. |
Construction and Visualization of mRNA-lncRNA-miRNA Networks
All co-expressed competing triples identified based on ceRNA theory were used to construct the mRNA-lncRNA-miRNA network and visualized using Cytoscape software (version 3.6.0). In this study, up-regulated lncRNAs and down-regulated miRNAs and up-regulated mRNA were integrated into the ceRNA network, down-regulated lncRNAs and up-regulated miRNAs and down-regulated mRNA were integrated into the ceRNA network. In up-regulated lncRNAs network (Figure 4a), 46 lncRNA nodes, 89 mRNA nodes, 26 miRNA nodes, and 500 edges were present in this mRNA-lncRNA-miRNA network. In down-regulated lncRNAs network (Figure 5a), 22 lncRNAs, 73 mRNAs, 17 miRNAs, and 255 edges were present in this mRNA-lncRNA-miRNA network. After the network analyzer calculation, the centrality indices of “betweenness centrality” (BC) and “closeness centrality” (CC) were used to determine the importance of individual node with basic functions in complex networks. Through the network analysis, significant differences (p < 0.05) were found in BC and CC among lncRNAs, mRNAs and miRNAs (Figures 4b, c and 5b, c), which showed that lncRNA played a very important roles in mRNA-lncRNA-miRNA networks.
 |
Figure 4 Network of up-regulated lncRNAs with down-regulated miRNAs and the up-regulated mRNAs. (a) The mRNA-lncRNA-miRNA network in upregulated lncRNAs. Every node represents one gene, and Each line represents an interaction between two genes. The red triangle is used to represent lncRNAs, the green circle is used to represent miRNAs and the purple square is used to represent mRNAs. The higher the correlation, the larger the size. (b) The difference of betweenness centrality among lncRNAs, miRNAs, and mRNAs. In this network, betweenness centrality of the lncRNA nodes was higher than that of miRNA and mRNA nodes. (c) The difference of closeness centrality among lncRNAs, miRNAs, and mRNAs. In this network, the closeness centrality of lncRNA nodes was higher than that of miRNA and mRNA nodes. |
 |
Figure 5 Network of down-regulated lncRNAs with up-regulated miRNAs and down-regulated mRNA. (a) The mRNA-lncRNA-miRNA network in downregulated lncRNAs. Every node represents one gene, and Each line represents an interaction between two genes. The red triangle is used to represent lncRNAs, the green circle is used to represent miRNAs and the purple square is used to represent mRNAs. The higher the correlation, the larger the size. (b) The difference of betweenness centrality among lncRNAs, miRNAs, and mRNAs. In this network, betweenness centrality of the lncRNA nodes was higher than that of miRNA and mRNA nodes. (c) The difference of closeness centrality among lncRNAs, miRNAs, and mRNAs. In this network, the closeness centrality of lncRNA nodes was higher than that of miRNA and mRNA nodes. |
Functional Enrichment Analysis of lncRNA-mRNA-miRNA Networks
To assess functional enrichment, GO and KEGG pathway analyses were performed by using DEGs in the ceRNA network. The top 20 significant GO terms of every group were taken and shown in Figure 6A and b. On the molecular function level, these genes were mostly enriched in enzyme binding, zinc ion binding, transporter activity, transmembrane transporter activity, substrate-specific channel activity, passive transmembrane transporter activity, channel activity and inorganic molecular entity in up-regulated group (Figure 6a). In down-regulated group, these genes were mostly enriched in DNA binding, nuclease activity, catalytic activity, acting on DNA and hydrolase activity, and acting on ester bonds (Figure 6b). The top 20 significant KEGG pathways of DEGs were taken to visualize by ggplot 2 package (Figure 7a and b). These DEGs were mostly enriched in proteoglycans in cancer, MAPK signaling pathway, cytokine-cytokine receptor interaction and viral carcinogenesis in up-regulated group (Figure 7a). In down-regulated group, the DEGs were mostly enriched in Herpes simplex virus 1 infection, microRNAs in cancer, TGF-beta signaling pathway and Thyroid hormone signaling pathway (Figure 7b).
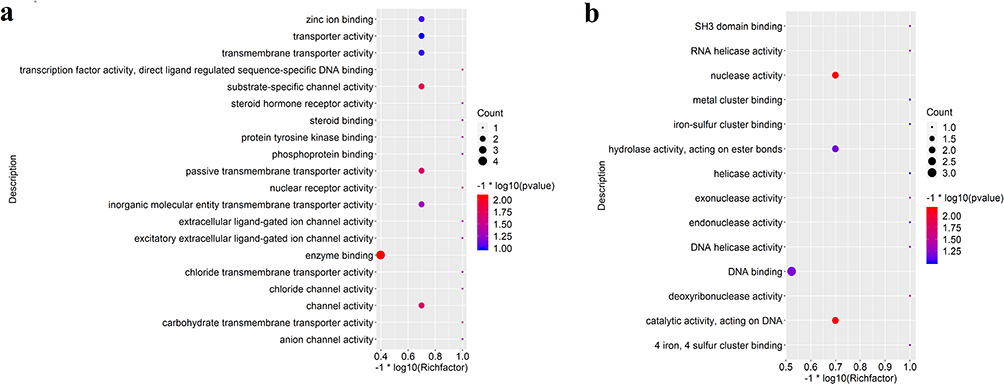 |
Figure 6 Gene ontology (GO) enrichment analysis of lncRNA-mRNA-miRNA networks. (a) Top 20 significant GO terms on the molecular function level in up-regulated group; (b) top 20 significant GO terms on the molecular function level in down-regulated group; The count and q value were used to measure the size and color of bubbles, indicating the amount and significance of DEGs enriched in these terms. |
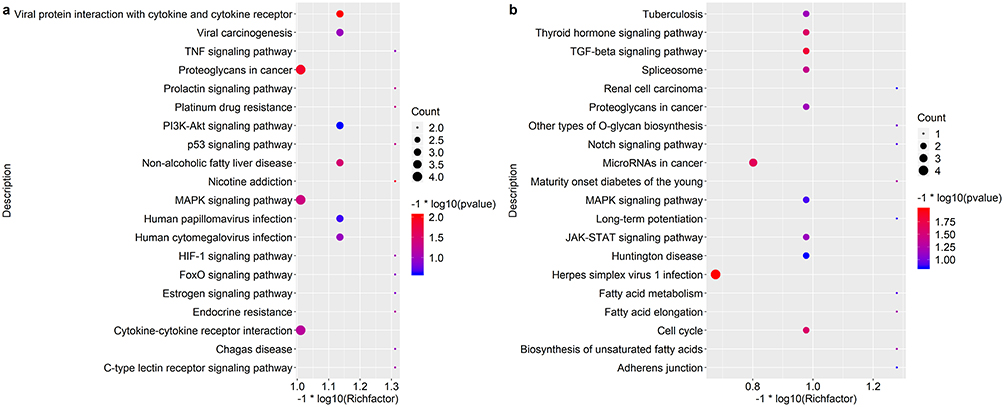 |
Figure 7 Kyoto Encyclopedia of Genes and Genome (KEGG) enrichment analysis of lncRNA-mRNA-miRNA networks. lncRNA-mRNA-miRNA networks. (a) Top 20 significant KEGG pathways in up-regulated group. (b) Top 20 significant KEGG pathways in down-regulated group. The count and q value were used to measure the size and color of bubbles, indicating the amount and significance of DEGs enriched in these terms. |
RT-qPCR Analysis
To verify the accuracy and reproducibility of transcriptome sequencing data, twelve differential expression genes (6up, 7up, 12up, 15up, 16up, 17up, 19up, 20up, Hub1, 3D, 4D and 5D) were randomly selected for RT-qPCR analysis (Figure 8a and b). The results were consistent with the transcriptome sequencing data, suggesting transcriptome sequencing were reliable. The correlation of RNA-seq and RT-qPCR was measured. As shown in Figure 9, the results of RT-qPCR showed a high correlation with RNA-seq, and the correlation coefficient (R2) was as high as 0.8274. These results indicated that most of the identified lncRNAs was truly expressed in BoHV-1 infected MDBK cells.
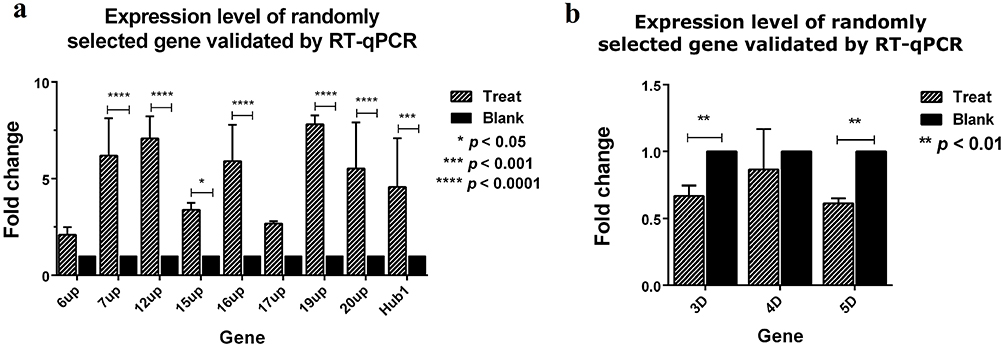 |
Figure 8 Expression level of randomly selected gene validated by RT-qPCR. The relative expression of 12 randomly selected lncRNA genes which were up-regulated (a) and down-regulated in RNA-seq (b) was performed by RT-qPCR. UCHL5 gene was used as internal control, and the comparative 2-ΔΔCt method was used to calculate the relative expression of each gene (fold change). The relative expression values shown are the same as the mean SD values. ⁎p < 0.05, ⁎⁎p < 0.01, ⁎⁎⁎p < 0.001 and ⁎⁎⁎⁎p < 0.0001 using by Student’s t-test to evaluate differences between every two groups. Treat: BHV-1 infected MDBK cells for 33 hours; Blank: MDBK cells not infected by the virus. |
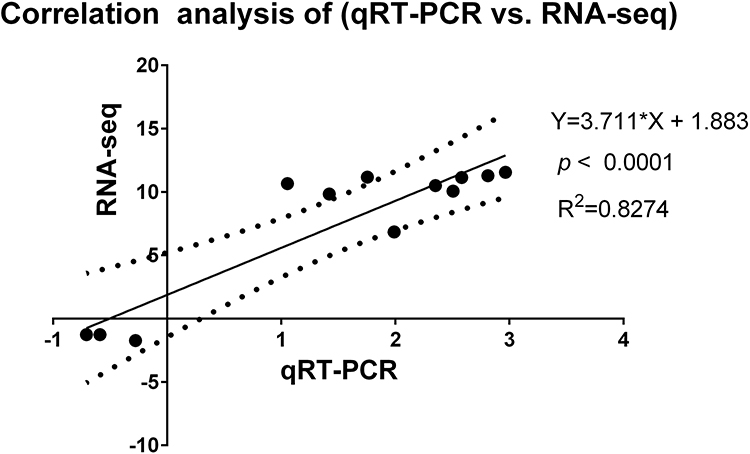 |
Figure 9 Correlation analysis of qRT-PCR vs RNA-seq. The correlation of log2 (fold change) between RT-qPCR and RNA-Seq data was analyzed by GraphPad software 6.0 (San Diego, CA), The abscissa represents the RT-qPCR data, the ordinate represents RNA-Seq data. The correlation coefficient (R2) was as high as 0.8274. |
Discussion
Bovine herpesvirus type 1 (BoHV-1) is a member of the subfamily α-herpesvirinae and a virulent pathogen causing significant economic losses to the worldwide cattle industry,28,29 but knowledge about the molecular mechanism of RNA in BoHV-1 infection such as the expression level of mRNAs in immune pathway, non-coding RNAs expression stats are still unclear. The use of RNA-Seq analysis is becoming one of the main techniques for transcript analyses. Recently, RNA-Seq has been mostly used in some virus infection studies,30–32 such as bluetongue virus (BTV), peste des petits ruminants virus (PPRV) and bovine viral diarrhea virus (BVDV), but there were fewer reports about the changes of RNA level after the infection of BoHV-1. More in-depth studies of the interaction between BoHV-1 and the host will be of great significance for elucidating the pathogenesis and the progression of persistent BoHV-1 infection. In this study, MDBK cells were infected with BoHV-1 for 18, 24, 33 hours and sequenced by next-generation sequencing. The reason for choosing these time points was to look at the expression of lncRNAs in the early, middle, and late stages of viral infection. After the virus infects MDBK cells, it generally shows complete cytopathic effect within 48 hours, accompanied by mass cell death and shedding. In order to prevent RNA degradation due to excessive cell death, we chose 33 hours when cytopathic effects had already occurred but were not severe. The ceRNA hypothesis has been recently suggested as a novel layer of gene regulation. The mRNA-miRNA-lncRNA network was constructed by using raw-data, which had been sequenced and the lncRNAs, miRNAs and mRNAs in this network were analyzed to reveal the key genes related to BoHV-1 infection. By constructing mRNA-miRNA-lncRNA networks, this study found that lncRNA XR_003029469.1 had a higher degree in up-regulated lncRNAs network and bound four miRNAs including bta-miR-23b-5p, bta-miR-30b-3p, miR-12032-x, and miR-25-x. Sequencing results showed that MSTRG.8067.1 was a novel lncRNA whose function was unknown. Through mRNA-miRNA-lncRNA network construction, it was found that it formed a network with bta-miR-10174-5p, XM_005222015.4 and NM_001037628.2. This indicated that the function of MSTRG.8067.1 was related to bta-miR-10174-5p, XM_005222015.4 and NM_001037628.2. In down-regulated lncRNAs network, lncRNA XR_003036761.1 had a higher degree and bound three miRNAs, including miR-2370-y, miR-30-x and bta-miR-12059. In turn, miR-30-x bound to NM_001076487. This indicated that the function of lncRNA XR_003036761.1 might be exerted by the miR-30-x targeting mRNA NM_001076487.
In ceRNA networks, nodes with high connectivity often have important biological significance, and these genes are called hub genes.33,34 In most studies,35–37 hub genes were focused on some cancers and diseases such as prostate cancer, large B-Cell lymphoma and non-small cell lung cancer. However, hub genes predicted based on bioinformatics technology may be caused by errors in algorithms or association networks and the function of these genes is not clear and requires further research.
To assess functional enrichment, GO and KEGG pathway analyses were performed by using DEGs in the ceRNA networks. This study’s results indicated that the DEGs were mainly enriched in enzyme binding, substrate-specific channel activity, DNA binding and nuclease activity on the molecular function level. The studies38 have shown that the BoHV-1 genome is GC-rich, with SP1 consensus binding sites and other GC-rich Moines, which may promote binding to specific KLF transcription factors and stimulate viral transcription early in latency reactivation.4 In the KEGG pathway, these DEGs were mostly enriched in the proteoglycans in cancer, cytokine-cytokine receptor interaction and viral carcinogenesis, mitogen-activated protein kinase and calcium signaling pathway. MAPK signaling pathways play an important role in pathogen–host interaction, some viruses such as Epstein-Barr virus (EBV) and herpes simplex virus (HSV) affect host cell survival or cell cycle or viral replication or alter immune responses by MAPK-ERK cascade.39 Some studies40–42 reported that virus infection with hepatitis C virus (HCV), human immunodeficiency virus (HIV) and pseudorabies virus (PRV) can activate the calcium signaling and MAPK signaling pathways. Especially for Pseudorabies virus (PRV), an alpha herpesvirus which can enter the mammalian nervous system in a similar way to BoHV-1, but whether the molecular mechanism of the BoHV-1 infection is the same as that of Pseudorabies virus (PRV) needs further study.
In summary, this study revealed that BoHV-1 infection can affect the expression of RNA in MDBK cells and the regulation of ceRNA network to carry out corresponding biological functions in the host, but further experimental studies are still necessary to prove the hub genes function in ceRNA network and the molecular mechanism in BoHV-1 infection.
Author Contributions
Baifen Song: Funding acquisition, Project administration, Writing-original draft; Yanmei Huang: Formal analysis, Methodology, Software; Jinzhu Ma, Yongzhong Yu, Liquan Yu: Data curation, Writing-review & editing; Chen Peng: Methodology, Resources; Wenxue Wu: Supervision, Project administration. All authors made a significant contribution to the work reported, whether that is in the conception, study design, execution, acquisition of data, analysis and interpretation, or in all these areas; took part in drafting, revising or critically reviewing the article; gave final approval of the version to be published; have agreed on the journal to which the article has been submitted; and agree to be accountable for all aspects of the work.
Funding
This research was funded by the National Natural Science Foundation of China (NSFC), grant 32272991.
Disclosure
The authors declare that they have no competing interest in this work.
References
1. Jones C. Bovine herpesvirus 1 counteracts immune responses and immune-surveillance to enhance pathogenesis and virus transmission. Front Immunol. 2019;10:1008. doi:10.3389/fimmu.2019.01008
2. Queiroz-Castro VLD, da Costa EP, Alves SVP, et al. Bovine herpesvirus 1 can cross the intact zona pellucida of bovine oocytes after artificial infection. PLoS One. 2019;14(7):e0218963. doi:10.1371/journal.pone.0218963
3. Osman RA, Griebel PJ. CD335 (NKp46)+ T-Cell Recruitment to the Bovine Upper Respiratory Tract during a Primary Bovine Herpesvirus-1 Infection. Front Immunol. 2017;8:1393. doi:10.3389/fimmu.2017.01393
4. Pokhriyal M, Ratta B, Yadav BS, et al. Three newly identified Immediate Early Genes of Bovine herpesvirus 1 lack the characteristic Octamer binding motif-1. Sci Rep. 2018;8(1):11441. doi:10.1038/s41598-018-29490-8
5. Tang L, Chen HY, Hao NB, et al. microRNA inhibitors: natural and artificial sequestration of microRNA. Cancer Lett. 2017;139–147. doi:10.1016/j.canlet.2017.05.025
6. Salmena L, Poliseno L, Tay Y, Kats L, Pandolfi PP. A ceRNA hypothesis: the Rosetta Stone of a hidden RNA language? Cell. 2011;146(3):353–358. doi:10.1016/j.cell.2011.07.014
7. Ye W, Lv Q, Wong CK, et al. The effect of central loops in miRNA:MRE duplexes on the efficiency of miRNA-mediated gene regulation. PLoS One. 2008;3(3):e1719. doi:10.1371/journal.pone.0001719
8. Zhao K, Ye Z, Li Y, et al. LncRNA FTX Contributes to the Progression of Colorectal Cancer Through Regulating miR-192-5p/EIF5A2 Axis. Onco Targets Ther. 2020;13:2677–2688. doi:10.2147/OTT.S241011
9. Lu B, Zhu Y, Wu J, et al. LncRNA34977 promotes the proliferation, migration, and invasion and inhibits the apoptosis of canine mammary tumors by regulating the expression of miR-8881/ELAVL4. Funct Integr Genomics. 2023;23(1):31. doi:10.1007/s10142-022-00955-4
10. Luo Y, Wang Q, Teng L, et al. LncRNA DANCR promotes proliferation and metastasis in pancreatic cancer by regulating miRNA-33b. FEBS Open Bio. 2020;10(1):18–27. doi:10.1002/2211-5463.12732
11. Ghosal S, Das S, Sen R, Chakrabarti J. HumanViCe: host ceRNA network in virus infected cells in human. Front Genet. 2014;5:249. doi:10.3389/fgene.2014.00249
12. Rahmani-Kukia N, Abbasi A. New insights on circular RNAs and their potential applications as biomarkers, therapeutic agents, and preventive vaccines in viral infections: with a glance at SARS-CoV-2. Mol Ther Nucleic Acids. 2022;29:705–717. doi:10.1016/j.omtn.2022.08.012
13. Park HJ, Ji P, Kim S, et al. 3’ UTR shortening represses tumor-suppressor genes in trans by disrupting ceRNA crosstalk. Nat Genet. 2018;50(6):783–789. doi:10.1038/s41588-018-0118-8
14. Bai Y, Huang Y, Li Y, et al. The Murine Reg3a Stimulated by Lactobacillus casei Promotes Intestinal Cell Proliferation and Inhibits the Multiplication of Porcine Diarrhea Causative Agent in vitro. Front Microbiol. 2021;12:675263. doi:10.3389/fmicb.2021.675263
15. Chen S, Zhou Y, Chen Y, Gu J. fastp: an ultra-fast all-in-one FASTQ preprocessor. Bioinformatics. 2018;34(17):i884–i890. doi:10.1093/bioinformatics/bty560
16. Langmead B, Salzberg SL. Fast gapped-read alignment with Bowtie 2. Nat Methods. 2012;9(4):357–359. doi:10.1038/nmeth.1923
17. Kim D, Langmead B, Salzberg SL. HISAT: a fast spliced aligner with low 360 memory requirements. Nat Methods. 2015;12(4):357–360. doi:10.1038/nmeth.3317
18. Pertea M, Pertea GM, Antonescu CM, Chang TC, Mendell JT, Salzberg SL. StringTie enables improved reconstruction of a transcriptome from RNA-seq reads. Nat Biotechnol. 2015;33(3):290–295. doi:10.1038/nbt.3122.
19. Pertea M, Kim D, Pertea GM, Leek JT, Salzberg SL. Transcript-level expression analysis of RNA-seq experiments with HISAT, StringTie and Ballgown. Nat Protoc. 2016;11(9):1650–1667. doi:10.1038/nprot.2016.095
20. Lai Y. Differential expression analysis of Digital Gene Expression data: RNA-tag filtering, comparison of t-type tests and their genome-wide co-expression based adjustments. Int J Bioinform Res Appl. 2010;6(4):353–365. doi:10.1504/IJBRA.2010.035999
21. Fiorito F, Iovane V, Marullo A, Costagliola A, Granato GE, De Martino L. 2,3,7,8-Tetrachlorodibenzo-p-dioxin influences bovine herpesvirus 1 replication through upregulation of SIRT3 and cytoskeletal reorganization. Vet Res Commun. 2017;41(4):299–306. doi:10.1007/s11259-017-9701-1
22. Wu Y, Zhang L, Zhang Y, Zhen Y, Liu S. Bioinformatics analysis to screen for critical genes between survived and non- survived patients with sepsis. Mol Med Rep. 2018;18(4):3737–3743. doi:10.3892/mmr.2018.9408
23. Shannon P, Markiel A, Ozier O, et al. Cytoscape: a software environment for integrated models of biomolecular interaction networks. Genome Res. 2003;13(11):2498–2504. doi:10.1101/gr.1239303
24. Tian L, Hu X, He Y, Wu Z, Li D, Zhang H. Construction of lncRNA-miRNA-mRNA networks reveals functional lncRNAs in abdominal aortic aneurysm. Exp Ther Med. 2018;16(5):3978–3986. doi:10.3892/etm.2018.6690
25. Assenov Y, Ramírez F, Schelhorn SE, Lengauer T, Albrecht M. Computing topological parameters of biological networks. Bioinformatics. 2008;24(2):282–284. doi:10.1093/bioinformatics/btm554
26. Zhan S, Dong Y, Zhao W, et al. Genome-wide identification and characterization of long non-coding RNAs in developmental skeletal muscle of fetal goat. BMC Genomics. 2016;17(1):666. doi:10.1186/s12864-016-3009-3
27. Yu G, Wang LG, Han Y, He QY. clusterProfiler: an R package for comparing biological themes among gene clusters. OMICS. 2012;16(5):284–287. doi:10.1089/omi.2011.0118
28. Miller JM. Experimentally induced infectious bovine rhinotracheitis virus infection during early pregnancy: effect on the bovine corpus luteum and conceptus. Am J Vet Res. 1986;47(2):223–228.
29. Roels S, Charlier G, Letellier C, et al. Natural case of bovine herpesvirus 1 meningoencephalitis in an adult cow. Vet Rec. 2000;146(20):586–588. doi:10.1136/vr.146.20.586
30. Singh A, Prasad M, Mishra B, et al. Transcriptome analysis reveals common differential and global gene expression profiles in bluetongue virus serotype 16 (BTV-16) infected peripheral blood mononuclear cells (PBMCs) in sheep and goats. Genom Data. 2016;11:62–72. doi:10.1016/j.gdata.2016.12.001
31. Manjunath S, Kumar GR, Mishra BP, et al. Genomic analysis of host - Peste des petits ruminants vaccine viral transcriptome uncovers transcription factors modulating immune regulatory pathways. Vet Res. 2015;46:15. doi:10.1186/s13567-015-0153-8
32. Li W, Mao L, Shu X, et al. Transcriptome analysis reveals differential immune related genes expression in bovine viral diarrhea virus-2 infected goat peripheral blood mononuclear cells (PBMCs). BMC Genomics. 2019;20(1):516. doi:10.1186/s12864-019-5830-y
33. Qi X, Zhang DH, Wu N, Xiao JH, Wang X, Ma W. ceRNA in cancer: possible functions and clinical implications. J Med Genet. 2015;52(10):710–718. doi:10.1136/jmedgenet-2015-103334
34. Huang J, Li Y, Lu Z, et al. Analysis of functional hub genes identifies CDC45 as an oncogene in non-small cell lung cancer - a short report. Cell Oncol. 2019;42(4):571–578. doi:10.1007/s13402-019-00438-y
35. Song ZY, Chao F, Zhuo Z, Ma Z, Li W, Chen G. Identification of hub genes in prostate cancer using robust rank aggregation and weighted gene co-expression network analysis. Aging. 2019;11(13):4736–4756. doi:10.18632/aging.102087
36. Cao H, Zhang L, Chen H, et al. Hub genes and gene functions associated with postmenopausal osteoporosis predicted by an integrated method. Exp Ther Med. 2019;17(2):1262–1267. doi:10.3892/etm.2018.7095
37. Liu Z, Meng J, Li X, et al. Identification of Hub Genes and Key Pathways Associated with Two Subtypes of Diffuse Large B-Cell Lymphoma Based on Gene Expression Profiling via Integrated Bioinformatics. Biomed Res Int. 2018;2018:3574534. doi:10.1155/2018/3574534
38. Kaczynski J, Cook T, Urrutia R. Sp1- and Krüppel-like transcription factors. Genome Biol. 2003;4(2):206. doi:10.1186/gb-2003-4-2-206
39. DuShane JK, Maginnis MS. Human DNA Virus Exploitation of the MAPK-ERK Cascade. Int J Mol Sci. 2019;20(14):3427. doi:10.3390/ijms20143427
40. Negash AA, Olson RM, Griffin S, Gale M. Modulation of calcium signaling pathway by hepatitis C virus core protein stimulates NLRP3 inflammasome activation. PLoS Pathog. 2019;15(2):e1007593. doi:10.1371/journal.ppat.1007593
41. Planès R, Serrero M, Leghmari K, BenMohamed L, Bahraoui E. HIV-1 Envelope Glycoproteins Induce the Production of TNF-α and IL-10 in Human Monocytes by Activating Calcium Pathway. Sci Rep. 2018;8(1):17215. doi:10.1038/s41598-018-35478-1
42. Li Y, Zheng G, Zhang Y, et al. MicroRNA analysis in mouse neuro-2a cells after pseudorabies virus infection. J Neurovirol. 2017;23(3):430–440. doi:10.1007/s13365-016-0511-y
 © 2023 The Author(s). This work is published and licensed by Dove Medical Press Limited. The
full terms of this license are available at https://www.dovepress.com/terms
and incorporate the Creative Commons Attribution
- Non Commercial (unported, 3.0) License.
By accessing the work you hereby accept the Terms. Non-commercial uses of the work are permitted
without any further permission from Dove Medical Press Limited, provided the work is properly
attributed. For permission for commercial use of this work, please see paragraphs 4.2 and 5 of our Terms.
© 2023 The Author(s). This work is published and licensed by Dove Medical Press Limited. The
full terms of this license are available at https://www.dovepress.com/terms
and incorporate the Creative Commons Attribution
- Non Commercial (unported, 3.0) License.
By accessing the work you hereby accept the Terms. Non-commercial uses of the work are permitted
without any further permission from Dove Medical Press Limited, provided the work is properly
attributed. For permission for commercial use of this work, please see paragraphs 4.2 and 5 of our Terms.
Recommended articles
AC024896.1/miR-363-3p Axis Regulates the Malignant Progression of Acute Myeloid Leukemia by Cuproptosis-Related Gene MYO1B
Zhang J, Zheng Y, Liu H, Liu B
Blood and Lymphatic Cancer: Targets and Therapy 2024, 14:17-30
Published Date: 24 March 2024
Identification of Pivotal ceRNA Networks Associated with Stanford-A Aortic Dissection via Integrated Bioinformatics Analysis
Hu Y, Liu Z, Qin Y, Wu N, Yang T, Cheng X, Wang C, Wang X
International Journal of General Medicine 2025, 18:1509-1527
Published Date: 17 March 2025