Back to Journals » International Journal of General Medicine » Volume 15
Constructing a Prognostic Gene Signature for Lung Adenocarcinoma Based on Weighted Gene Co-Expression Network Analysis and Single-Cell Analysis
Received 17 December 2021
Accepted for publication 27 May 2022
Published 3 June 2022 Volume 2022:15 Pages 5441—5454
DOI https://doi.org/10.2147/IJGM.S353848
Checked for plagiarism Yes
Review by Single anonymous peer review
Peer reviewer comments 3
Editor who approved publication: Dr Scott Fraser
Biqian Fu,* Lin Lu,* Haifu Huang
Internal Medicine-Oncology, Shenzhen Hospital of Guangzhou University of Traditional Chinese Medicine, Shenzhen, People’s Republic of China
*These authors contributed equally to this work
Correspondence: Haifu Huang, Internal Medicine-Oncology, Shenzhen Hospital of Guangzhou University of traditional Chinese Medicine, 6001 North Ring Road, Futian District, Shenzhen, 440300, People’s Republic of China, Tel +0755-83548611, Email [email protected]
Purpose: Lung adenocarcinoma (LUAD) has a high degree of intratumor heterogeneity. Advanced single-cell RNA sequencing (scRNA-seq) technologies have offered tools to analyze intratumor heterogeneity, which improves the accuracy of identifying biomarkers based on single-cell expression data, and thus helps in predicting prognosis of cancer patients and assisting decision-makings for cancer treatment.
Patients and Methods: ScRNA-seq data containing two LUAD and two para-cancerous tissue samples were included to identify different cell clusters in tumor tissues. To identify the most relevant modules and important cell subpopulations (clusters) in LUAD tissues, weighted gene co-expression network analysis (WGCNA) was performed. Subsequently, LUAD molecular subtypes were constructed by unsupervised consensus clustering based on genes in key modules. Using differential analysis, univariate Cox regression analysis, and least absolute shrinkage and selection operator (LASSO) regression analysis, a prognostic model of LUAD was established.
Results: A total of 14 cell clusters belonging to 10 cell types in LUAD were identified. The turquoise module was the most relevant to LUAD among all the modules; cluster 10 (C10, lung epithelial cells) was found to be the most strongly associated with the turquoise module. LUAD samples were divided into two groups of distinct molecular subtypes. Based on the 165 shared genes between the turquoise module and C10, 511 DEGs between the two molecular subtypes were obtained, and five of them were selected to construct the gene signature, which was validated to be an independent prognostic marker of LUAD.
Conclusion: Fourteen cell clusters co-existed in LUAD, which contributed to its intratumor heterogeneity. Two molecular subtypes of LUAD were identified and a five-gene signature was developed and validated to be significantly associated with prognostic and clinical characteristics of LUAD patients.
Keywords: single-cell RNA sequencing, lung adenocarcinoma, intratumor heterogeneity, molecular subtypes, prognosis, five-gene signature
Introduction
Lung cancer, accounting for 18% of all cancer deaths, is the leading cause of cancer-related mortalities.1 The major histological subtypes of malignant lung cancer include adenocarcinoma, adenosquamous carcinoma, squamous cell carcinoma, large cell carcinoma, neuroendocrine tumors, and sarcomatoid carcinoma.2 Lung adenocarcinoma (LUAD) alone accounts for 40% of all lung cancer cases and exhibits considerable heterogeneity in terms of patient characteristics, clinical course, histological appearance, and molecular changes.3 Despite the recent achievements in understanding the pathogenesis of LUAD and developments in new therapeutic approaches, addressing intratumor heterogeneity poses a major challenge to the clinical treatment of LUAD.
Single-cell multi-omics has been widely used in cancer research and has made a significant contribution to the deeper understanding of tumor heterogeneity. Currently available single-cell multi-omic technologies include single-cell RNA sequencing (scRNA-seq), single-cell DNA sequencing, single-cell proteomics, and single-cell epigenomics.4 Cellular typing of tumor tissue and analysis of malignant cell characteristics in combination with the tumor microenvironment and genetic factors are some applications of scRNA-seq relevant to the study of tumor heterogeneity.5 For example, scRNA-seq analysis of triple-negative breast cancer shows subclonal heterogeneity and reports an aggressive state of this disease.6 Transcriptomic profiling of a total of 57,530 cells obtained from 24 primary pancreatic ductal adenocarcinomas (PDAC) and 11 control pancreatic tissues characterizes the high heterogeneity in PDAC tumors, consisting of multiple malignant and stromal cell types.7 Deep scRNA-seq analysis of 5063 single T-cells in total, isolated from the tumor, and adjacent normal tissues and the peripheral blood, from patients with hepatocellular carcinoma, reports the presence of 11 T-cell clusters.8 ScRNA-seq analysis of metastatic renal cell carcinoma samples shows the coexistence of multiple tumor cell clusters in the tissues, each exhibiting a different signaling pathway dysregulation and drug response sensitivity.9 Taken together, these previous studies suggest that scRNA-seq holds promising prospects for the development of personalized treatment for LUAD.
Weighted gene co-expression network analysis (WGCNA) is widely used for constructing a free-scale co-expression network and screening key gene modules in cancer data analysis. A number of previous studies have identified various gene signatures based on WGCNA. For example, Yi et al applied WGCNA to identify 11 hub genes associated with LUAD prognosis.10 Xie et al identified 10 hub genes based on WGCNA and protein–protein interaction (PPI) analysis for LUAD.11 In this study, we attempted to combine the analysis of scRNA-seq data and gene expression profiles to identify key prognostic genes associated with LUAD overall survival. In addition to WGCNA, we performed a series of bioinformatics analyses using different methodologies for constructing a gene signature for LUAD patients. The prognostic gene signature was verified to show a robust performance in three independent cohorts.
Materials and Methods
Downloading and Processing of Data from Public Datasets
The Gene Expression Omnibus (GEO) database (https://www.ncbi.nlm.nih.gov/geo) was used to extract the scRNA-seq data from the GSE149655 cohort of LUAD patients; it consisted of two tumor and two corresponding para cancerous samples. Sample information for the two LUAD-RNA-seq datasets was also obtained from the GEO database, accession numbers GSE31210 and GSE30219, consisting of 21,655 genes from 226 tumor samples and 21,655 genes from 289 tumor samples, respectively. The fragments per kilobase million (FPKM) data of the LUAD samples (513-tumor and 59-para cancerous samples) obtained from TCGA were transformed into transcripts per million (TPM) format. Finally, 472 tumor samples with complete clinical phenotypic data were acquired.
Quality Control and Cell-Type Identification
The Seurat kit (version: 3.1) (http://satijalab.org/seurat/) was used for filtration and quality control.12 This algorithm enabled us to identify and interpret the sources of heterogeneity in the single-cell transcriptome sequencing data and perform subgroup analysis by integrating different single-cell data types, identifying marker genes, and further processing of data.13 Cells with <500 and >10,000 genes, and >30% of the mitochondrial genes were excluded. All functions were run with default parameters unless stated otherwise. The MergeSeurat function was used to merge the tumor and para-cancerous samples and normalize using the log-normalization operation. Subsequently, the genes showing highly variable expression in single cells were identified using the FindVariableFeatures function. Principal component analysis (PCA) was performed for all the genes and the top 50 among them were input into the uniform manifold approximation and projection (UMAP) algorithm. Cell clustering was performed using the FindNeighbors and FindClusters functions in Seurat with the resolution set at 0.1 and the FindAllMarkers function was used to identify signature genes in cell clusters. Finally, based on the enricher function of the clusterProfiler package (version: 3.14.0) (www.bioconductor.org/packages/release/bioc/html/clusterProfiler),14 we annotated the cell types using the marker genes.
Construction of Weighted Gene Co-Expression Network
In TCGA-LUAD dataset, the Limma package (http://www.bioconductor.org/packages/release/bioc/html/limma) was applied to perform differential expression analysis between 513 LUAD samples and 59 para cancerous samples for screening differentially expressed genes (DEGs) under the conditions of false discovery rate (FDR) <0.05. The construction of co-expression networks was based on the DEGs using the “WGCNA” package (https://cran.r-project.org/web/packages/WGCNA) in R.15 Subsequently, we constructed a sample clustering dendrogram based on the “hcluster” function. The pickSoftThreshold algorithm was used to construct the topological overlap matrix (TOM) and a suitable soft threshold was selected. A dynamic pruning tree of the TOM was constructed using the average linkage hierarchical clustering method for categorizing similar profiles of gene expressions into corresponding gene modules. In addition, modules with high similarity were merged into new modules and the parameters were as follows: height = 0.25, deepSplit = 2, and minModuleSize = 100. Finally, the module eigengene was calculated and the Pearson correlation analysis was performed; hub modules and cell clusters were thus identified.
Functional Enrichment Analysis of Hub Modules
The clusterProfiler R package was used to perform gene ontology (GO) annotation and Kyoto encyclopedia of genes and genomes (KEGG) pathway enrichment analyses for the identified genes belonging to the key modules. To determine the biological processes and involved signaling pathways, FDR < 0.05 was set up to identify the statistically significant enrichments in the gene clusters of the modules. The ggplot2 function was used to visualize the results using a bubble chart.
LUAD Sample Typing by Screening the Hub Genes in Hub Modules
Genes in hub modules overlapping with feature genes of module-associated cell clusters were identified and used for subsequent univariate Cox regression analysis for identifying the prognosis-associated hub genes. Next, we performed consistent clustering of LUAD tumor samples in TCGA based on the hub genes, using the ConsensusClusterPlus function for differentiating among the different molecular subtypes. Consensus distributions for each k were presented as empirical cumulative distribution function (CDF) plots.
Functional Annotation and Differential Analysis of Molecular Subtypes
Single-sample gene set enrichment analysis (ssGSEA) was performed to examine the biological functions of different subtypes using c2.cp.kegg.v7.0.symbols.gm. DEGs between subtypes were screened using the Limma package with FDR < 0.05 and |log2FC| > 1 set as the threshold values.
Generation of the Prognosis-Related Gene Signature
The significant (p < 0.01) associations between DEG expressions of subtypes and survival of LUAD patients in TCGA were analyzed using univariate Cox regression. To further identify the prognosis-related genes, the least absolute shrinkage and selection operator (LASSO) regression analysis was performed for the significantly related DEGs with the survival rates in LUAD patients. Akaike Information Criterion-based stepAIC approach was used to reduce the number of genes. The gene model of prognosis risk was established by weighing the estimated Cox regression coefficients.16 The risk score for each sample was measured by multiplying the Cox regression coefficient of each gene with the normalized expression level of that corresponding gene. The survival rates of the samples were presented as Kaplan–Meier survival plots. The area under the curve (AUC) was also evaluated using the receiver operator characteristic (ROC) curve for assessing the prognostic predictive performance of the signature.
Statistical Analysis
The R software (version: 3.5.2) was used to perform all statistical analyses and graphical representations. The Kaplan–Meier survival plots showed the survival rates of patients. The effectiveness of the model for predicting survival was assessed using the AUC of the ROC curve. Independent prognostic factors were identified by univariate and multivariate Cox regression analyses. Unless stated otherwise, statistical significance was considered at p < 0.05.
Results
Classification of the Cell Clusters Using Data from Single-Cell RNA Sequencing
A total of 8844 single cells were retained after the initial quality filtering using Seurat (Supplementary Figures S1 and S2). Data from all cells were integrated and analyzed for genes whose expressions were highly variable; among them, 2000 highly variable genes were screened with the top 20 genes visualizing in Supplementary Figure S3. The Seurat package was used to cluster these cells based on their PCA scores and to reduce the technical noises, owing to any single feature of the scRNA-seq data (Supplementary Figure S4). UMAP of 8844 cells from two-tumor and two para cancerous samples resulted in a total of 14 cell clusters, spanning a diverse range of cell types in the LUAD microenvironment (Figure 1A). These cell types included the basal cells, ciliated cells, dendritic cells, endothelial cells, monocyte cells, lung epithelial cells, macrophages, secretory cells, SLC16A7+ cells, and T cells, which could be further classified as epithelial cells, immune cells, and stromal cells of the tumor microenvironment (Figure 1B and Table 1). To differentiate between the cell types, we analyzed the marker expressions that were specific to each cell type and thus, obtained the top five markers (Figure 2A). Among them, C0 specifically expressed Alpha-2-Glycoprotein 1 Zinc Binding; C9 specifically expressed Aquaporins 5, and C10 specifically expressed Lung resistance protein 2. All these three cell clusters belonged to the same lung epithelial cell type. However, C4 and C12 consisted of secretory cells, while C4 specifically expressed Claudin 5 and apolipoprotein D, C12 specifically expressed membrane-spanning 4-domains subfamily A member and FCRL2. SLC16A7+ cells were divided into two clusters, namely C11 and C13; the C11 specifically expressed natural cytotoxicity triggering receptor 1 and CXC-chemokine receptor 1, while FCRL5 and Claudin 14 were specifically expressed in C13 (Figure 2B). In addition, CIBERSORT (cibersort.stanford.edu) analysis for the abundance of the 14 cell-type clusters between tumor and normal tissues showed that 10 clusters significantly exhibited differential abundances between these samples (Figure 2C).
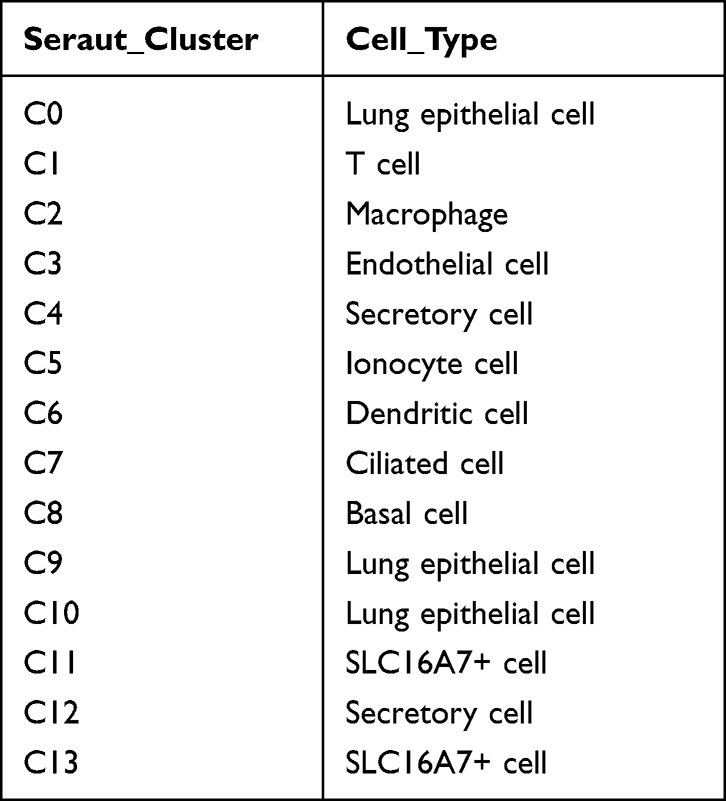 |
Table 1 Cell Type of Each Subgroup |
 |
Figure 1 UMAP plots of 8844 cell types in LUAD tumor tissues and para cancerous tissues. (A) cells labeled according to different samples, different tissue types, and the 14 identified cell clusters. (B) UMAP plots for different cell types. LUAD, lung adenocarcinoma. |
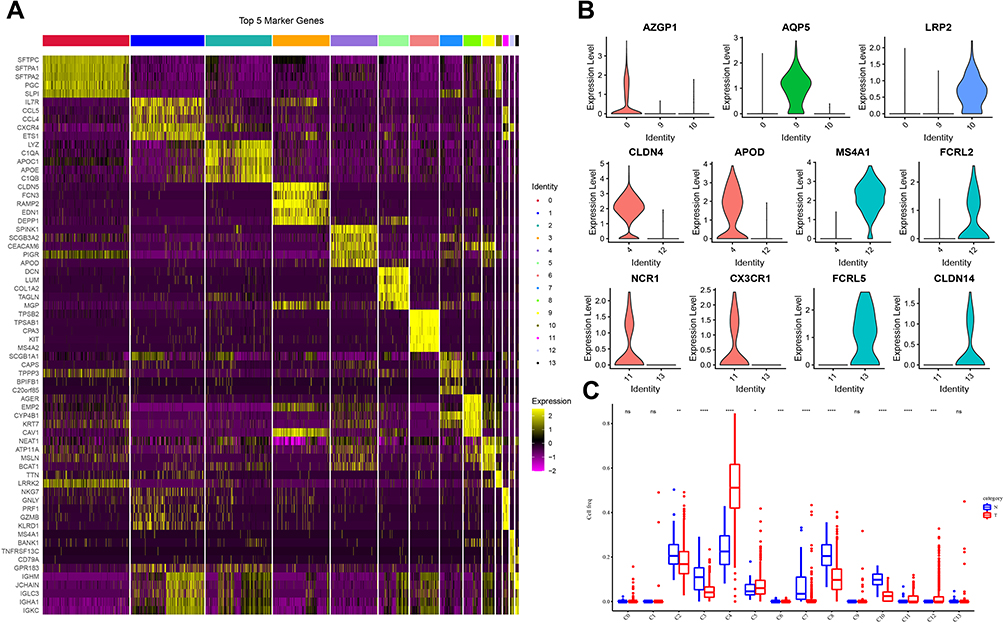 |
Figure 2 Specific gene expression analysis in different clusters. (A) Heat map showing the expression levels of the top 5 markers in each cell cluster. (B) Violin plot depicting the representative marker expression of each cluster. (C) Differences in the abundances of 14 cell clusters between tumor and normal tissues. Wilcoxon test was conducted. ns, no significance. *P < 0.05, **P < 0.01, ***P < 0.001, ****P < 0.0001. |
Hub Modules in LUAD Identified Using WGCNA
To find out which cell type was associated with LUAD, we then tried to identify DEGs between normal and tumor samples in TCGA-LUAD cohort, and then performed a correlation analysis between different cell types and DEGs. Differential analysis between normal and tumor samples yielded out a total of 11,890 DEGs in TCGA-LUAD cohort (Figure 3A). Then, WGCNA was performed to screen co-expression gene modules based on the expression of 11,890 genes with a power of soft threshold = 5, and 15 different gene modules were finally determined (Figure 3B and C). Among these modules, the turquoise module showed the strongest association with tumor samples, as well as the C10 cluster (Figure 3D). A total of 1522 genes were aggregated in the turquoise module, annotated correspondingly to 839 biological processes (BPs), 94 molecular functions (MFs), and 111 cellular components (CCs). The bubble chart shows the top 10 BPs, MFs, and CCs enriched in the turquoise module (Figure 3E). Notably, angiogenesis, cell–cell junction, and growth factor binding, involved in the biological progression of cancer, were significantly associated with the turquoise module (Figure 3E). In addition, a total of 29 KEGG pathways were significantly enriched in the turquoise module, where several pathways implicated in cancers were found, such as cGMP-PKG signaling pathway (Figure 3F).
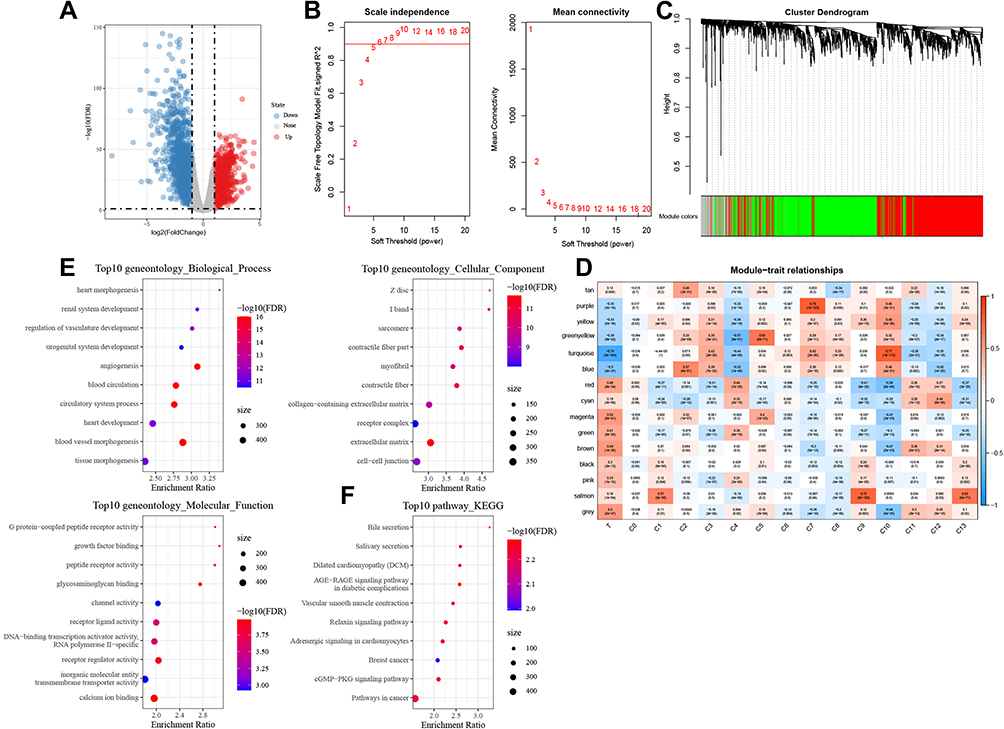 |
Figure 3 Hub modules in LUAD identified using WGCNA. (A) Volcano plot showing DEGs between the LUAD tumor and normal tissues. (B) Network topology analysis using different soft-thresholding powers. (C) Hierarchical clustering tree of genes showing modules of corresponding colors. (D) Module-cell cluster correlation, where in a row corresponds to one module and a column to a cell cluster. (E) GO terms, including BPs, MFs, and CCs associated significantly with the turquoise module. (F) The top 10 enriched KEGG pathways in the turquoise module. |
LUAD Typing Using the Hub Genes in the Turquoise Module
A total of 165 C10 marker genes were identified in the turquoise module through the intersection of the genes in this module with the C10 marker genes (Figure 4A). The univariate regression analysis of 165 genes yielded 23 genes that were significantly related to prognosis in LUAD (Figure 4B). A consensus cluster analysis of 513 LUAD samples was performed according to the expressions of these 23 genes, and subsequently, the samples were classified into k clusters. The CDF and CDF Delta area curves showed that the optimal division was achieved at k = 2 (Figure 4C). Therefore, LUAD samples were divided into two different molecular subtypes (Figure 4D). Overall, the prognosis of patients in C1 was significantly better than that in the C2 subtype (Figure 4E).
 |
Figure 4 LUAD typing using the hub genes in the turquoise module. (A) Venn plot depicting the intersection of genes in the turquoise module with C10 marker genes. (B) Forest plot of 23 genes significantly related to prognosis in LUAD. (C) CDF and CDF Delta area curves for LUAD samples in TCGA. (D) Cluster heat map for samples at k=2. (E) Kaplan–Meier curve showing the overall survival (OS) in patients belonging to the two molecular subtypes. |
Construction of Prognostic Predictive Signature for LUAD
Differential analysis of samples from C1 and C2 subtypes yielded a total of 511 DEGs (Figure 5A), of which 88 were significantly related to the survival in LUAD patients. Lasso Cox analysis was performed for the 88 DEGs and the highly correlated DEGs were removed (Figure 5B and C). Subsequently, five genes were further screened by stepAIC (DEPDC1B (P = 0.0688), TPSB2 (P = 0.0464), GJB3 (P = 0.0465), RHOV (P = 0.1477), CPS1 (P = 0.0482)). The prognostic signature was defined as follows: risk score = 0.139*DEPDC1B - 0.1*TPSB2 + 0.088*GJB3 + 0.07*RHOV + 0.051*CPS1. The risk scores were calculated for all samples in the LUAD-TCGA cohort by substituting the relevant values into the above formula; according to the median risk score, the patients were divided into the high-risk group and the low-risk group. The risk profile of the LUAD samples in TCGA and the expressions of the five genes showed that the higher was the risk score, the higher was the risk of death of the patient. The expression of TBST decreased with an increase in the risk score, while the expression trends of the other four genes were opposite (Figure 5D). A significantly shorter OS was observed in patients in the high-risk group as compared to those in the low-risk group (Figure 5E). Values of the area under the curve (AUC) for the signature-predicted 1-, 3-, and 5-year OS rates were 0.72, 0.68, and 0.59, respectively (Figure 5F). These results showed that the signature had a good predictive performance for OS in the LUAD-TCGA cohort.
 |
Figure 5 Construction of a prognostic predictive signature for LUAD. (A) Identification of DEGs between C1 and C2 subtypes. (B) Distribution of Lasso coefficients for 88 DEGs. (C) Vertical lines were drawn at the optimal parameter (lambda). (D) Distributions of survival status, risk scores, and expression trends of the five genes in the LUAD-TCGA cohort. (E) Survival analysis based on the corresponding risk groups. (F) Time-independent ROC analysis of risk scores for predicting the OS in the LUAD-TCGA cohort. |
Verification of the Prognostic Signature
The utility of the five-gene prognostic signature for predicting the prognosis of other LUAD patients was validated using the calculated z-risk scores of each patient in the different risk groups following the exact steps as detailed for the training set; GSE30219 and GSE31210 were used as the validation sets. Consistent with the results obtained for the LUAD-TCGA cohort, it was found that the higher was the risk score of the patients, the higher was their risk of death. The trends in expressions of the five genes were also similar to those observed in the training set (Figure 6A and D). Survival rates of patients in the high-risk group were substantially lower than those in the low-risk group (Figure 6B and E). In the GSE30219 dataset, the AUC values for the signature-predicted 1-, 3-, and 5-year OS rates were 0.72, 0.71, and 0.73, respectively (Figure 6C). AUC values of the signature-predicted 1-, 3-, and 5-year OS rates in the GSE31210 dataset were 0.87, 0.69, and 0.74, respectively (Figure 6F). The results obtained in both datasets showed the high sensitivity and specificity of the constructed prognostic signature.
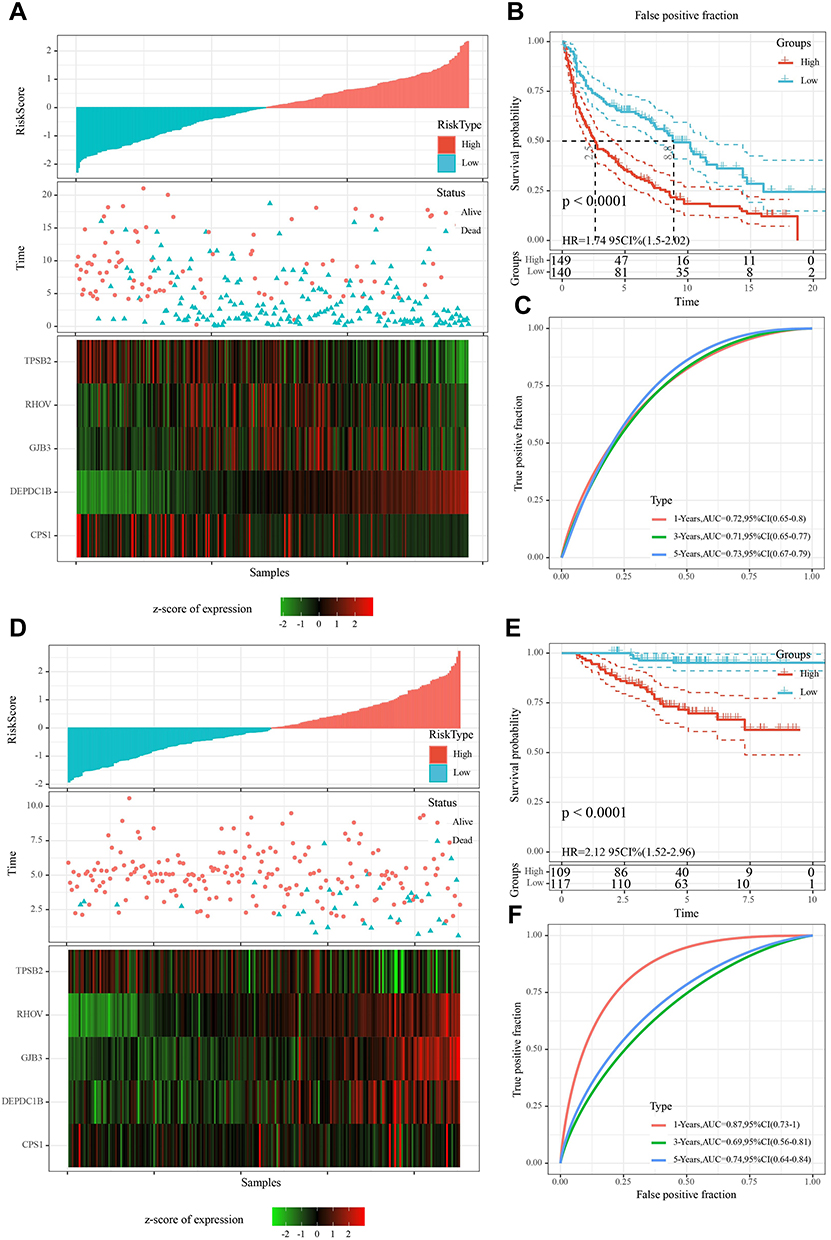 |
Figure 6 Validation of the five-gene prognostic signature in the GSE30219 and GSE31210 datasets. (A) Risk ranking, survival status, and expression levels of the five genes in the LUAD samples from the GSE30219 dataset. (B) OS for different risk groups in the GSE30219 dataset. (C) ROC analysis demonstrating the prognostic predictive performance of the five-gene signature in the GSE30219 database. (D) Heat maps for risk ranking, survival status, and expressions of five genes in LUAD patients in the GSE31210 validation set. (E) Survival curves for low-risk groups and high-risk groups in the GSE31210 validation set. (F) Time-dependent ROC curves for predicting prognosis in the GSE31210 validation set using the five-gene signature. |
Risk Score as an Independent Variable for Prognostic Prediction of LUAD
The distributions of risk scores across subgroups of clinical factors were also analyzed. The risk scores for males, higher tumor (T) stage, N (node) stage, American Joint Committee on Cancer (AJCC) stage, and C2 were found to be significantly higher than those for females, lower T stage, AJCC stage, N stage, and C1, respectively (Figure 7A). Univariate Cox regression analysis of these clinicopathological features showed that gender, N stage, T stage, AJCC stage, molecular subtype, and risk score were significantly related to the prognosis of LUAD patients. Multivariate Cox regression analysis after controlling for confounders indicated that the risk score was independently associated with the prognosis in LUAD, which suggested that the risk score was an independent prognostic marker for LUAD (Figure 7B and C).
 |
Figure 7 Clinical value of risk score. (A) Relationship between risk score and clinicopathological factors (gender, age, N stage, T stage, AJCC stage, and metastasis stage). (B) Results of univariate Cox regression analysis for risk score and clinicopathological characteristics. (C) Multivariate Cox regression analysis for determining the independent prognostic markers of LUAD. |
Discussion
Lung cancer, a deadly disease, occurs worldwide. The most common histological type of lung cancer is adenocarcinoma, which is characterized by a high degree of heterogeneity at multiple steps, including clinical, behavioral, cellular, and molecular levels.17 Single-cell sequencing provides a tool to characterize the high cellular heterogeneity. Several relevant clinical applications, wherein single-cell sequencing and the knowledge of tumor heterogeneity are likely to be crucial, include treatment effect and response prediction, disease progression monitoring, prognosis, and detection of emerging drug resistance.18
Due to the complexity of tumor microenvironment, the variation of certain cell groups or even one cell group may affect cancer development and progression. Therefore, in the present study, we utilized scRNA-seq data to identify different cell subtypes in tumor and para-tumor (normal) samples. Using the CIBERSORT algorithm, we compared the enrichment scores of different cell subtypes between tumor and normal samples, and identified differential cell subgroups between them. Then, WGCNA was performed based on transcriptional data from a large number of LUAD samples to distinguish different gene modules (one gene module has a similar expression pattern). WGCNA is an efficient method to identify gene sets with a close correlation with the phenotype or trait. Therefore, we conducted a correlation analysis between different gene modules and cell subgroups for identifying the key gene module. Subsequently, based on gene sets within the key gene module, we screened prognosis-associated genes and constructed molecular subtypes. Furthermore, differentially expressed genes between two molecular subtypes were used as a basis for establishing a prognostic gene signature for LUAD.
In this study, we identified 14 cell clusters after analyzing the scRNA-seq data from two tumor and two paracancerous tissue samples from TCGA. These cell clusters, belonging to 10 cell types, were classified as epithelial, stromal, and immune cells of the tumor microenvironment. Previous reports have shown that the differential composition and plasticity of lung epithelial cells are important factors for heterogeneity among lung cancer patients.19 The present study also showed that this cell type was among the most abundant cell types, as all three cell clusters included it. In addition, macrophages, the most abundant among the resident immune cell population, also represented a high proportion among the cell types.20 The most abundant stromal cells in LUAD were endothelial cells, an important cluster influencing tumor heterogeneity.21 Overall, multiple types of cell clusters constituted and contributed to the intratumor heterogeneity in LUAD.
ScRNA-seq has been used to identify specific prognostic biomarkers for cancer patients. For example, a recent study identifies and confirms 17 metastasis-associated genes that are significantly associated with cancer-specific tumor progression through scRNA-seq raw data analysis of 121 high-quality cells.22 Herein, we took different steps to rationalize the prognostic gene signature of LUAD. Specifically, WGCNA was performed and the turquoise module was found to be the most significantly associated module with LUAD; the C10 cluster was most strongly associated with this module. Patients with LUAD in TCGA were classified into two different groups according to the specifically expressed overlapping genes between the hub genes of the turquoise module and those in the C10 cluster. The hub genes were screened by Lasso and Cox regression analyses of DEGs between groups, which were used for the development of the prognostic signature. Among them, the differentially expressed protein domain-containing protein 1B is a known oncogene that induces proliferation and metastasis of cancer cells in several malignancies of bladder,23 prostate,24 and oral cancers.25 Results from a previous study demonstrate that carbamoylphosphate synthetase 1 is highly aberrantly expressed and correlates with OS and cancer treatment response in LUAD patients.26 However, the effects of the other three genes on LUAD remain unclear.
A gene signature was constructed using the above-mentioned five genes, and the risk score per sample was calculated by substituting for the gene signature formula relevant to each independent dataset. The higher was the risk score of the patients, the higher was the risk of death. In addition, our prognostic gene signature could further classify the LUAD patients into two based on the differential clinical characteristics; the risk scores for males, higher N stage, T stage, AJCC stage, and C2 cluster were significantly higher than those of the females, lower N stage, T stage, AJCC stage, and C1 cluster. Therefore, the five-gene signature developed in the present study was an independent prognostic marker of LUAD.
Although lines of previous studies have already explored a series of prognostic signatures for LUAD based on WGCNA,10,11,27,28 they do not integrate single-cell data and use bulk-transcriptional data only. The advantage of our study design is that cell subgroups or gene sets significantly associated with tumor development can be dug out in a relatively comprehensive manner. Compared with only WGCNA or differential analysis between normal and tumor samples, our methodology has a higher resolution for identifying key prognostic genes that may be easily neglected due to its relatively low expression or change. In addition, single-cell data analysis offered a more precise direction for identifying the key gene module that highly contribute to LUAD.
However, there are some limitations in the current study. The small number of sequencing reads from the collected samples limited the sensitivity of the molecular phenotypic data obtained from the cells.18 In addition, our study was based on the pure bioinformatic analyses, and these results are much less convincing than those from clinical trials. The inconsistency between mRNA and protein expression may also affect the accuracy of the results. Therefore, more clinical LUAD samples should be included, and further experiments such as immunohistochemistry are needed to verify our results.
Conclusion
In conclusion, intratumor heterogeneity in LUAD was observed in this study based on scRNA-seq data analysis; the genes specifically expressed in each cell cluster were identified. Combined with the LUAD dataset from TCGA, a weighted co-expression network was generated for subtype grouping of LUAD samples based on the expressions of the marker genes. Finally, a five-gene signature that correlated significantly with the prognosis and clinical characteristics of LUAD patients was developed and validated.
Ethics Approval
This study has been exempted from ethical review by the Ethics Committee of Shenzhen Hospital of Guangzhou University of traditional Chinese Medicine.
Data Sharing Statement
The datasets analyzed in the current study are available in the [GSE30219] repository, [https://www.ncbi.nlm.nih.gov/geo/query/acc.cgi?acc=GSE30219], and [GSE31210] repository, [https://www.ncbi.nlm.nih.gov/geo/query/acc.cgi?acc=GSE31210].
Funding
This study did not receive any funding.
Disclosure
The authors report no conflicts of interest in this work.
References
1. Sung H, Ferlay J, Siegel RL, et al. Global Cancer Statistics 2020: GLOBOCAN Estimates of Incidence and Mortality Worldwide for 36 Cancers in 185 Countries. CA Cancer J Clin. 2021;71(3):209–249. doi:10.3322/caac.21660
2. Testa U, Castelli G, Pelosi E. Lung Cancers: molecular Characterization, Clonal Heterogeneity and Evolution, and Cancer Stem Cells. Cancers. 2018;10(8):548. doi:10.3390/cancers10080248
3. Okudela K, Matsumura M, Arai H, Woo T. The nonsmokers’ and smokers’ pathways in lung adenocarcinoma: histological progression and molecular bases. Cancer Sci. 2021;112(9):3411–3418. doi:10.1111/cas.15031
4. Pan D, Jia D. Application of Single-Cell Multi-Omics in Dissecting Cancer Cell Plasticity and Tumor Heterogeneity. Front Mol Biosci. 2021;8:757024. doi:10.3389/fmolb.2021.757024
5. Zhang Y, Wang D, Peng M, et al. Single-cell RNA sequencing in cancer research. J Exp Clin Cancer Res. 2021;40(1):81. doi:10.1186/s13046-021-01874-1
6. Karaayvaz M, Cristea S, Gillespie SM, et al. Unravelling subclonal heterogeneity and aggressive disease states in TNBC through single-cell RNA-seq. Nat Commun. 2018;9(1):3588. doi:10.1038/s41467-018-06052-0
7. Peng J, Sun BF, Chen CY, et al. Single-cell RNA-seq highlights intra-tumoral heterogeneity and malignant progression in pancreatic ductal adenocarcinoma. Cell Res. 2019;29(9):725–738. doi:10.1038/s41422-019-0195-y
8. Zheng C, Zheng L, Yoo JK, et al. Landscape of Infiltrating T Cells in Liver Cancer Revealed by Single-Cell Sequencing. Cell. 2017;169(7):1342–1356 e1316. doi:10.1016/j.cell.2017.05.035
9. Kim KT, Lee HW, Lee HO, et al. Application of single-cell RNA sequencing in optimizing a combinatorial therapeutic strategy in metastatic renal cell carcinoma. Genome Biol. 2016;17:80. doi:10.1186/s13059-016-0945-9
10. Yi M, Li T, Qin S, et al. Identifying tumorigenesis and prognosis-related genes of lung adenocarcinoma: based on weighted gene coexpression network analysis. Biomed Res Int. 2020;2020:4169691. doi:10.1155/2020/4169691
11. Xie H, Zhang JF, Li Q. Identification and analysis of genes associated with lung adenocarcinoma by integrated bioinformatics methods. Ann Hum Genet. 2021;85(3–4):125–137. doi:10.1111/ahg.12418
12. Stuart T, Butler A, Hoffman P, et al. Comprehensive Integration of Single-Cell Data. Cell. 2019;177(7):1888–1902 e1821. doi:10.1016/j.cell.2019.05.031
13. Satija R, Farrell JA, Gennert D, Schier AF, Regev A. Spatial reconstruction of single-cell gene expression data. Nat Biotechnol. 2015;33(5):495–502. doi:10.1038/nbt.3192
14. Yu G, Wang LG, Han Y, He QY. clusterProfiler: an R package for comparing biological themes among gene clusters. J Integrative Biol. 2012;16(5):284–287. doi:10.1089/omi.2011.0118
15. Langfelder P, Horvath S. WGCNA: an R package for weighted correlation network analysis. BMC Bioinform. 2008;9:559. doi:10.1186/1471-2105-9-559
16. Zhang Z, Reinikainen J, Adeleke KA, Pieterse ME, Groothuis-Oudshoorn CGM. Time-varying covariates and coefficients in Cox regression models. Ann Transl Med. 2018;6(7):121. doi:10.21037/atm.2018.02.12
17. Senosain MF, Massion PP. Intratumor Heterogeneity in Early Lung Adenocarcinoma. Front Oncol. 2020;10:349. doi:10.3389/fonc.2020.00349
18. Rantalainen M. Application of single-cell sequencing in human cancer. Brief Funct Genomics. 2018;17(4):273–282. doi:10.1093/bfgp/elx036
19. Sarode P, Mansouri S, Karger A, et al. Epithelial cell plasticity defines heterogeneity in lung cancer. Cell Signal. 2020;65:109463. doi:10.1016/j.cellsig.2019.109463
20. Milette S, Fiset PO, Walsh LA, Spicer JD, Quail DF. The innate immune architecture of lung tumors and its implication in disease progression. J Pathol. 2019;247(5):589–605. doi:10.1002/path.5241
21. Hida K, Maishi N, Annan DA, Hida Y. Contribution of Tumor Endothelial Cells in Cancer Progression. Int J Mol Sci. 2018;19:5. doi:10.3390/ijms19051272
22. Hu X, Fujimoto J, Ying L, et al. Multi-region exome sequencing reveals genomic evolution from preneoplasia to lung adenocarcinoma. Nat Commun. 2019;10(1):2978. doi:10.1038/s41467-019-10877-8
23. Lai CH, Xu K, Zhou J, et al. DEPDC1B is a tumor promoter in development of bladder cancer through targeting SHC1. Cell Death Dis. 2020;11(11):986. doi:10.1038/s41419-020-03190-6
24. Li Z, Wang Q, Peng S, et al. The metastatic promoter DEPDC1B induces epithelial-mesenchymal transition and promotes prostate cancer cell proliferation via Rac1-PAK1 signaling. Clin Transl Med. 2020;10(6):e191. doi:10.1002/ctm2.191
25. Su YF, Liang CY, Huang CY, et al. A putative novel protein, DEPDC1B, is overexpressed in oral cancer patients, and enhanced Anchorage-independent growth in oral cancer cells that is mediated by Rac1 and ERK. J Biomed Sci. 2014;21:67. doi:10.1186/s12929-014-0067-1
26. Wu G, Zhao Z, Yan Y, et al. CPS1 expression and its prognostic significance in lung adenocarcinoma. Ann Transl Med. 2020;8(6):341. doi:10.21037/atm.2020.02.146
27. Sun S, Guo W, Wang Z, et al. Development and validation of an immune-related prognostic signature in lung adenocarcinoma. Cancer Med. 2020;9(16):5960–5975. doi:10.1002/cam4.3240
28. Liao Y, Wang Y, Cheng M, Huang C, Fan X. Weighted Gene Coexpression Network Analysis of Features That Control Cancer Stem Cells Reveals Prognostic Biomarkers in Lung Adenocarcinoma. Front Genet. 2020;11:311. doi:10.3389/fgene.2020.00311
 © 2022 The Author(s). This work is published and licensed by Dove Medical Press Limited. The
full terms of this license are available at https://www.dovepress.com/terms
and incorporate the Creative Commons Attribution
- Non Commercial (unported, 3.0) License.
By accessing the work you hereby accept the Terms. Non-commercial uses of the work are permitted
without any further permission from Dove Medical Press Limited, provided the work is properly
attributed. For permission for commercial use of this work, please see paragraphs 4.2 and 5 of our Terms.
© 2022 The Author(s). This work is published and licensed by Dove Medical Press Limited. The
full terms of this license are available at https://www.dovepress.com/terms
and incorporate the Creative Commons Attribution
- Non Commercial (unported, 3.0) License.
By accessing the work you hereby accept the Terms. Non-commercial uses of the work are permitted
without any further permission from Dove Medical Press Limited, provided the work is properly
attributed. For permission for commercial use of this work, please see paragraphs 4.2 and 5 of our Terms.