Back to Journals » Journal of Multidisciplinary Healthcare » Volume 13
Confirmatory Factor Analysis and Reliability of the Diabetes Treatment Satisfaction Questionnaire (DTSQ) for Arabic Speaking Patients with Type II Diabetes
Authors Arabiat Snr D ![]() , Whitehead Snr L
, Whitehead Snr L ![]() , Abu Sheikh Jnr B
, Abu Sheikh Jnr B ![]() , Afrifa-Yamoah E
, Afrifa-Yamoah E ![]()
Received 9 June 2020
Accepted for publication 6 August 2020
Published 17 September 2020 Volume 2020:13 Pages 953—961
DOI https://doi.org/10.2147/JMDH.S266913
Checked for plagiarism Yes
Review by Single anonymous peer review
Peer reviewer comments 3
Editor who approved publication: Dr Scott Fraser
Diana Arabiat,1,2 Lisa Whitehead,1,3 Buthina Abu Sheikh,4 Ebenezer Afrifa-Yamoah5
1Edith Cowan University, School of Nursing and Midwifery, Joondalup, Perth, WA 6027, Australia; 2Maternal and Child Nursing Department, The University of Jordan, Amman 11942, Jordan; 3University of Otago, Postgraduate Centre for Nursing Studies, Christchurch, New Zealand; 4Diabetes Department, Jordan University Hospital, Amman, Jordan; 5Edith Cowan University, School of Science, Joondalup, Perth, WA, Australia
Correspondence: Diana Arabiat
Edith Cowan University, School of Nursing and Midwifery, 270 Joondalup Drive, Building 21, Joondalup, Perth, WA 6027, Australia
Tel +61 415875977
Email [email protected]
Background: Treatment satisfaction is an important indicator for treatment compliance and glycemic control. Although psychometric properties of the Diabetes Treatment Satisfaction Questionnaire have been confirmed in several languages, it remains unclear the extent to which the factorial structure of this tool is valid for Arabic speaking populations.
Purpose: This study set out to confirm the construct validity of the Arabic version of the Diabetes Treatment Satisfaction Questionnaire (DTSQ) by investigating the fit of published factor structures and the reliability of responses in patients diagnosed with type 2 diabetes.
Methods: Data were from a large cross-sectional study of 1002 patients with diabetes in Jordan. Confirmatory factor analysis was used to compare three different models of the 8-item questionnaire (one factor, two factors, three factors) across patients treated with insulin and patients treated with oral hypoglycaemic medications.
Results: Statistics covered the factorial validity and omega reliability coefficient (Ωw) of the DTSQ. We were able to replicate the three different models of the 8-item Diabetes Treatment Satisfaction Questionnaire reported in previous studies, yet a two-factor model provided the best fit to the data in our sample with omega reliability coefficient (Ωw) of the subscales above 0.70.
Conclusion: The finding suggests a cross-cultural invariance of the factor structure of the Arabic version of the Diabetes Treatment Satisfaction Questionnaire, as we were able to replicate the same factor structure using the Arabic translated version of the tool and using non-English speaking participants. Within known limitations and gaps in the literature, healthcare professionals working with Arabic speaking patients may find this tool useful for identification of high-risk patients and those in need for interventions to promote glycemic control.
Keywords: treatment satisfaction, factor analysis, diabetes, Arabic, reliability, validity
Introduction
For the Arab world, diabetes is a devastating chronic illness with one of the highest incidences in the world.1,2 The added cost of long-term diabetes care, shortages in medicines and services, and lengthy waiting times can make accessing necessary treatment a challenge for patients in the Middle East region.3,4 Key to the management of diabetes according to the American Diabetes Association Standards of Medical Care in Diabetes5 is glycemic control, and this underpins the prevention of acute and long-term complications. Maintaining glycemic control through a combination of medication and/or lifestyle remains challenging for many people living with type 2 diabetes6 and linked to long-term complications.7,8
Now it is widely acknowledged that treatment satisfaction is an important indicator for treatment compliance; health professionals must take into consideration their patients’ point of view of their treatment. Treatment satisfaction is conceptualized as the “confirmation of expectations for a patient, that is, the agreement between what the patients expects from the treatment and the results obtained”.9 It is suggested that improving treatment satisfaction is likely to improve health status10–12 and treatment adherence in patients with diabetes.7,13,14 With recent evidence of a clear relationship between depression and treatment satisfaction in type 2 diabetic patients;15 the expectations and subsequent satisfaction with treatment may be an important determinant of patient wellbeing.8,16 If improving treatment satisfaction in diabetic patients leads to improvement in glycemic control and patient’s wellbeing, then treatment satisfaction should be targeted as an area of improvement in this population.
There are a number of instruments to measure patient-reported outcomes in diabetes, yet limited instruments are available for use in the Arabic language.17 One instrument that has been specifically designed to measure patient satisfaction with diabetes medication and glucose control is the Diabetes Treatment Satisfaction Questionnaire Status, DTSQs.18 The DTSQs instrument have been psychometrically tested in eight languages using baseline data from over 2,223 patients with type 1 or type 2 diabetes in the Hoechst Marion Roussel (HMR) multinational, random controlled trial.19
Overall, most available empirical research of the factorial structure of DTSQ has been exploratory in nature. Previous studies19–21 used exploratory methods to evaluate the factor structure of the DTSQ and have supported a two-factor structure. It is suggested, however, that the factor structure of the DTSQ needs further evaluation for the Dutch and Finnish version of the scale.19 In fact, when Bradley et al20 presented the psychometric properties of the English and German version of the DTSQ, the main focus was to examine the DTSQ, diabetes treatment, and Ceiling effects. We were not able to find a specific empirical evidence on the goodness-of-fit index of the 8-items of DTSQ in the literature. Plowright et al19 attempted to confirm the psychometric properties of the DTSQ in eight languages, including English, German, Swedish, French, Danish, Norwegian, Dutch, and Finnish. However, this study was limited to short abstracts that give no information about how it was tested or how the fit of the different structures was computed. Therefore, it remains unclear the extent to which the factorial structure of the DTSQ is valid in other languages. Clearly, a good conceptualization of the factorial structure of the DTSQ is scarce in the literature; the dimensions identified by earlier studies19,20 may be a starting point to build a more articulated theoretical framework.
The findings of DTSQ exploratory studies can be useful in the early stages of empirical enquiry where a theoretical underpinning or empirical evidence do not exist. Exploratory analysis of previous studies was helpful in hypothesizing the DTSQ construct, yet subsequent studies are needed to test the factorial structure of the DTSQ via confirmatory analytic technique. It remains unclear the extent to which the factorial structure of this tool is valid for other populations such as Arabic speaking patients. Moreover, despite encouraging evidence from Wilbur and Al Hammaq17 regarding the utility of the existing Arabic DTQSs version in Qatar, the factor structure, and other features of the DTSQs are yet to be firmly established.
Aims
The aim of the current study was to confirm the construct validity of the Arabic version of the Diabetes Treatment Satisfaction Questionnaire by investigating the fit between published factor structures and the reliability of responses in patients diagnosed with type 2 diabetes in Jordan, with particular attention to the similarity of responses from patients with insulin versus oral hypoglycemic treatment.
Methods
Participants and Procedure
Data were from a large cross-sectional study of 1002 patients with diabetes. The study was limited to patients older than 18 years of age, diagnosed with type 2 diabetes for at least 6 months prior to participation, and who were able to read and understand Arabic. Participants were recruited from a large, specialized national center for diabetes and endocrinology in Amman/Jordan. One author interviewed all participants to collect socio-demographic (eg, age, sex, education, marital status, Body Mass Index) and clinical variables (eg, duration of diabetes, type of treatment, comorbidity, glycemic control, exercise and diet, and complications). Participants were then asked to complete the DTSQ.
Instrument
Treatment satisfaction was assessed using the 8-item Diabetes Treatment Satisfaction Questionnaire.18,22 The DTSQ consisted of two parts: 1) the treatment satisfaction (items 1, 4–8); and 2) the perceived frequency of hyperglycemia/hypoglycemia (items 2 and 3). Responses to treatment satisfaction used a 7-point Likert scale ranging from 0 “very dissatisfied” to 6 “very satisfied”.23 The treatment satisfaction score is the sum of six of the items of the DTSQ for each respondent with a possible score of 0–36. This includes satisfaction with current treatment (item 1); treatment convenience (item 4); flexibility of treatment (item 5); understanding of diabetes (item 6); continuity of treatment (item 7); and recommending treatment to others with diabetes (item 8). The additional two items measure perceived frequency of hyperglycemia and hypoglycemia and use a seven-point scale (0–6) where a score of 0 indicates lack of hypo- or hyperglycemia and a score of 6 indicates a higher frequency.
Ethical Consideration
This study was conducted in accordance with the Declaration of Helsinki. Ethical approval to conduct the study was obtained from the ethics committee of the clinical setting (Ethical approval number MS/9/57 dated January 9, 2014). Approval to reproduce the existing Arabic version of the DTSQs for Israel and Saudi Arabia was granted by Dr. Bradley (Copyright holder) as part of another larger study on correlates of treatment satisfaction and wellbeing in type 2 diabetes.
Statistical Analysis
A priori factorial structure existed for the subscales of the DTSQ, therefore, we proceeded to the confirmatory factorial analysis. This analysis was performed using (EQS V6.2) and was based on the factorial structure of prior psychometric work performed by Plowright et al.19 According to Bradley et al,20 the most common factor structures for the DTSQ show all six treatment satisfaction items loading on factor 1, while the Perceived Hyper- and Hypoglycemia items load together on factor 2 or separately on factors 1 and 2 or on 2 and 3.
First, descriptive statistics including univariate and multivariate analysis was conducted. Means, standard deviations (SD), skewness, and kurtosis for the participants treated with insulin and oral medication are presented in Table 1.
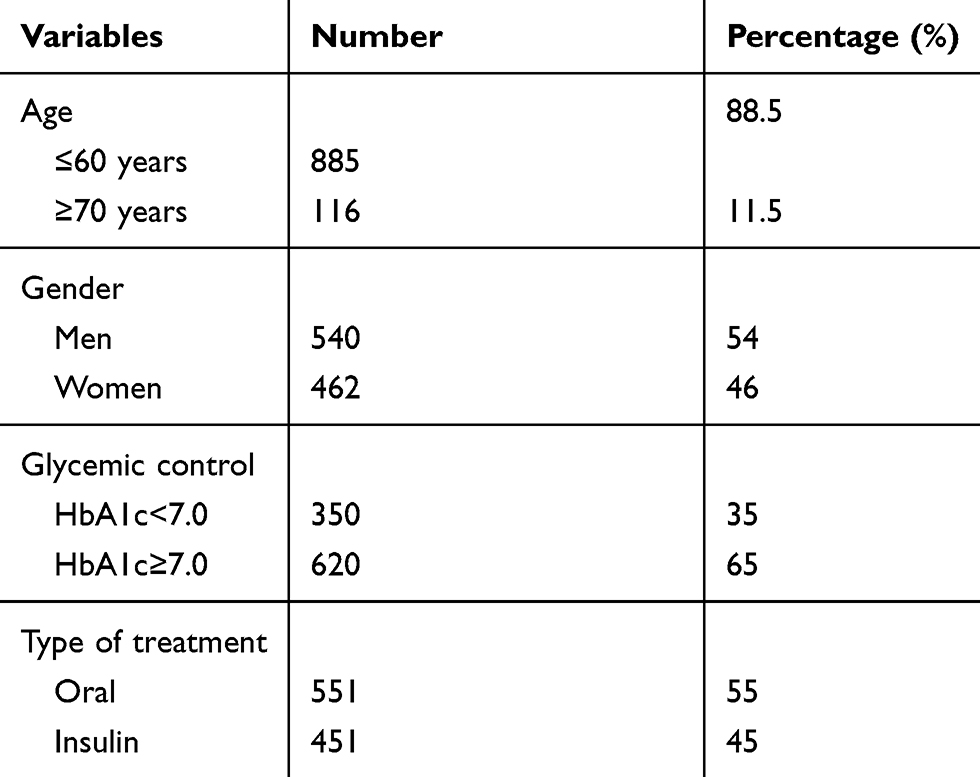 |
Table 1 Socio-Demographic and Clinical Characteristics of Participants (n=1002) |
Second, to test the fit of published factor structure of the DTSQ subscales, three competitive models were tested. The first model was an 8-item factorial structure compromising one factor (Model 1). The second model tested a two-factor structure with all six treatment satisfaction items loading on factor one and the perceived hyper and hypoglycemia items load together on factor 2 (Model 2). The third model tested a three-factor structure with all six treatment satisfaction items loading in factor one, perceived hypoglycemia loading on factor two, and perceived hyperglycemia loading on factor three (Model 3).
The CFA were analyzed through the maximum estimation likelihood adjusted through Satorra-Bentler robust method; S-BΧ2 24 to correct for heteroscedasticity and lack of normality. The goodness of fit S-BΧ2was used to assess the global fit of the model. A relatively good fit of the model was considered when two of the incremental and absolute fit indices such as CFI, RMSEA, and SRMR indicated a good fit. Hu and Bentler25 considered a CFI higher than 0.95 a good fit of a model, while a value equal to or less than 0.06 of the RMSEA and 0.08 or less of the SRMR indicates a good fit of a model. The comparison of the nested models was based on ΔS-BΧ2 26 and ΔCFI27 where the model of the highest CFI and lowest AIC fit the best. The 90% confidence interval (90% CI) for RMSEA was computed and the factor loadings of the DTSQ items were calculated for each model in the standardized solution.
The estimated parameters resulting from the confirmatory factorial analysis were used to compute the reliability of the subscales of the DTSQ suggested in models 2 and 3. The values of the weighted-omega reliability coefficient (ΩW) were compared to the cut-off value of 0.70. Finally, given that the CFA have been estimated for two different groups of interest, measurement invariance was computed for each group.
Results
Sample Characteristics
In total, 1002 patients with a medical diagnosis of type 2 diabetes mellitus participated in this study (see Table 1). Gender was equally distributed; 540 males (54%) and 462 females (46%).
Item Analysis and Factorial Structure of the DTSQ
Table 2 summarizes descriptive statistics for each item of the DTSQ.
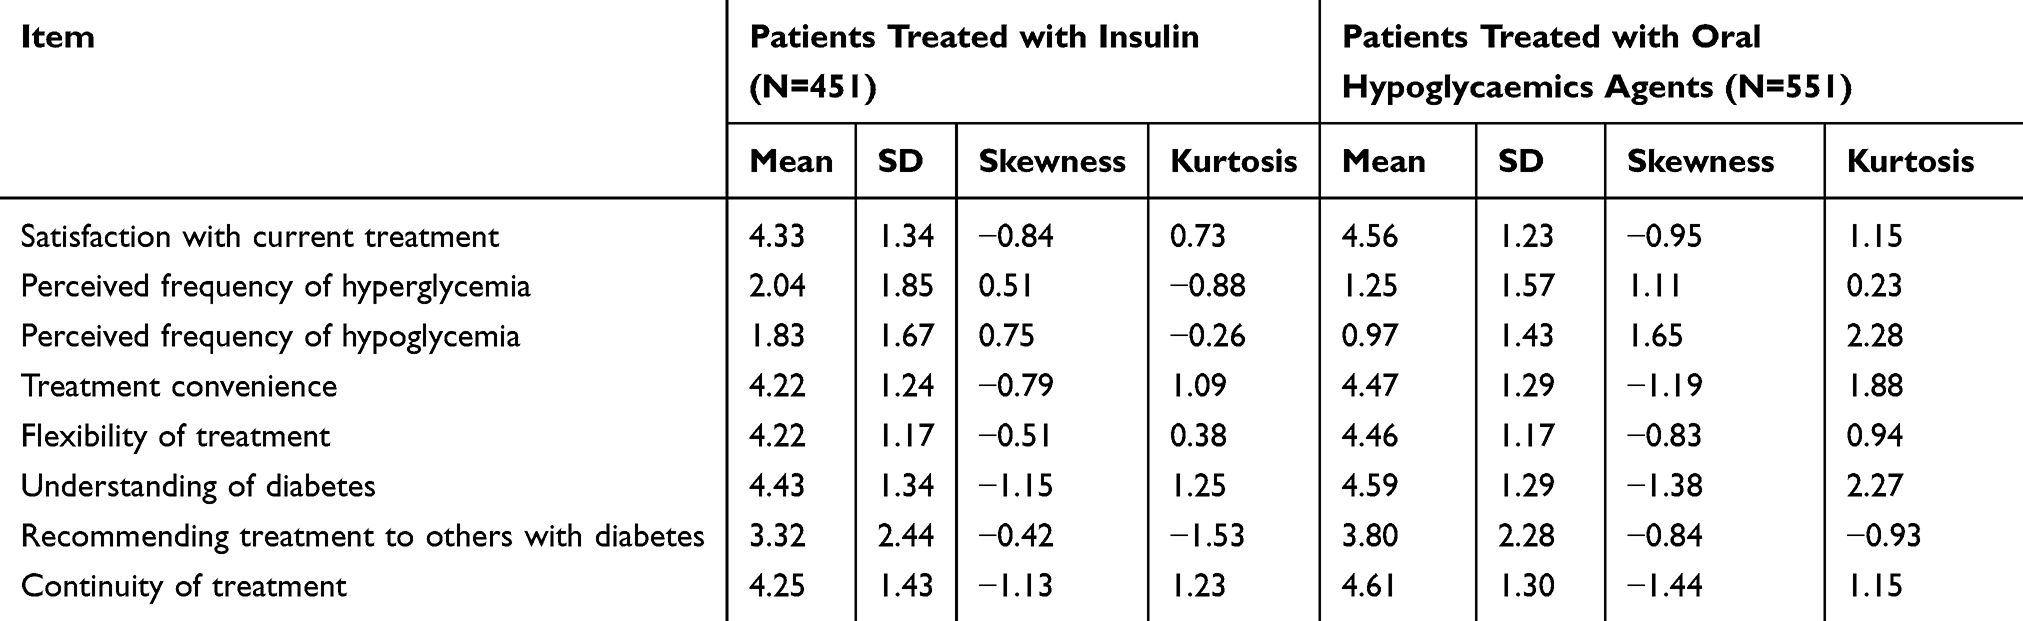 |
Table 2 Univariate and Multivariate Descriptive Results for DTSQ |
The goodness-of fit indices of the confirmatory factor analysis conducted are shown in Table 3. The CFA conducted on the entire sample showed a weak model fit for the model 1 (S-B Χ2=191.10 (204), P>0.001, CFI=0.938, TLI=0.913, RMSEA=0.092 (90% CI=0.081–0.105)). Model 2 showed a somewhat better fit in terms of a decreased chi-square value and decreased RMSEA value (S-B χ2=128.79 (19), P<0.001, CFI=0.960, TLI=0.941, RMSEA=0.076 (90% CI=0.064–0.098)). However, the factorial structure of model 3 fitted relatively well too (S-B χ2=128.79 (19), P<0.001, CFI=0.960, TLI=0.941, RMSEA=0.076 (90% CI=0.064–0.098)).
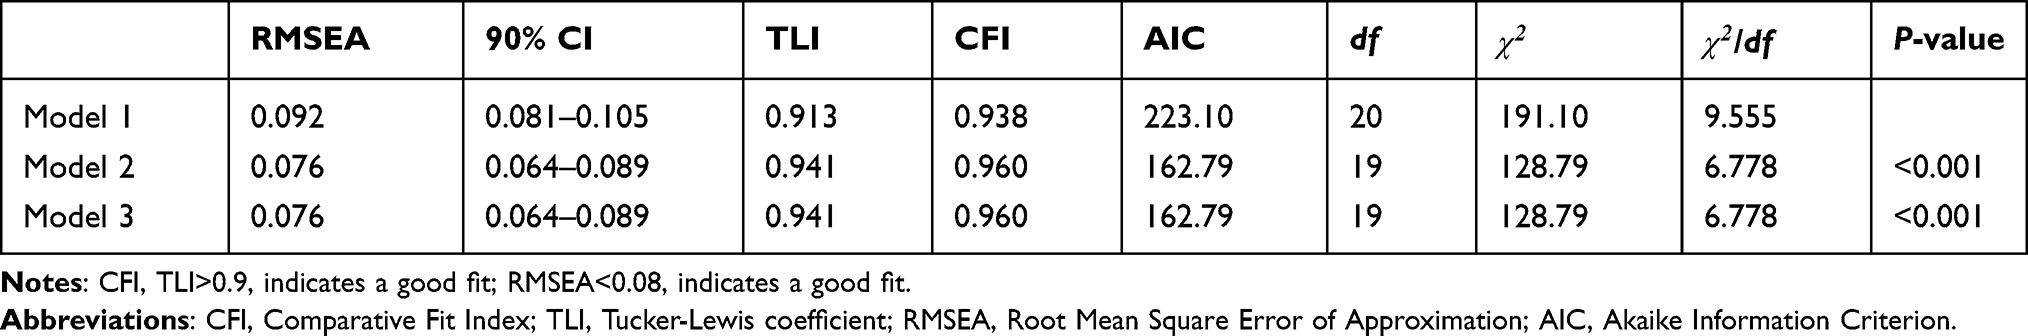 |
Table 3 Goodness-of-Fit Indices for the Theoretical Models Proposed of DTSQ |
While the fit indices were relatively similar between models, we picked the model with the least AIC as the best model. Therefore, model 2 was regarded as the best model that presented better fit, in addition to an acceptable fit with the observed data. Standardized factor loadings by models and latent construct is presented in Figure 1. The two-factors construct (Model 2) was analyzed by constraining the covariance between the errors of items 2 and 3 to 0.7 – to ensure model identifiability. In the three-factors construct (Model 3), no significant gains from moving from two constructs to three constructs, the only advantage with the three constructs model is that the parameters were freely estimated, while we had to constrain the error covariance between the two items for one of the constructs in model 2. Factor correlations in model 2 (with standard errors) was −0.480 (0.056), and for model 2 was −0.256 (0.056); 0.015 (0.049), and 0.235 (0.091). Our results suggest the influence of the negative and positive response scores of the perceived hypo- and hyperglycemia on the factorial validity of the DTSQ.
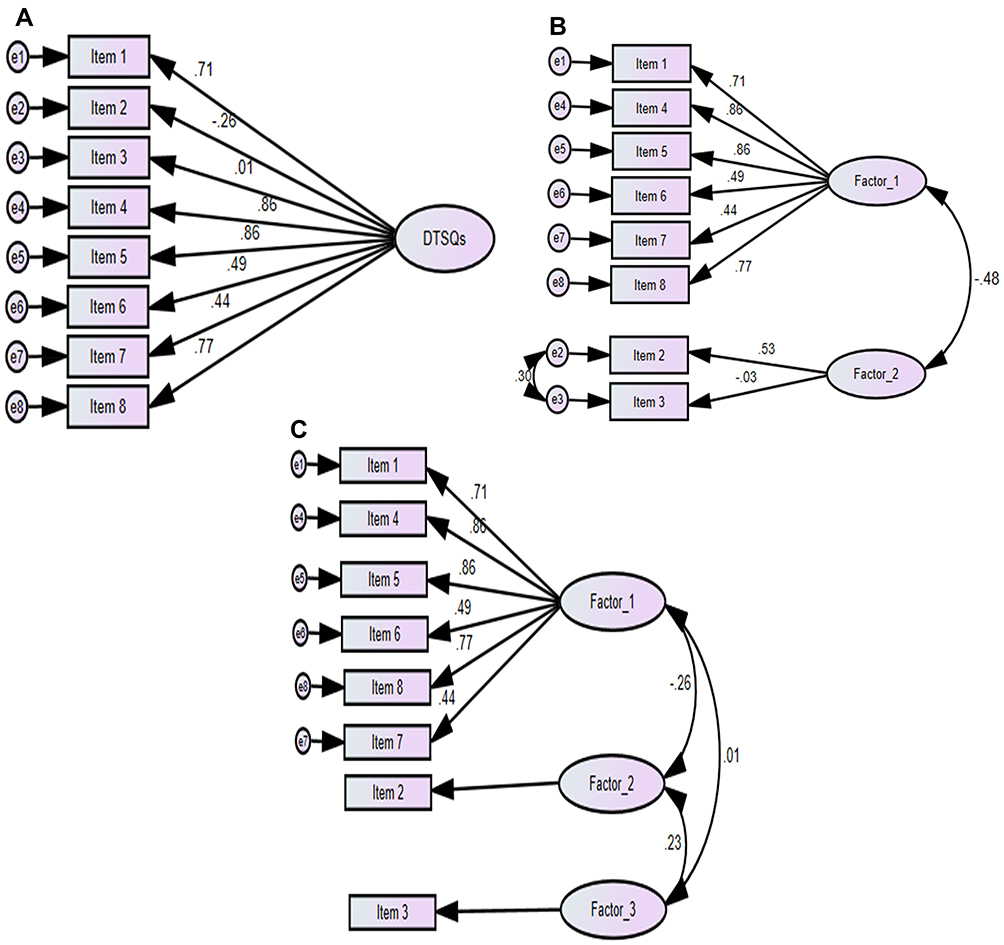 |
Figure 1 (A) One-factor model; (B) Two-factors model; (C) Three-factors model of the DTSQ. |
As shown in Figure 1, the standardized solution for factor loadings (range= 0.008–0.86) for model 1 indicated that the items related with perceived hypo- and hyperglycemia were inadequate indicators of the latent factors. For each factorial structure tested, it was noted that item 3 related with perceived frequency of hypoglycemia presented the poorest factor loading in model 1 and model 2 (<0.3). The standardized coefficients for the two-factor model and three-factor models were related to both dimensions of perceived hypo–hyperglycemia and treatment satisfaction.
Invariance of DTSQ Across Gender and Type of Treatment
To perform invariance tests across gender and across patients treated with insulin or oral hypoglycemics medications, a large independent sample of 551 patients treated with insulin and 451 patients treated with oral hypoglycemics medication was used. The CFA conducted on the sample according to age and type of treatment are shown in Table 4 and show a good model fit in both groups. As displayed in Table 5, model fit was still adequate when invariance constraints were placed stepwise on factor loadings, covariances, and error variances. The CFI for all groups showed no difference (CFI diff=0.01) between the baseline model and the subsequently more constrained models and the chi-square difference was nonsignificant, so we can assume that the factorial structure of the DTSQ was operating equivalently across genders and across patients treated with insulin and those treated with oral diabetes medication.
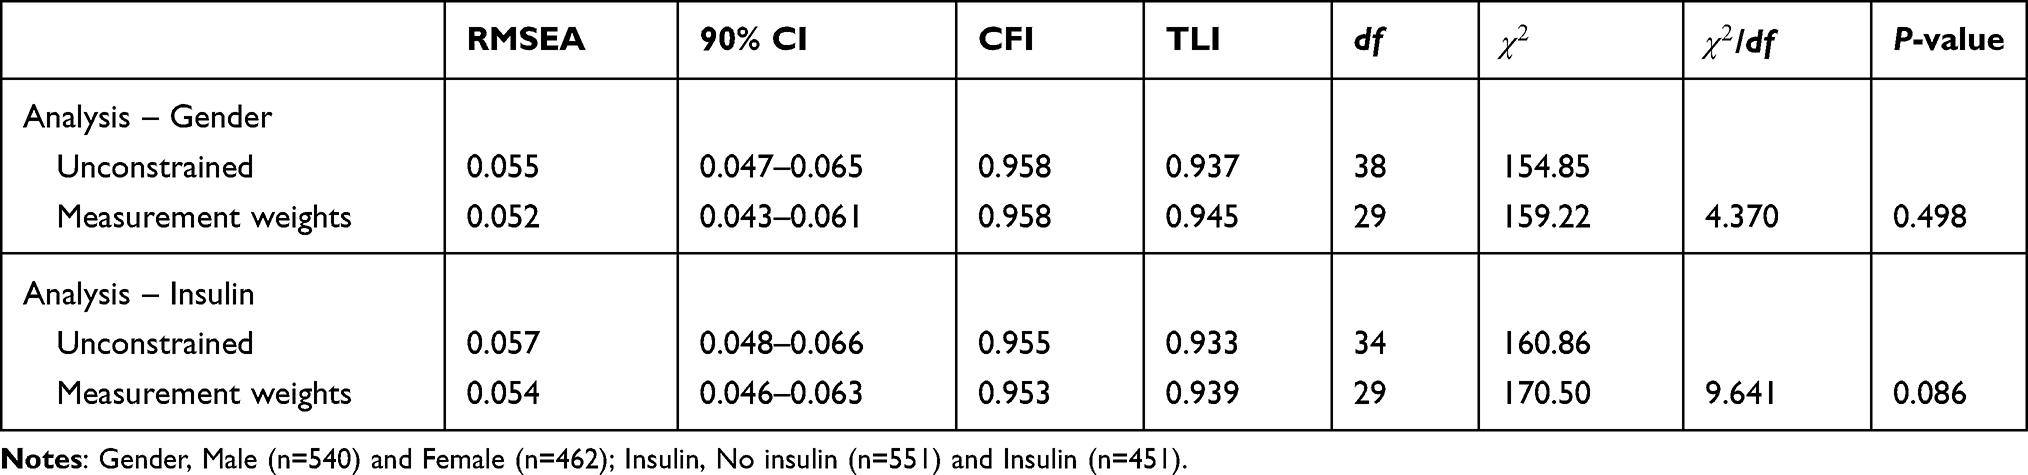 |
Table 4 Measurement Weights Constrained – Testing for Invariance Between Groups for the Factor Loadings |
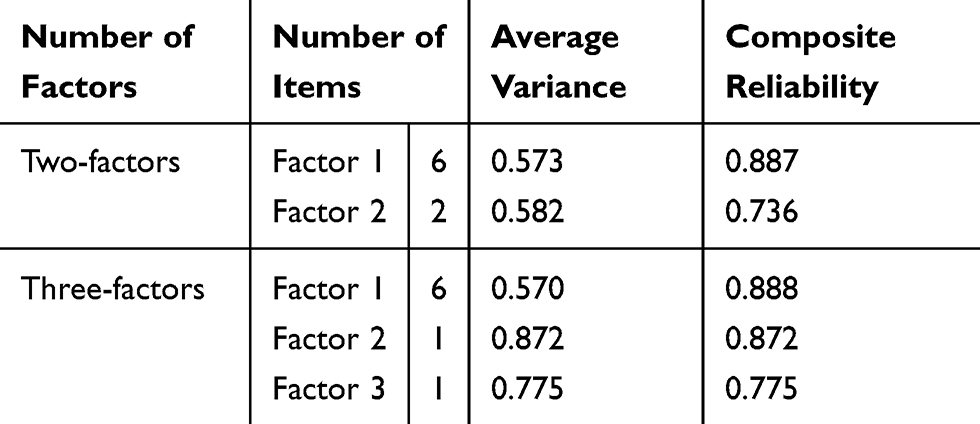 |
Table 5 Average Variance and Composite Reliability Indices of the DTSQ |
Average Variance and Composite Reliability Indices of the DTSQ
The reliability of the whole scale and subscales was computed based on the estimated parameters resulting from the confirmatory factorial analysis. Reliability estimations based on unequal weighting have been suggested as more appropriate reliability measure following a CFA;28 thus, composite reliability was measured in terms of weighted omega coefficients for the two-factors and three-factors model. Results showed acceptable weighted omega scores for all DTSQ subscales (Ωw≥0.70) for both models (Table 4).
Discussion
This study examined the factor structure and reliability of the DTSQ in Arabic speaking patients diagnosed with type 2 diabetes. Three models of DTSQ were tested using the confirmatory factor analysis method and the two-factor model emerged as the model of choice that best fit in the current study. The two-factors model applied equally well to patients on insulin and those on oral hypoglycemic agents. Likewise, construct reliability based on the formula by Fornell and Larcker29 was evaluated. The construct reliability estimates describe the variance captured by measurement errors as opposed to the variance attributable to the latent factors. A coefficient less than 0.50 indicates that the error variance is larger than the variance of the constructs. Our results revealed construct coefficients larger than 0.50 for both models. Whilst the X2 value for the goodness-of-fit index revealed a significant chi-square for the two- and three-factors model, this is more likely indicative of the larger sample size where sample size is an important determinant in assessing model fit.30
To our knowledge, this is the first study to confirm the construct validity of the DTSQ using confirmatory factor analysis of DTSQ in an Arabic speaking population. In line with Plowright et al's19 study, our findings support the conclusion that a two-factor model of DTSQ provides the best fit for the data. The main strength of this model is that it appears to be replicable across patients treated with insulin and patients treated with oral hypoglycemic medications, supporting the notion that the DTSQ is a robust measure to evaluate patient satisfaction with treatment among Arabic speaking patients with type 2 diabetes.
The reliability of the DTSQ was supported in terms of weighted omega reliability and construct reliability coefficient of the two-factors model. While the use of alpha Cronbach reliability coefficient is more popular than the coefficient of ΩW, the use of ΩW is more appropriate in the case of multidimensional instruments analyzed through structural equation modeling.31 This is because Cronbach alpha does not reflect the scale’s factorial structure underlying correlations between items. Our results on reliability of the DTSQ are satisfactory as these subscales show adequate psychometric properties in this population. Previous studies reported an alpha value of 0.782 to 0.0894 in all other languages reported in Plowright et al.19
The CFA supported the factorial validity of the DTSQ as the a priori hypothesized two-factor model revealed an acceptable model fit. The results, concurring with those reported in Bradley et al,21 suggest that the two-factor solution for DTSQ based on the perceived hypo–hyperglycemia and treatment satisfaction dimensions represents the best indices of fit. Although the two- and three-factor structure of the DTSQ was empirically supported, the two-factor solution for DTSQ based on the 2-items of perceived hyper–hypoglycemia and six-items satisfaction factor presented a better theoretical fit compared to the three-factor solution. Considering the low number of items per factor in the three-factors model, Davies et al32 suggested a factor solution with two items per factor can be more acceptable. In addition, that a three-model factor of the DTSQ has only one indicator for factor 3 suggests that this model is not testable.
Regarding measurement invariance, the results indicate that the dimensional structure underlying the DTSQ is invariant across gender and across patients treated with insulin or oral hypoglycemic medication. CFA showed that loading of latent variable in each item were above the recommended value of 0.30, except for the perceived hypoglycemia item. The negative correlation between factor 1 and factor 2 support the applied value of the two-factor model of the DTSQ to monitor patient’s satisfaction of treatment and frequency of hypo-hyper glycaemic complains. Monitoring patient’s experience of frequent hypo-hyper glycaemic episodes provide increased opportunity to tailor interventions to support adequate glycaemic control based on their individual profile.
Implications for Practice
The DTSQ may be valuable in diabetes care and research, although evaluating sensitivity to change in treatment will require further analysis. The rising burden of diabetes has become a global challenge, in particular for the Middle East and North Africa (MENA) regions.1 In this instance, measurement of treatment satisfaction instruments are important indicators of treatment compliance and glycemic control. Therefore, the Arabic version of the DTSQ can serve as an outcome measure to help nurses, as well as other healthcare professionals in identifying patients with low treatment satisfaction and those who are at higher risk for poor compliance with treatment.
Our findings confirm that the DTSQ is a valued instrument to explore the association between treatment satisfaction and the role of participant’s gender, type of treatment, diet, and glycemic control. Within known limitations and gaps in the literature, nurses, and other healthcare professionals working with Arabic speaking patients may find this tool useful for identification of high-risk patients and those in need for interventions to promote glycemic control. We argue that treatment satisfaction is a construct that would be measured in place of compliance (potentially as a predictor) rather than in conjunction with compliance as a standard part of diabetes care.
Finally, whilst the construct validity and internal reliability of the DTSQ have been confirmed in this study, further studies are needed to establish the sensitivity of the DTSQ to changes in treatment, and further studies are needed to confirm our findings in patients with type 1 diabetes. Even though results supported the a priori hypothesized two-factor structure of the DTSQ construct validity, conclusions regarding the scale’s construct validity should be based on more empirical findings that support the DTSQ theoretical presumptions. The sample was a convenience sample from one clinical setting in Amman. While this study included a large sample with a diverse population, it was limited to patients with type 2 diabetes. Lack of clarity on the rigor of the translation process of the tool into Arabic is a limitation and there is a need to replicate this study among people with a diagnosis of type I diabetes across other Arabic speaking countries. Irrespective of these limitations, our findings add to the body of knowledge on measures of diabetes outcomes worldwide.
Conclusion
In conclusion, we were able to replicate the three different models of the 8-item DTSQs (one factor, two factors, three factors) reported in previous studies. Confirmatory factor analysis was used to compare three different models of the DTSQ, and to investigate the invariance of the factor structure across patients treated with insulin and patients treated with oral hypoglycemic medications. A two-factor model with six items loading highly on Factor 1 and the two hypo/hyperglycemic loading in factor 2 provided the best fit to the data in the two samples (patients treated with insulin and patients treated with oral hypoglycaemic medications). Our results suggest a cross-cultural invariance of the factor structure of the DTSQ, as we were able to replicate the same factor structure using the Arabic translated version of the tool and using non-English speaking participants.
Abbreviations
DTSQ, Diabetes Treatment satisfaction Questionnaire; MENA, Middle East and North Africa Region; CFA, confirmatory factor analysis; ΩW, omega reliability coefficient; AIC, Akaike’s Information Criterion; CFI, The Comparative Fit Index; RMSEA, The Root Mean Square Error of Approximation; TLI, Tucker-Lewis coefficient.
Data Sharing Statement
The datasets used and/or analysed during the current study are available from the corresponding author on reasonable request.
Ethics Approval and Consent to Participate
Ethical approval for this study was received from the institutional review board of the National Institute for Diabetes Endocrinology and Genetics (Ethical approval number MS/9/57 dated 9th of January 2014). Written informed consent was obtained from all participants of the study.
Acknowledgments
The authors are grateful to participants and staff from the National Institute for Diabetes Endocrinology and Genetics for their cooperation, especially Professor Yousef Khader and Dr Dana Hiyasat for their assistance and support in the data collection.
Author Contributions
All authors made substantial contributions to the conception and design, acquisition of data, or analysis and interpretation of data; took part in drafting the article or revising it critically for important intellectual content; agreed to submit to the current journal; gave final approval of the version to be published; and agree to be accountable for all aspects of the work.
Disclosure
The authors have no funding or conflicts of interest to disclose. The authors of this paper have no affiliations with or involvement in any organization or entity with any financial interest, or non-financial interest in the subject matter or materials discussed in this manuscript.
References
1. Cho N, Shaw JE, Karuranga S, et al. IDF diabetes Atlas: global estimates of diabetes prevalence for 2017 and projections for 2045. Diabetes Res Clin Pract. 2018;138:271–281.
2. Majeed A, El-Sayed AA, Khoja T, Alshamsan R, Millett C, Rawaf S. Diabetes in the Middle-East and North Africa: an update. Diabetes Res Clin Pract. 2014;103(2):218–222. doi:10.1016/j.diabres.2013.11.008.
3. Garoushi S, Johnson MI, Tashani OA. Point prevalence of painful diabetic neuropathy in the Middle East and North Africa region: a systematic review with meta-analysis. Libyan J Med Sci. 2018;2(3):85.
4. Richmond M. An investigation of the integration of education and mental health treatment into the care of diabetes in Syrian refugee women. Independent Study Project (ISP) Collection. Paper 2181. 2015. Available from: http://digitalcollections.sit.edu/isp_collection/2181.
5. George Bakris M, Blonde MD, Andrew JM, Boulton M. Standards of medical care in diabetes-2015. Diabetes Care J Clin Appl Res Educ. 2015;38:S1–99.
6. Whitehead LC, Crowe MT, Carter JD, et al. A nurse‐led education and cognitive behaviour therapy‐based intervention among adults with uncontrolled type 2 diabetes: a randomised controlled trial. J Eval Clin Pract. 2017;23(4):821–829. doi:10.1016/j.ijnurstu.2018.10.002.
7. Jamous RM, Sweileh WM, Abu-Taha AS, Sawalha AF, Sa’ed HZ, Morisky DE. Adherence and satisfaction with oral hypoglycemic medications: a pilot study in Palestine. Int J Clin Pharm. 2011;33(6):942–948. doi:10.1007/s11096-011-9561-7.
8. Abu Sheikh B, Arabiat DH, Holmes SL, et al. Correlates of treatment satisfaction and well‐being among patients with type II diabetes. Int Nurs Rev. 2018;65(1):114–121. doi:10.1111/inr.12358.
9. Alcubierre N, Rubinat E, Traveset A, et al. A prospective cross-sectional study on quality of life and treatment satisfaction in type 2 diabetic patients with retinopathy without other major late diabetic complications. Health Qual Life Outcomes. 2014;12(1):131.
10. Debono M, Cachia E. The impact of diabetes on psychological well being and quality of life. The role of patient education. Psychol Health Med. 2007;12(5):545–555. doi:10.1080/13548500701235740.
11. Nicolucci A, Cucinotta D, Squatrito S, et al.; QuoLITy Study Group. Clinical and socio-economic correlates of quality of life and treatment satisfaction in patients with type 2 diabetes. Nutr Metab Cardiovasc Dis. 2009;19(1):45–53. doi:10.1016/j.numecd.2007.12.005.
12. Takase T, Nakamura A, Yamamoto C, et al. Improvement in treatment satisfaction after switching from liraglutide to dulaglutide in patients with type 2 diabetes: a randomized controlled trial. J Diabetes Investig. 2019;10(3):699–705. doi:10.1111/jdi.12906
13. Al Shahrani A, Baraja M. Patient satisfaction and it’s relation to diabetic control in a primary care setting. J Family Med Prim Care. 2014;3(1):5.
14. Boels AM, Vos RC, Hermans TG, et al. What determines treatment satisfaction of type 2 diabetes patients on insulin therapy? An observational study in eight European countries. A Utopian Future? 2018;57.
15. Bassett J, Adelman A, Gabbay R, Aňel-Tiangco RM. Relationship between depression and treatment satisfaction among patients with type 2 diabetes. J Diabetes Metab. 2012;3(7).
16. Holmes-Truscott E, Skovlund SE, Hendrieckx C, Pouwer F, Peyrot M, Speight J. Assessing the perceived impact of diabetes on quality of life: psychometric validation of the DAWN2 impact of diabetes profile in the second diabetes MILES–Australia (MILES-2) survey. Diabetes Res Clin Pract. 2019;150:253–263. doi:10.1016/j.diabres.2019.03.020.
17. Wilbur K, Al Hammaq AO. Validation of an arabic version of the diabetes treatment satisfaction questionnaire in Qatar. Diabetes Res Clin Pract. 2016;113:53–59. doi:10.1016/j.diabres.2015.12.005
18. Bradley CL. The diabetes treatment satisfaction questionnaire: DTSQ. In: Handbook of Psychology and Diabetes: A Guide to Psychological Measurement in Diabetes Research and Practice. Vol. 111. 1994:132.
19. Plowright R, Witthaus E, Bradley C. Psychometric evaluation of diabetes treatment satisfaction questionnaire in 8 languages. Proc Br Psychol Soc. 2000;8(2):43.
20. Bradley C, Plowright R, Stewart J, Valentine J, Witthaus E. The diabetes treatment satisfaction questionnaire change version (DTSQc) evaluated in insulin glargine trials shows greater responsiveness to improvements than the original DTSQ. Health Qual Life Outcomes. 2007;5(1):57. doi:10.1186/1477-7525-5-57.
21. Bradley C, Plowright R, Stewart J, Witthaus E. Diabetes treatment satisfaction questionnaire (change) in English and German evaluated in insulin glargine trials. Diabetologia. 2000;43(1):A196.
22. Bradley C, Lewis KS. Measures of psychological well‐being and treatment satisfaction developed from the responses of people with tablet‐treated diabetes. Diabet Med. 1990;7(5):445–451.
23. Saatci E, Tahmiscioglu G, Bozdemir N, Akpinar E, Ozcan S, Kurdak H. The well-being and treatment satisfaction of diabetic patients in primary care. Health Qual Life Outcomes. 2010;8(1):67. doi:10.1186/1477-7525-8-67
24. Satorra A, Bentler P. Scaling corrections for statistics in covariance structure analysis. 1988. Available from: https://escholarship.org/content/qt3141h70c/qt3141h70c.pdf.
25. Hu LT, Bentler PM. Cutoff criteria for fit indexes in covariance structure analysis: conventional criteria versus new alternatives. Struct Equ Modeling. 1999;6(1):1–55. doi:10.1080/10705519909540118
26. Bentler PM, Wu EJ. EQS 6.1 for windows. Encino, CA: Multivariate Software INC; 2005. Available from: http://www.mvsoft.com/pub/EQS%2061%20QuickStart.pdf.
27. Cheung GW, Rensvold RB. Evaluating goodness-of-fit indexes for testing measurement invariance. Struct Equ Modeling. 2002;9(2):233–255. doi:10.1207/S15328007SEM0902_5
28. Bacon DR, Sauer PL, Young M. Composite reliability in structural equations modeling. Educ Psychol Meas. 1995;55(3):394–406. doi:10.1177/0013164495055003003
29. Fornell C, Larcker DF. Evaluating structural equation models with unobservable variables and measurement error. J Mark Res. 1981;18(1):39–50.
30. Marsh HW, Hau KT, Balla JR, Grayson D. Is more ever too much? The number of indicators per factor in confirmatory factor analysis. Multivariate Behav Res. 1998;33(2):181–220. doi:10.1207/s15327906mbr3302_1.
31. Edwards JR. The fallacy of formative measurement. Organ Res Methods. 2011;14(2):370–388.
32. Davies KA, Lane AM, Devonport TJ, Scott JA. Validity and reliability of a brief emotional intelligence scale (BEIS-10). J Individ Differ. 2010. doi:10.1027/1614-0001/a000028.
 © 2020 The Author(s). This work is published and licensed by Dove Medical Press Limited. The
full terms of this license are available at https://www.dovepress.com/terms
and incorporate the Creative Commons Attribution
- Non Commercial (unported, 3.0) License.
By accessing the work you hereby accept the Terms. Non-commercial uses of the work are permitted
without any further permission from Dove Medical Press Limited, provided the work is properly
attributed. For permission for commercial use of this work, please see paragraphs 4.2 and 5 of our Terms.
© 2020 The Author(s). This work is published and licensed by Dove Medical Press Limited. The
full terms of this license are available at https://www.dovepress.com/terms
and incorporate the Creative Commons Attribution
- Non Commercial (unported, 3.0) License.
By accessing the work you hereby accept the Terms. Non-commercial uses of the work are permitted
without any further permission from Dove Medical Press Limited, provided the work is properly
attributed. For permission for commercial use of this work, please see paragraphs 4.2 and 5 of our Terms.