Back to Journals » International Journal of General Medicine » Volume 15
Comprehensive Characterization of Transforming Growth Factor Beta Receptor 1 in Stomach Adenocarcinoma Identifies a Prognostic Signature for Predicting Clinical Outcomes and Immune Infiltrates
Authors He Y, Zhang H, Zhang Y, Wang P ![]() , Zhu K, Ba Y
, Zhu K, Ba Y
Received 20 December 2021
Accepted for publication 8 March 2022
Published 25 March 2022 Volume 2022:15 Pages 3375—3391
DOI https://doi.org/10.2147/IJGM.S353879
Checked for plagiarism Yes
Review by Single anonymous peer review
Peer reviewer comments 3
Editor who approved publication: Dr Scott Fraser
Yi He,1,* Haiyang Zhang,1,* Yan Zhang,1,2,* Peiyun Wang,1 Kegan Zhu,1 Yi Ba1
1Tianjin Medical University Cancer Institute and Hospital, National Clinical Research Center for Cancer, Tianjin’s Clinical Research Center for Cancer, Key Laboratory of Cancer Prevention and Therapy, Tianjin, 300060, People’s Republic of China; 2Department of Gastroenterology, Tianjin Haihe Hospital, Tianjin, 300350, People’s Republic of China
*These authors contributed equally to this work
Correspondence: Yi Ba, Email [email protected]
Background: Stomach adenocarcinoma (STAD) ranks as the third leading cause of cancer death worldwide. TGF‑β receptor 1 (TGFBR1), serving important roles in the TGF‑β family, the mechanisms whereby TGFBR1 governs tumor progression, immune cell infiltration in STAD remains unintelligible.
Methods: We used the TCGA, GEPIA, and HPA databases to explore TGFBR1 expression in STAD, the correlation between TGFBR1 expression and the clinical features. A receiver operating characteristic (ROC) curve and nomogram were constructed, and LASSO (the Least Absolute Shrinkage and Selection Operator)-selected features were used to build the TGFBR1 prognostic signature. GSEA is used to find the potential mechanism of TGFBR1 to promote the malignant process of STAD. We explored the influence of the TGFBR1 on the immune microenvironment of STAD through the TIMER2.0 and GEPIA database.
Results: In our study, TGFBR1 expression was significantly elevated in STAD and positively co-expression with pathologic stage, lymph node metastases (LNM) stage and histopathological grade. Nine factors with non-zero coefficients were identified by LASSO-selected features. Survival analysis revealed that patients with high TGFBR1 had shorter OS, FP, and PPS. Multivariate Cox analysis revealed that TGFBR1 was an independent prognostic factor for OS in STAD. The ROC analysis suggested that high diagnostic value with the AUC of TGFBR1 was 0.739. GSEA revealed that high TGFBR1 expression was correlated with pathway in cancer, MAPK signaling pathway, NOTCH signaling pathway, and VEGF-C production. ssGSEA showed that TGFBR1 is correlated with NK cells, Tem and Th17 cells. Furthermore, elevated TGFBR1 expression was found to be significantly correlated with several immune checkpoint and immune markers associated with immune cell subsets.
Conclusion: In summary, TGFBR1 could be a prognostic biomarker and an important regulator of immune cell infiltration in STAD. The present study revealed the probable underlying molecular mechanisms of TGFBR1 in STAD and provided a potential target for improving the prognosis.
Keywords: TGFBR1, STAD, prognosis, immune infiltration, bioinformatics
Introduction
Stomach adenocarcinoma (STAD) is a common cancer and ranks as the third leading cause of cancer death worldwide.1,2 Despite improvements in STAD treatment, prognosis of patients with advanced STAD remains poor.3 Importantly, there are neither effective prognostic biomarkers nor validated predictive for this lethal tumor.4 Tumorigenesis is a complicated process involving multiple factor sand stages,5 among which the linked gene and immune cells play an essential regulatory role.6,7 Thus, it is urgent to investigate the targeted molecular mechanism and explore relative signaling pathways for cancer treatment. Mechanisms and markers of immunity are also involved in the progression of STAD,7 and immune-related therapy provides a hopeful option for STAD.6,7 Besides, the developments of the novel molecular and high effective markers are in its infancy. Thus, it’s necessary to identify novel immune-related markers to realize early diagnosis and treatment in STAD.
TGF‑β receptor 1 (TGFBR1), serving significant roles in the TGF‑β family, and have vital influence on many biological processes, including cell growth, reproductive capacity, and immunological reactions.8,9 TGF‑β signaling plays an important role in both the growth and differentiation of tumor cells and the functional regulation of interstitial.10,11 TGF-β binds to TGFBR2, forming a complex with TGFΒR1, which then phosphorylates R-SMADs, enabling the formation of a complex with SMAD4 that could enter the nucleus to regulate gene expression.6,12,13 It has been reported that TGFBR1 is an irreplaceable downstream molecule of TGFB1 that participates in cell cycle, such as differentiation, fission, and death.14,15 It’s observed that TGFBR1 expression taking part in the Linc00462/miR-665/TGFBR1-TGFBR2/SMAD2/3 pathway influences pancreatic cancer invasiveness.16 In lung cancer, TGFBR1 take part in TGFBR1- EGFR-CTNNB1-CDH1 axis in regulating the migration and invasion.17 Cells that lack TGFBR1 do not respond to TGF‑β1, which further affects the TGF‑β signaling pathway.18,19 It’s reported that some inhibitors of TGFBR1 had been join in Phase 1 clinical trials in patients with advanced tumor, such as galunisertib.20,21
Lots of evidence demonstrated that the tumor microenvironment (TME) provide supports for tumor growth and regulates immune response.21,22 TGFBR1 is a potential regulator of the TME, playing a significant role in tumor immune evasion, resulting in progression and metastasis of cancer.21,23 TGF‑β signaling pathway operates as a major suppressor of the adaptive and innate immune responses during tumor progression.6,14 Mutations in TGFBR1 is frequently observed, the loss of function mutations provide evidence for the tumor suppressor role of the TGF-β signaling pathway in tumor.6 TGFBR1 mediated phosphorylation of ILK and its subsequent binding to CD103, thus initiating inside-out signaling leading to activation of the integrin and strengthening of CD103-E-cadherin adhesion.24 The existing body of research have shown a vital role for TGF‑β signals in regulation of NK cells,18,25 T-Lymphocyte Accumulation and Antitumor Activity24 and safeguarding specific Treg cell functions.26 However, the mechanisms whereby TGFBR1 regulates tumor progression, immune infiltration, and the prognosis of TGFBR1 expression and its correlation with TME in STAD remains unintelligible.
Here we investigated the TGFBR1 expression and its diagnostic and prognostic value in STAD. Then, gene set enrichment analysis (GSEA) of the STAD data set from TCGA was applied to evaluate the underlying mechanisms of TGFBR1, then LASSO-selected features were used to build the TGFBR1 prognostic signature and the correlation between TGFBR1 expression and tumor infiltrating immune cells (TIILs), immune checkpoint in the TME were assessed. In summary, TGFBR1 could be a prognostic biomarker and an important regulator of immune cell infiltration in STAD. The present study revealed the probable underlying mechanisms of TGFBR1 in STAD and provided a potential target for improving the prognosis.
Methods
Sample Data Sets
All raw data of STAD, with transcriptome RNA-seq data and the corresponding clinical information, were downloaded from TCGA database (https://portal.gdc.cancer.gov/repository).27 Performing the differential expression analysis in TCGA-STAD samples according to TGFBR1 expression, we determined the DEmRNAs with thresholds of |logFC| >1.5 and adj p <0.05. Next, we used the “Similar Gene Detection” module of GEPIA2 to obtain the top 100 TGFBR1-correlated targeting genes based on the datasets of all STAD-TCGA tumor tissues. Then, we conduct an intersection analysis to compare the TGFBR1-binding and interacted genes through a website (http://bioinformatics.psb.ugent.be/webtools/Venn/).
GEPIA Database Analysis
GEPIA is an online database which facilitates the standardized analysis of RNA-seq data in the TCGA and GTEx data sets (http://gepia.cancer-pku.cn/index.html).28,29 We therefore employed this database to assess the link between TGFBR1 expression and patient prognosis in STAD, and we further assessed the link between TGFBR1 expression and the expression of markers associated with immune cell infiltration of tumors.
Kaplan–Meier Plotter Analysis
The Kaplan–Meier plotter offers a means of readily exploring the impact of a wide array of genes on patient survival in 21 different types of cancer.30 We explore the association between TGFBR1 expression and outcome therefore through this database in STAD (http://kmplot.com/analysis/).
TIMER Database Analysis
TIMER2.0 (http://timer.comp-genomics.org/) is a database designed for analyzing immune cell infiltrates in multiple cancers. This database employs pathological examination-validated statistical methodology in order to estimate tumor immune infiltration by monocyte, neutrophils, M1/M2 macrophages, TMA, dendritic cells, B cells and CD4/CD8 T cells so on.31,32 We initially employed this database to assess differences in TGFBR1 expression levels in particular tumor types using the TIMER2.0 database, and we then explored the relationship between this TGFBR1 expression and the degree of infiltration by immune cell subsets. We further conducted Kaplan–Meier curve analyses to explore the differences of survival as a function of gene expression or immune cell infiltration. Finally, we assessed how TGFBR1 expression correlated with the expression of immune infiltrating cell subset markers.
Constructing and Validating the Risk-Score System
We conduct an intersection analysis to compare the TGFBR1-binding and interacted genes through a website (http://bioinformatics.psb.ugent.be/webtools/Venn/), and 20 genes were achieved. Least Absolute Shrinkage and Selection Operator (LASSO)-regression model was performed using the “glmnet” package.33,34 Subsequently, the identified genes were integrated into a risk signature, and a risk-score system was established according to the following formula, based on the normalized gene expression values and their coefficients. The normalized gene expression levels were calculated by TMM algorithm by “edgeR” package.35 The risk score was calculated for each patient with STAD in this study, and the distribution and receiver operating characteristic (ROC) curve were plotted using “timeROC” package.33,35 According to the median risk score in the training set, patients were divided into high-or low-risk groups. In addition, the relationships between risk scores and OS rates in different groups and subgroups were evaluated by Kaplan–Meier survival analysis and Log rank testing.
Gene Set Enrichment Analysis (GSEA)
GSEA was conducted to identify potential biological processes and pathways in high-risk groups in the “cluster Profiler” R package.36,37 The c2.cp.v7.2.symbols.gmt (KEGG) and c5.all.v7.2.symbols.gmt (Gene ontology) were downloaded from the Molecular Signatures Database (MSigDB). Gene sets with |NES|>1, NOM p<0.05 and FDR<0.05 were considered as statistical significance.
Immune Cells Infiltration of ssGSEA
Immune infiltration analysis of STAD was performed by single-sample gene set enrichment analysis (ssGSEA) in the “GSVA” R package,38 and the infiltration levels of 24 immune cell types39 were quantified from gene expression profiles. In addition, a Spearman correlation was performed to analyze the relationship of immune cells infiltration with TGFBR1 expression and Wilcoxon rank sum test was conducted to analyze the correlation between infiltration level of immune cells and TGFBR1.
Statistical Analysis
The least absolute shrinkage and selection operator (LASSO) regression algorithm for feature selection, using 10-fold cross-validation, the above analysis uses the R software package glmnet.34,40,41 For Kaplan–Meier curves, p-values, and hazard ratio (HR) with 95% confidence interval (CI) were generated by Log rank tests and univariate Cox proportional hazards regression. All analytical methods above and R packages were performed using R software version 4.0.3 (The R Foundation for Statistical Computing, 2020). p < 0.05 was considered as statistically significant.
All figure construction in this study was conducted by using R package software (version 4.1.1). Univariate and multivariate Cox regression model were performed by using “survival”,“survminer” packages. Wilcox test was used to determine statistical differences of categorical variables. Genes included in the multivariate analysis were selected through stepwise Cox regression analysis with both directions. Bootstrap method was used to perform internal validation in the TCGA dataset.
Results
TGFBR1 Levels are Increased in STAD
We used Timer database to analyze the TGFBR1 expression in tumor tissues, and our results showed that the expression level of TGFBR1 was increased in a variety of tumors, including STAD compared with those corresponding NT tissues (Figure 1A). At the same time, we investigated the expression of TGFBR1 in TCGA database by GEPIA. The results suggested that TGFBR1 was elevated in STAD compared with the corresponding normal tissues (Figure 1B and C). Furthermore, IHC results of normal tissues and tumor tissues were obtained from the HPA database (Figure 1D). The results suggested that the level of TGFBR1 protein increased in STAD compared with the corresponding normal stomach tissue. Collectively, these results revealed that TGFBR1 is consistently upregulated in STAD tissue compared with corresponding normal cells and tissue.
 |
Figure 1 TGFBR1 levels are increased in STAD. (A) TGFBR1 expression levels in different types of cancers from TCGA datasets in TIMER. (B) Expression of TGFBR1 based on GEPIA2 database in STAD. (C) Differential expression of TGFBR1 in different disease state (Tumor or Normal). (D) IHC of normal stomach tissue and STAD tissue obtained from the HPA database. * <0.05, **P <0.01, ***P < 0.001. |
High TGFBR1 Expression is Correlated with Clinicopathologic Features in Patients with STAD
To clarify the correlation between the overexpression of TGFBR1 and the clinical, pathological, and molecular characteristics. Using the GEPIA2 dataset, we compared the mRNA expression of TGFBR1 between STAD with different pathologic stage (Figure 2A). The results indicated that increased expression of TGFBR1 associated significantly with different pathologic stage (P < 0.05). The characteristics of 375 STAD patients including clinical and gene expression data were achieved from TCGA database (Table S1). Based on the mean value of TGFBR1 expression, the patients were divided into high- and low-TGFBR1 expression groups, then we conducted Wilcoxon signed-rank test and logistic regression to analyze the correlation between TGFBR1 expression and clinical characteristics. As shown in Table S1, Figure S1B–D, the expression level of TGFBR1 was correlated with the pathologic stage, T stage, N stage, LNN, and degree of Histologic grade in STAD. Therefore, we further explore that a high level of TGFBR1 may be associated with a poor prognosis of STAD patients.
 |
Figure 2 Identification of the TGFBR1-related prognostic signature. (A) The volcano plots describe DEGs (|log2 fold change| > 1.5 and adjusted p value < 0.05) between the expression of TGFBR1-high and TGFBR1-low in STAD samples. (B) An intersection analysis of the DEGs and TGFBR1-correlated genes was conducted. (C) STAD patients’ survival status and risk score distribution in the TCGA database. (D) Kaplan–Meier curves of OS between high-risk and low-risk groups in the TCGA database. (E) ROC curves predict the 1-, 3- and 5-year OS in the TCGA database according to LASSO regression in TCGA database. |
Identification of theTGFBR1 Related Prognostic Signature
Performing the differential expression analysis in TCGA-STAD samples according to TGFBR1 expression, we determined the 470 DEGs with thresholds of |logFC| >1.5 and adj p <0.05. Volcano plots visually displaying the distribution of DEmRNAs were generated (Figure 2A). Next, we obtain the top 100 TGFBR1-correlated targeting genes based on the GEPIA2 datasets (Table S2). Then, we conduct an intersection analysis to compare the TGFBR1-binding and interacted genes through a website (http://bioinformatics.psb.ugent.be/webtools/Venn/) (Figure 2B, Table S3). To stratify the clinical outcomes of patients with the TGFBR1 readily and efficiently, we applied the LASSO Cox regression algorithm to the 20 factors and TGFBR1 in the TCGA dataset. A total of 9 factors with non-zero coefficients were identified. These LASSO-selected features were used to build the TGFBR1 prognostic signature (Figures 2 and S2). The corresponding risk scores were computed, according to the following formula:
Risk score = (−0.2914) *DIXDC1+ (0.1113) *STON1-GTF2A1L+(0.3092) *FERMT2+(−0.0146) *BHMT2+(0.1798) *ABCC9+(0.068) *MSRB3+(−0.1007) *SYNC+(−0.0891) *SORBS1+(0.0828) *TGFBR1. We divided patients in TCGA datasets into high-risk and low-risk groups using their respective median risk score as the cutoff. Kaplan–Meier survival analysis determined that patients with high-risk scores had poorer OS than those with low-risk scores (p < 0.001, HR = 1.579, 95% CI: 1.134, 2.198; Figure 2C and D). The area under curve (AUC) for 1-year, 3-year and 5-year time-dependent ROC were 0.645 and 0.639, 0.669 respectively (Figure 2E).
High Expression of the TGFBR1 Related Prognostic Signature
The survival analysis of the TCGA-STAD dataset demonstrated that high TGFBR1 expression was correlated with poor OS (P = 0.039) (Figure 3A). Next, we conduct Kaplan–Meier survival analysis by KM Plotter. The result of survival analysis represented that high TGFBR1 expression was associated with poor OS (206943_at, P = 5.7e-07) and (224793_s_at, P=7.3e-07) (Figure 3B and C), poor FP (206943_at, P = 4e-04) and (224793_s_at, P=5.5e-12) (Figure 3D and E), and poor PPS (206943_at, P = 6e-09) and (224793_s_at, P=0.00011) (Figure 3F and G). Patients with TGFBR1 overexpression have a shorter overall survival time, and the results are consistent with the TCGA databases. Then, the receiver operating characteristic (ROC) curve was carried out to analyze the effectiveness of TGFBR1 expression in normal samples of GTEx combined adjacent STAD tissues and STAD samples. AUC of TGFBR1 was 0.739, CI (0.629, 0.848), which suggested high diagnostic value (Figure 4A). Then, the nomogram used age, T, N, M classification, pathologic stage, primary therapy outcome, histologic grade and TGFBR1 to predict the 1, 3, 5-year OS in the TCGA-STAD (Figure 4B). Univariate and multivariate analyses were performed to explore whether TGFBR1 is an independent prognostic factor affecting the prognosis of STAD. Univariate Cox analysis showed that high TGFBR1 expression was significantly correlated with poor OS (hazard ratio [HR] = 1.645, 95% CI = 1.179−2.295, P=0.003 (Table S4 and Figure 5A). Moreover, multivariate regression analysis further verified that TGFBR1 expression was an independent prognostic factor for OS in patients with STAD (HR = 1.733, 95% CI =1.165−2.578, P=0.007) (Table S4 and Figure 5B). The univariate and multivariate analyses results revealed that the upregulation of TGFBR1 could be used as a prognostic factor for STAD. Hence, the results suggested that TGFBR1, as a prognostic factor, its upregulation can significantly affect the prognosis of patients with STAD.
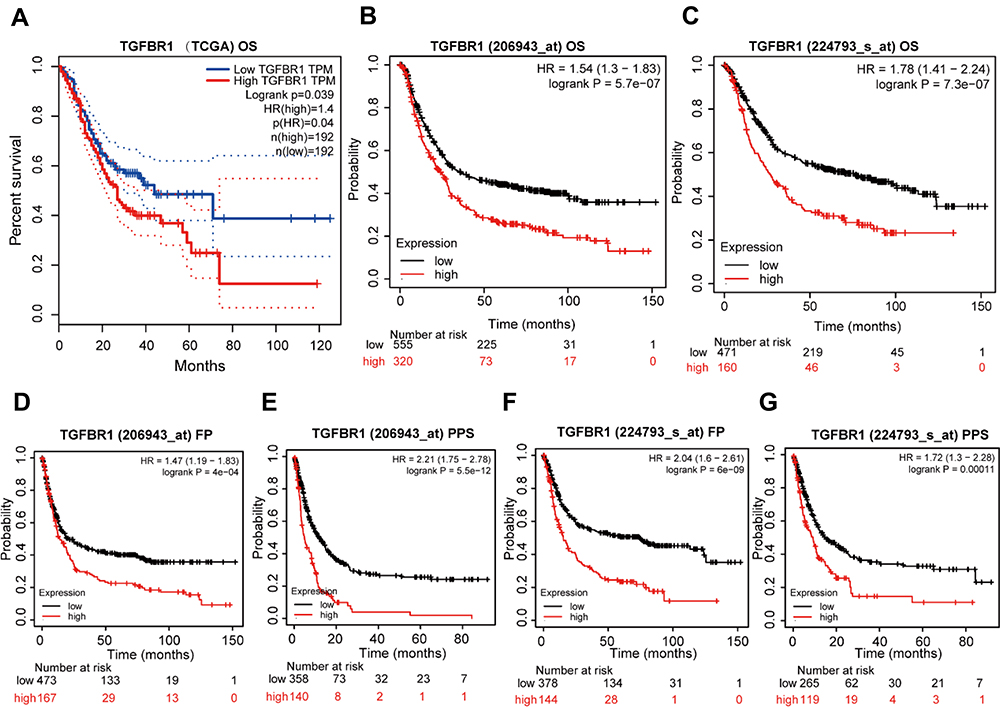 |
Figure 3 High TGFBR1 Expression indicated a poor prognosis for STAD. (A) The survival analysis of overall survival (OS) of TCGA-STAD database. (B and C) Kaplan–Meier survival analysis of OS. (D and E). Kaplan–Meier survival analysis of free progression (FP). (F and G). Kaplan–Meier survival analysis of post progression survival (PPS). |
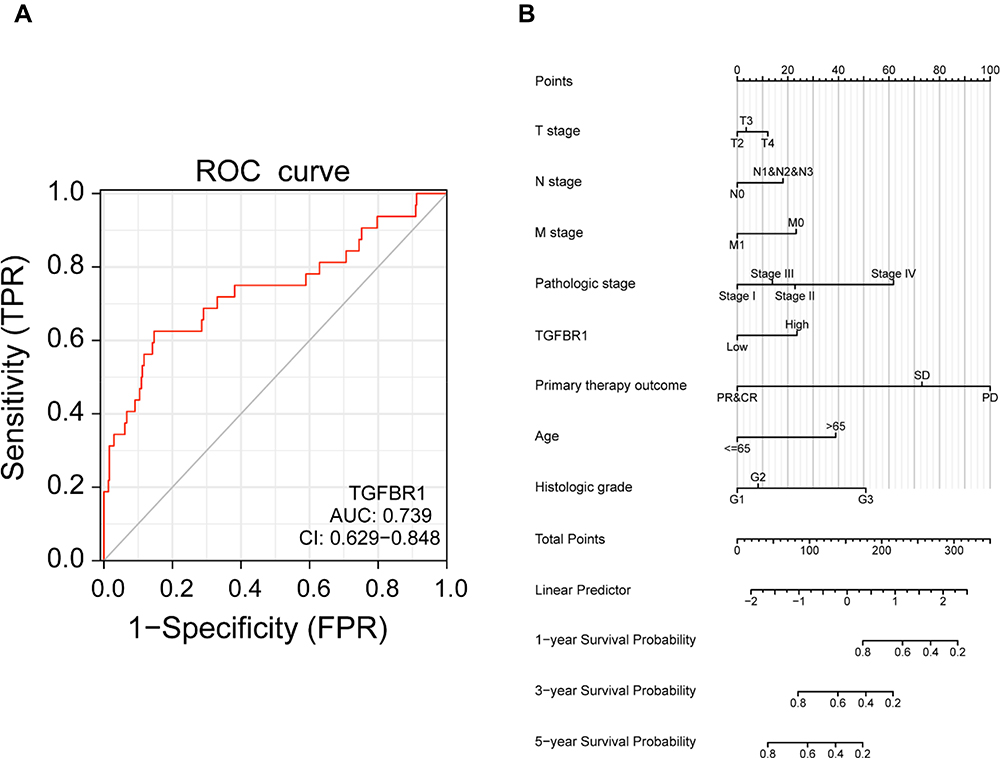 |
Figure 4 (A) ROC curve for TGFBR1 in normal samples of GTEx combined adjacent STAD tissues and STAD samples. (B) A nomogram for predicting probability of patients with 1-, 3- and 5-year OS. |
 |
Figure 5 (A) Forest plot of the univariate Cox regression analysis in TCGA-STAD. (B) Forest plot of the multivariate Cox regression analysis in TCGA-STAD. The bold p value (<0.05) in figures has statistical significance. |
TGFBR1-Related Signaling Pathways Based on GSEA
From the above results, we can know that TGFBR1 plays an important role in the tumorigenesis of STAD, but the specific molecular mechanism that leads to the poor prognosis of STAD is still unclear. To reveal the mechanism of TGFBR1, GSEA be used to evaluate the potential signaling pathway of TGFBR1 in STAD. We found some signaling pathways and biological processes that may be related to the effect of TGFBR1 on STAD progression, including pathway in cancer, MAPK signaling pathway, NOTCH signaling pathway, focal adhesion, and VEGF-C production (Figure 6A–F). The result further illustrates the complexity of the mechanism of TGFBR1 in STAD and it also clarifies the potential biological pathway regulation mechanism that TGFBR1 may participate in the regulation of STAD.
 |
Figure 6 The GSEA analysis results of TCGA RNA-seq data. (A–C) TGFBR1-related signaling pathways in c2.cp.v7.2.symbols.gmt. (D–F) TGFBR1-related signaling pathways in c5.all.v7.2.symbols.gmt (Gene ontology). |
Relationship Between TGFBR1 Expression and Tumor-Infiltrating Immune Cells
Tumor immune infiltration is an important factor in neoplasm progress and significantly influences the survival probability of tumor patients. Using the TIMER database, we analyze the relationship between expression of TGFBR1 and immune cell infiltration (Figure 7A). The results showed that the expression level of TGFBR1 was positively correlated with the infiltration levels of CD4+ T cells, CD8+ T cells, Macrophages, Neutrophils and Myeloid dendritic cells. This suggests that TGFBR1 may be a potential factor affecting the immune microenvironment of STAD. We also analyze the OS between expression of TGFBR1 and immune cell infiltration level through Timer database (Figure 7B). The results showed that the patient with higher TGFBR1 expression and lower CD8+ T cells infiltration level could be had poor prognosis (p<0.05). In high TGFBR1 expression group, the patient with higher Macrophage infiltration level could be have poor prognosis (p<0.05). We further explored the relationship between TGFBR1 expression and infiltration level of 24 immune cells quantified by ssGSEA in STAD through Spearman correlation (Figures 8A and S3). The results showed that high TGFBR1 expression was significantly positively correlated with infiltration levels of natural killer (NK) cells and Tem cells and negatively correlated with infiltration levels of Th17 cells (Figure 8B–D). Collectively, the above results demonstrated that the expression level of TGFBR1 is positively correlated with the level of tumor immune cell infiltration.
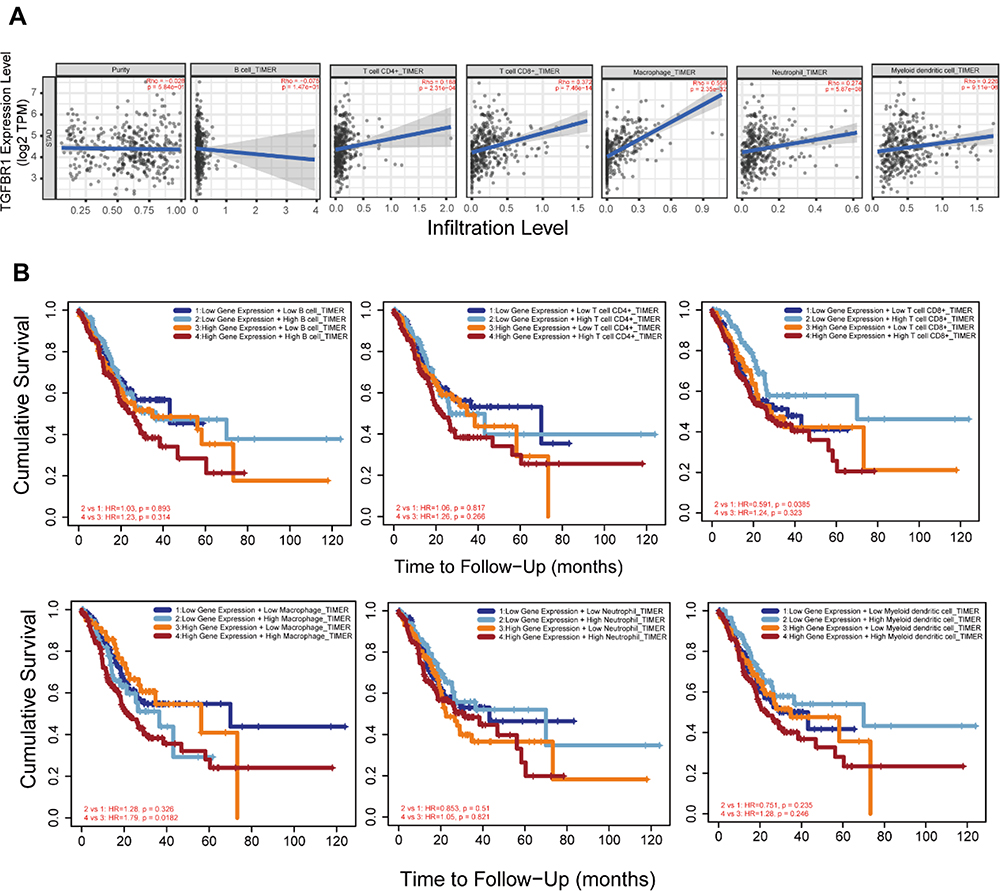 |
Figure 7 (A) TGFBR1 expression is correlated with the level of immune infiltration based on TIMER2 database in STAD. (B) Kaplan–Meier plots of immune infiltration and TGFBR1 expression levels based on TIMER2 database in STAD. |
 |
Figure 8 Immune cell infiltration analysis of TGFBR1 in the TCGA-STAD. (A) The forest plot shows the correlation between TGFBR1 expression level and 24 immune cells. (B) The correlation between TGFBR1 expression and NK cells. (C) The correlation between TGFBR1 expression and Tem. (D) The correlation between TGFBR1 expression and Th17 cells. Abbreviations: Tcm, T central memory; Tem, T effector memory; Tgd, T gamma delta; Tfh, T follicular helper; NK, natural killer; pDC, plasmacytoid dendritic cells. |
Assessment of the Correlation Between TGFBR1 and Immune Marker Expression
We next further explored the link between TGFBR1 expression and levels of immune cell infiltration based on sets of immunological markers in STAD using the TIMER and GEPIA database. Especially, we assessed the correlation between TGFBR1 expression and levels of parkers for cell subsets including CD8+ T cells, total T cells, B cells, monocytes, TAMs, M1 and M2 macrophages, neutrophils, NK cells, DCs, Th1 cells, Th2 cells, Tfh cells, Th17 cells, Tregs and exhausted T cells. We adjusted these results based on tumor purity, revealing a significant correlation between TGFBR1 expression and CD8+T cell markers (CD8A, CD8B), B cell marker (CD19), T cell (general) markers (CD2, CD3E), monocyte markers (CD86, CSF1R), TAM markers (CCL2, IL10, CD68), M1 macrophage markers (PTGS2), M2 macrophage markers (CD163, VSIG4, MS4A4A), neutrophils markers (CCR7, ITGAM), NK cell markers (KIR2DL1, KIR2DS4, KIR3DL1, KIR3DL2), Dendritic cell markers (CD1C, ITGAX, NRP1), Th1 markers (STAT1, STAT4, TBX21), Th2 markers (STAT5A, STAT6), Tfh markers (BCL6), Th17 markers (IL17A, STAT3), T cell exhaustion markers (HAVCR2, PDCD1) and Treg markers (CCR8, FOXP3, STAT5B, TGFB1) in STAD (Table S5). TGFBR1 expression was related to that of the majority of monocyte, TAM, M1 and M2 macrophage markers in STAD (Table 1). It was significantly correlated with monocyte markers (CD86, CSF1R), TAM markers (CCL2, IL10), M1 macrophage markers (PTGS2) and M2 macrophage markers (CD163, VSIG4, MS4A4A) in STAD (P<0.05; Figure 9A–D). Thus, we further evaluate the relationship between TGFBR1 expression and these markers in STAD through the GEPIA2 database revealing similar correlations in TIMER2 (Table 1). The result suggests that TGFBR1 may be capable of regulating the polarization of macrophages in STAD. Elevated TGFBR1 expression is also associated with increased NK cell infiltration in STAD, and consistent with this, the NK cell markers KIR2DL1, KIR2DS4, KIR3DL1 and KIR3DL2 were correlated with the expression of TGFBR1 expression. We further observed that there was a significant correlation between TGFBR1 and markers of Tregs and exhausted T cells including CCR8, FOXP3, STAT5B, TGFB, HAVCR2, PDCD1 (Table 1), indicating that TGFBR1 may play a role in immune escape in STAD, although further work will be necessary to confirm the underlying mechanisms. In addition, we also explored the relationship between TGFBR1 and the 15 Immune checkpoint (10 proteins from B7 family and 5 proteins from CD28 family) through GEPIA2. As shown in Figures 10A–F and S4, the TGFBR1 expression level is positively correlated with the expression levels of CD86, CD276, PDCD1LG2, C10orf54, CTLA4 and NCR3LG1 in STAD. Collectively, the above results demonstrated that the expression level of TGFBR1 is positively correlated with the level of tumor immune cell infiltration, indicating that TGFBR1 may play a vital role in immune escape in STAD, while further work will be needed to confirm the mechanisms.
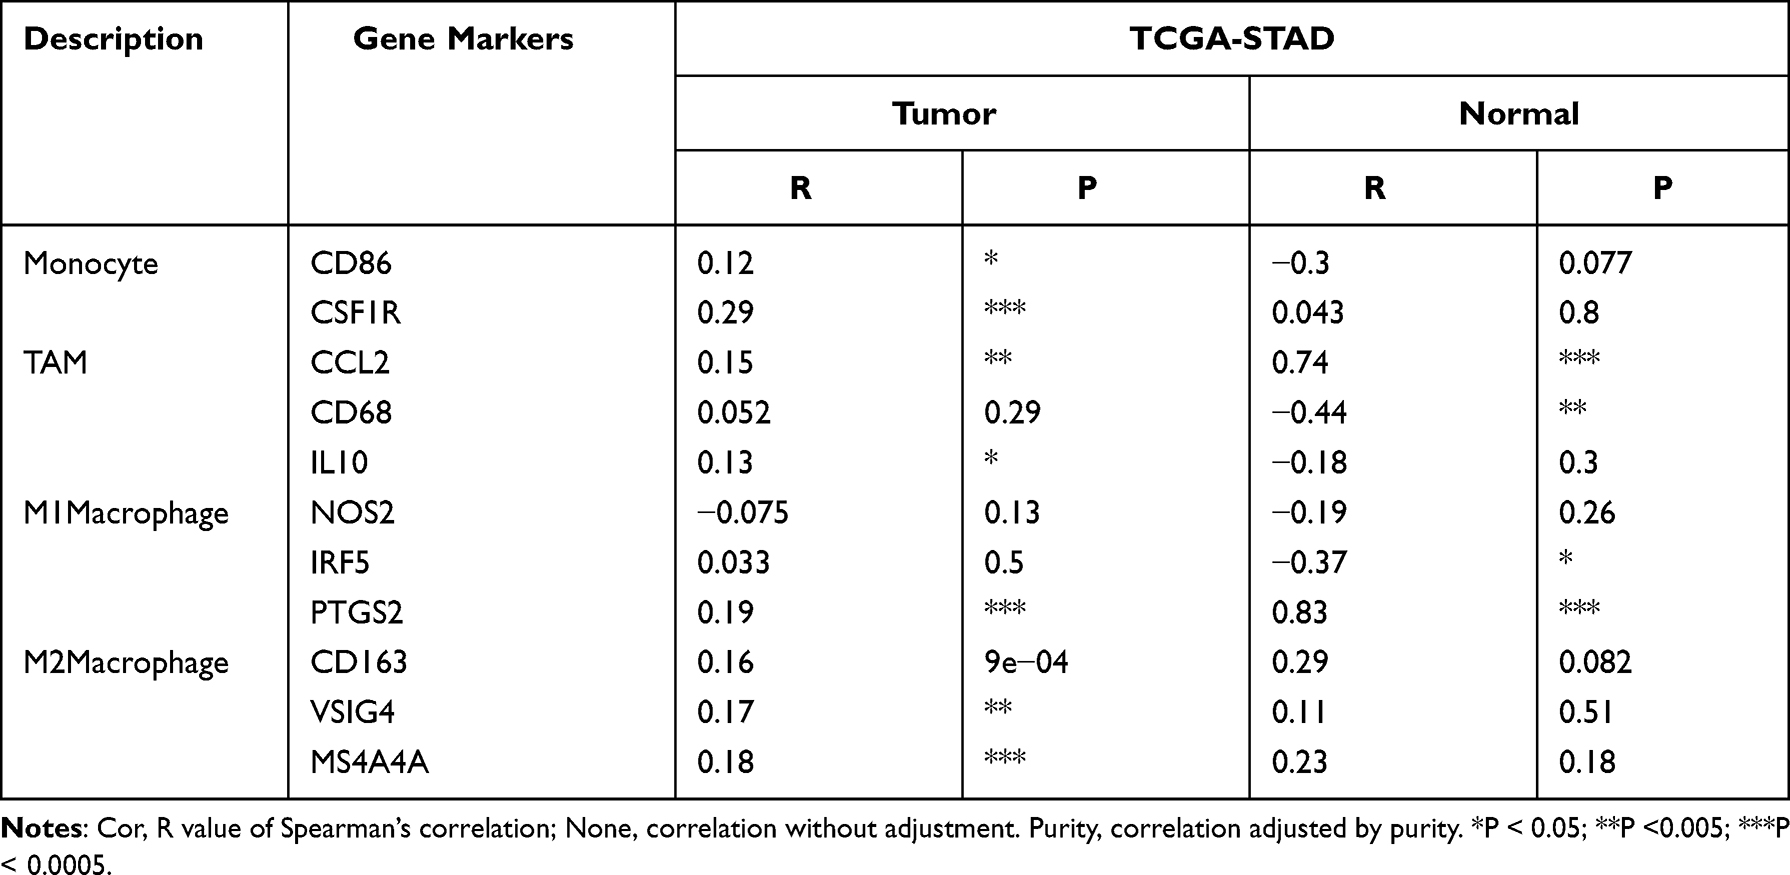 |
Table 1 Correlation Analysis Between TGFBR1 and Relate Genes and Markers of Monocyte, TAM, and Macrophages in GEPIA |
 |
Figure 9 Correlation analysis between TGFBR1 expression and immunological marker set in STAD. (A) Scatterplots of correlations between TGFBR1 expression and gene markers of M1 macrophages in STAD. (B) Scatterplots of correlations between TGFBR1 expression and gene markers of M2 macrophages in STAD. (C) Scatterplots of correlations between TGFBR1 expression and gene markers of TAMs in STAD. (D) Scatterplots of correlations between TGFBR1 expression and gene markers of monocytes in STAD. |
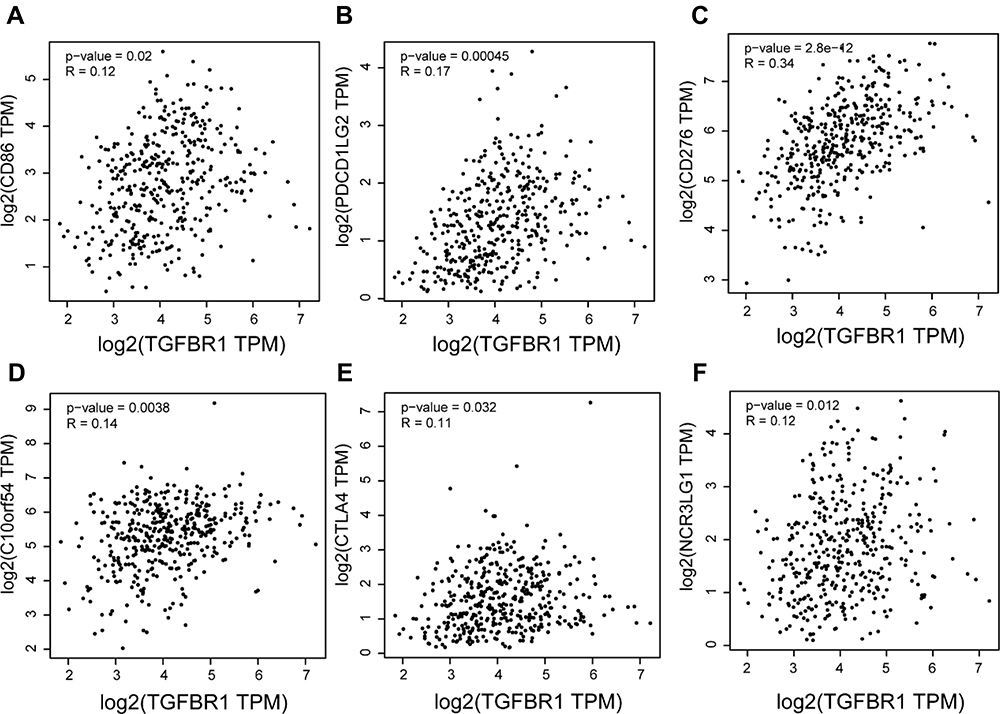 |
Figure 10 (A–F) Correlation analysis between TGFBR1 expression and immune checkpoint based on GEPIA2 in STAD. |
Discussion
STAD is common cancer and remains the leading cause of cancer-related deaths in the worldwide.2 In recent years, the OS of STAD patients has been improved to a certain extent with development of therapy and medicine, but there is still space for improvement. As well known, it is of great sense for improving the prognosis and well understanding the mechanism of the occurrence and metastasis of cancer. Immunological mechanisms governs the development of STAD, and many different effectively immunotherapies methods have been proposed.7 TGFBR1 act as an important member of the TGF‑β family, and it’s of great sense for cell growth and immunological reactions.18
In this paper, we assessed the relationship of TGFBR1 expression and the prognosis of 33 different types of tumors through the TIMER2.0 databases, revealing obvious differences between tumor and normal tissue expression of TGFBR1 in many cancers. TCGA data set analysis indicated that there was elevated TGFBR1 expression in CHOL, COAD, GBM, HNSC, LIHC, PCPG, STAD and THCA, whereas expression was decreased in BLCA, BRCA, KIRP, KIRC, LUAD, LUSC, PRAD and UCEC relative to adjacent controls. Changes of TGFBR1 expression in a range may relate to differences in the underlying biological mechanisms. Particularly, elevated expression of TGFBR1 also was observed in STAD through GEPIA. LASSO-selected features were used to build the TGFBR1 prognostic signature. 9 factors (STON1-GTF2A1L, DIXDC1, FERMT2, BHMT2, ABCC9, MSRB3, SYNC, SORBS1, TGFBR1) with non-zero coefficients were identified. The functions of the genes identified by LASSO related to some signaling pathway and biological process. Some of them be related to TGFB signaling pathway. Such as, FERMT2 (FERM domain containing kindlin 2), have TGFBR1 binding activity,42 Involved in cell surface receptor signaling pathway.42 DIXDC1 (DIX domain containing 1), is a positive regulator of the Wnt signaling pathway.43 ABCC9 (ATP binding cassette subfamily C member 9), is a member of the MRP subfamily which is involved in multi-drug resistance.44 We confirmed the prognostic value of a signature built with 20 TGFBR1-related genes (Figure 3 and Table S3). The risk score of the TGFBR1-related signature was a stable, independent prognosis factor in TCGA datasets. Increasing TGFBR1 correlated with poorer prognosis, as well as, stage, T stage, N stage, and differentiation. The higher TGFBR1 expression in STAD correlated with a elevated stage, N stage, T stage, and poor differentiation. The higher TGFBR1 expression was also a valuable predictor of lymph node metastasis (LNM) in STAD, demonstrating that TGFBR1 may be a precious prognostic indicator of LNM progression in STAD. These results together suggest that TGFBR1 could be prognostic biomarker and associated with progression of STAD.
In our study, we found that the level of TGFBR1 expression with a strong correlation between high TGFBR1 expression and poor prognosis in STAD. Increasing TGFBR1 levels were correlated with a poorer outcome in STAD through TCGA database. Elevated TGFBR1 correlate with poor GC outcome also be found using the Kaplan–Meier plotter database. What’s more important, ROC analysis also confirmed the diagnostic value. In recent years, there was no predictive nomogram for STAD combining the TGFBR1 expression reported. Therefore, a prognostic nomogram involving T, M, N classification, age, pathologic stage, primary therapy outcome, histologic grade and TGFBR1 was constructed, which can be used by the physician to improve the accuracy of identifying high risk STAD patients. Multivariate Cox analysis further confirmed that high TGFBR1 expression was an independent risk factor for OS in STAD patient. Moreover, high TGFBR1 expression was correlated with clinicopathologic features in STAD, including primary therapy outcome, histologic grade, and age. The result showed that high TGFBR1 expression was correlated with advanced gastric cancer, which indicated that it may be a marker to identify early STAD and advanced STAD. We conclude that the poor survival in STAD has a probable prognostic molecular marker known as the TGFBR1 expression. Also, possible key pathways in STAD that is regulated by TGFBR1 are the focal adhesion, pathway in cancer, NOTCH signaling pathway, MAPK signaling pathway, chemokine binding, and positive regulation of VEGF-C production. Finally, the results further suggest that for improved clinical outcomes among STAD patients, we could use an independent prognostic factor known as the high TGFBR1 mRNA expression. We recommend further research on the subject matter to progressively improve the evidence on the biological impact of TGFBR1.
A key finding in this study is that the TGFBR1expression correlated with the degree of immune infiltration level in STAD. We found that TGFBR1 expression was positively correlated with the degree of CD4+ T cells, CD8+ T cells, Macrophages, Neutrophils and Myeloid dendritic cells infiltration in STAD. The results showed that the patient with higher TGFBR1 expression and lower CD8+ T cells infiltration level could be had poor prognosis. We further observed that macrophage infiltration to be significantly associated with prognosis in STAD (Figure 7B). In high TGFBR1 expression group, the patient with higher Macrophage infiltration level could be have poor prognosis. We observed a correlation between TGFBR1 and M1/M2 macrophage markers including PTGS2, CD163, VSIG4 and MS4A4A (Table 1). This suggests that TGFBR1 play an important role in regulating TAM polarization. Also, we found TGFBR1 levels in STAD was related to markers of Treg cells and T cell exhaustion (CCR8, FOXP3, STAT5B, TGFB, HAVCR2, PDCD1 (Table 1). This suggests that TGFBR1 could participated in regulating Treg responses to suppress T cell-mediated immunity. Besides, we observed a correlation between TGFBR1 and NK cell markers including KIR2DL1, KIR2DS4, KIR3DL1, KIR3DL2 (Table 1). NK cells respond rapidly to tumor cells and virus-infected cells through the unique capacity to recognize stressed cells in the absence of an adaptive response, allowing a rapid immune reaction.6 The result may reveal that TGFBR1may participate in regulating NK cell-mediated rapid immune reaction or innate immunity. What’s more, we observed that TGFBR1 expression correlated with multiple T cell markers (Th1, Th2, Tfh and Th17). This may correspond to the ability of TGFBR1 to regulate T cell responses in STAD. Together, the correlation observed between TGFBR1 and certain immunological marker genes demonstrated that TGFBR1 could regulate immune cell infiltration and interactions within the tumor microenvironment in STAD.
In addition, the TGFBR1 expression level is positively correlated with the expression levels of CD86, CD276, PDCD1LG2, C10orf54, CTLA4, CD28 and NCR3LG1 in STAD. The correlation observed between TGFBR1 and the expression of 15 Immune checkpoint (B7 and CD28 family) suggests that TGFBR1 participated in regulating immune cell infiltration and interactions within the tumor microenvironment in STAD tumors. Together, these results highlight the ability of TGFBR1 to take part in potentially regulating immune cell recruitment and activation in STAD. The TGFBR1 expression correlated with the expression of several immune checkpoint, highlighting a possible role for TGFBR1 in the immunological interaction in STAD, making it a valuable biomarker worthy of further research in this type of cancer.
Conclusion
In summary, TGFBR1 could be a prognostic biomarker and an important regulator of immune cell infiltration in STAD. However, some limitations still exist in our study. There are some biases caused by confounding factors because of data from public databases. In addition, cell function assay and validation in vivo which are solid evidence were lacking. Some mechanisms of TGFBR1 in STAD also require further investigation.
Abbreviations
A list of abbreviations used in the manuscript and their meanings as show in Table S6.
Data Sharing Statement
All datasets generated for this study are included in the article/Supplementary Material.
Ethics Approval and Consent to Participate
This study was approved by Ethics Committee of Tianjin Medical University Cancer Institute and Hospital.
Consent for Publication
Yes.
Acknowledgments
Thank all members of TCGA, Timer, and GEPIA database for providing a good platform for researchers.
Funding
This work was supported by grants from the National Natural Science Foundation of China (Nos. 82072664, 81772629, 81974374, 82173125, 81802363, 81702431), Tianjin Science Foundation (Nos. 18JCQNJC81900, 18JCYBJC92000, 18JCYBJC25400, 18JCYBJC92900) and the Science & Technology Development Fund of the Tianjin Education Commission for Higher Education (2018KJ046, 2017KJ227). The funders had no role in the study design, the data collection and analysis, the interpretation of the data, the writing of the report, and the decision to submit this article for publication.
Disclosure
The authors report no conflicts of interest in this work.
References
1. Sung H, Ferlay J, Siegel RL, et al. Global cancer statistics 2020: globocan estimates of incidence and mortality worldwide for 36 cancers in 185 countries. CA Cancer J Clin. 2021;71(3):209–249. doi:10.3322/caac.21660
2. He Y, Mao M, Shi W, et al. Development and validation of a prognostic nomogram in gastric cancer with hepatitis B virus infection. J Transl Med. 2019;17(1):98. doi:10.1186/s12967-019-1841-3
3. Ishimoto T, Miyake K, Nandi T, et al. Activation of transforming growth factor beta 1 signaling in gastric cancer-associated fibroblasts increases their motility, via expression of Rhomboid 5 Homolog 2, and ability to induce invasiveness of gastric cancer cells. Gastroenterology. 2017;153(1):191–204 e16. doi:10.1053/j.gastro.2017.03.046
4. Zhang L, Song X, Chen X, et al. Circular RNA CircCACTIN promotes gastric cancer progression by sponging MiR-331-3p and regulating TGFBR1 expression. Int J Biol Sci. 2019;15(5):1091–1103. doi:10.7150/ijbs.31533
5. Du Q, Guo X, Wang M, et al. The application and prospect of CDK4/6 inhibitors in malignant solid tumors. J Hematol Oncol. 2020;13(1):41. doi:10.1186/s13045-020-00880-8
6. Batlle E, Massagué J. Transforming growth factor-β signaling in immunity and cancer. Immunity. 2019;50(4):924–940. doi:10.1016/j.immuni.2019.03.024
7. Procaccio L, Schirripa M, Fassan M, et al. Immunotherapy in gastrointestinal cancers. Biomed Res Int. 2017;2017:4346576. doi:10.1155/2017/4346576
8. David CJ, Massagué J. Contextual determinants of TGFβ action in development, immunity and cancer. Nat Rev Mol Cell Biol. 2018;19(7):419–435. doi:10.1038/s41580-018-0007-0
9. Leach JDG, Vlahov N, Tsantoulis P, et al. Oncogenic BRAF, unrestrained by TGFbeta-receptor signalling, drives right-sided colonic tumorigenesis. Nat Commun. 2021;12(1):3464. doi:10.1038/s41467-021-23717-5
10. Kano MR, Bae Y, Iwata C, et al. Improvement of cancer-targeting therapy, using nanocarriers for intractable solid tumors by inhibition of TGF-beta signaling. Proc Natl Acad Sci U S A. 2007;104(9):3460–3465. doi:10.1073/pnas.0611660104
11. Roberts AB, Wakefield LM. The two faces of transforming growth factor beta in carcinogenesis. Proc Natl Acad Sci U S A. 2003;100(15):8621–8623. doi:10.1073/pnas.1633291100
12. Morikawa M, Derynck R, Miyazono K. TGF-β and the TGF-β family: context-dependent roles in cell and tissue physiology. Cold Spring Harb Perspect Biol. 2016;8(5):a021873. doi:10.1101/cshperspect.a021873
13. Hata A, Chen Y-G. TGF-β signaling from receptors to smads. Cold Spring Harb Perspect Biol. 2016;8(9):a022061. doi:10.1101/cshperspect.a022061
14. Vander Ark A, Cao J, Li X. TGF-β receptors: in and beyond TGF-β signaling. Cell Signal. 2018;52:112–120. doi:10.1016/j.cellsig.2018.09.002
15. Liu J, Johnson K, Li J, et al. Regenerative phenotype in mice with a point mutation in transforming growth factor β type I receptor (TGFBR1). Proc Natl Acad Sci U S A. 2011;108(35):14560–14565. doi:10.1073/pnas.1111056108
16. Zhou B, Guo W, Sun C, et al. Linc00462 promotes pancreatic cancer invasiveness through the miR-665/TGFBR1-TGFBR2/SMAD2/3 pathway. Cell Death Dis. 2018;9(6):706. doi:10.1038/s41419-018-0724-5
17. Liu R, Zhang Y, Ding Y, et al. Characteristics of TGFBR1-EGFR-CTNNB1-CDH1 signaling axis in wnt-regulated invasion and migration in lung cancer. Cell Transplant. 2020;29:963689720969167. doi:10.1177/0963689720969167
18. Wang J, Xiang H, Lu Y, et al. Role and clinical significance of TGF‑β1 and TGF‑βR1 in malignant tumors (Review). Int J Mol Med. 2021;47(4):55. doi:10.3892/ijmm.2021.4888
19. Derynck R, Zhang YE. Smad-dependent and Smad-independent pathways in TGF-β family signalling. Nature. 2003;425(6958):577–584. doi:10.1038/nature02006
20. Rodón J, Carducci M, Sepulveda-Sánchez JM, et al. Pharmacokinetic, pharmacodynamic and biomarker evaluation of transforming growth factor-β receptor I kinase inhibitor, galunisertib, in phase 1 study in patients with advanced cancer. Invest New Drugs. 2015;33(2):357–370. doi:10.1007/s10637-014-0192-4
21. Tran HC, Wan Z, Sheard MA, et al. TGFβR1 blockade with galunisertib (LY2157299) enhances anti-neuroblastoma activity of the Anti-GD2 antibody dinutuximab (ch14.18) with natural killer cells. Clin Cancer Res. 2017;23(3):804–813. doi:10.1158/1078-0432.CCR-16-1743
22. Wilson EB, El-Jawhari JJ, Neilson AL, et al. Human tumour immune evasion via TGF-β blocks NK cell activation but not survival allowing therapeutic restoration of anti-tumour activity. PLoS One. 2011;6(9):e22842–e22842. doi:10.1371/journal.pone.0022842
23. Padua D, Massagué J. Roles of TGFβ in metastasis. Cell Res. 2009;19(1):89–102. doi:10.1038/cr.2008.316
24. Boutet M, Gauthier L, Leclerc M, et al. TGFβ signaling intersects with CD103 integrin signaling to promote T-Lymphocyte accumulation and antitumor activity in the lung tumor microenvironment. Cancer Res. 2016;76(7):1757. doi:10.1158/0008-5472.CAN-15-1545
25. Neviani P, Wise PM, Murtadha M, et al. Natural killer-derived exosomal miR-186 inhibits neuroblastoma growth and immune escape mechanisms. Cancer Res. 2019;79(6):1151–1164. doi:10.1158/0008-5472.CAN-18-0779
26. Konkel JE, Zhang D, Zanvit P, et al. Transforming growth factor-beta signaling in regulatory T cells controls T helper-17 cells and tissue-specific immune responses. Immunity. 2017;46(4):660–674. doi:10.1016/j.immuni.2017.03.015
27. Blum A, Wang P, Zenklusen JC. SnapShot: TCGA-analyzed tumors. Cell. 2018;173(2):530. doi:10.1016/j.cell.2018.03.059
28. Tang Z, Li C, Kang B, et al. GEPIA: a web server for cancer and normal gene expression profiling and interactive analyses. Nucleic Acids Res. 2017;45(W1):W98–W102. doi:10.1093/nar/gkx247
29. Tang Z, Kang B, Li C, et al. GEPIA2: an enhanced web server for large-scale expression profiling and interactive analysis. Nucleic Acids Res. 2019;47(W1):W556–W560. doi:10.1093/nar/gkz430
30. Lánczky A, Nagy Á, Bottai G, et al. miRpower: a web-tool to validate survival-associated miRNAs utilizing expression data from 2178 breast cancer patients. Breast Cancer Res Treat. 2016;160(3):439–446. doi:10.1007/s10549-016-4013-7
31. Li T, Fan J, Wang B, et al. TIMER: a web server for comprehensive analysis of tumor-infiltrating immune cells. Cancer Res. 2017;77(21):e108–e110. doi:10.1158/0008-5472.CAN-17-0307
32. Li T, Fu J, Zeng Z, et al. TIMER2.0 for analysis of tumor-infiltrating immune cells. Nucleic Acids Res. 2020;48(W1):W509–W514. doi:10.1093/nar/gkaa407
33. Yi L, Wu G, Guo L, et al. Comprehensive analysis of the PD-L1 and immune infiltrates of m(6)A RNA methylation regulators in head and neck squamous cell carcinoma. Mol Ther Nucleic Acids. 2020;21:299–314. doi:10.1016/j.omtn.2020.06.001
34. Zhang Z, Lin E, Zhuang H, et al. Construction of a novel gene-based model for prognosis prediction of clear cell renal cell carcinoma. Cancer Cell Int. 2020;20:27. doi:10.1186/s12935-020-1113-6
35. Karasinska JM, Topham JT, Kalloger SE, et al. Altered gene expression along the glycolysis–cholesterol synthesis axis is associated with outcome in pancreatic cancer. Clin Cancer Res. 2020;26(1):135. doi:10.1158/1078-0432.CCR-19-1543
36. Subramanian A, Tamayo P, Mootha VK, et al. Gene set enrichment analysis: a knowledge-based approach for interpreting genome-wide expression profiles. Proc Natl Acad Sci U S A. 2005;102(43):15545–15550. doi:10.1073/pnas.0506580102
37. Yu G, Wang L-G, Han Y, et al. clusterProfiler: an R package for comparing biological themes among gene clusters. Omics. 2012;16(5):284–287. doi:10.1089/omi.2011.0118
38. Hänzelmann S, Castelo R, Guinney J. GSVA: gene set variation analysis for microarray and RNA-seq data. BMC Bioinform. 2013;14:7. doi:10.1186/1471-2105-14-7
39. Bindea G, Mlecnik B, Tosolini M, et al. Spatiotemporal dynamics of intratumoral immune cells reveal the immune landscape in human cancer. Immunity. 2013;39(4):782–795. doi:10.1016/j.immuni.2013.10.003
40. Lin W, Wu S, Chen X, et al. Characterization of hypoxia signature to evaluate the tumor immune microenvironment and predict prognosis in glioma groups. Front Oncol. 2020;10:796. doi:10.3389/fonc.2020.00796
41. Xu F, Huang X, Li Y, et al. m6A-related lncRNAs are potential biomarkers for predicting prognoses and immune responses in patients with LUAD. Mol Ther Nucleic Acids. 2021;24:780–791. doi:10.1016/j.omtn.2021.04.003
42. Liu S, Song A, Wu Y, et al. Analysis of genomics and immune infiltration patterns of epithelial-mesenchymal transition related to metastatic breast cancer to bone. Transl Oncol. 2021;14(2):100993. doi:10.1016/j.tranon.2020.100993
43. Tan C, Qiao F, Wei P, et al. DIXDC1 activates the Wnt signaling pathway and promotes gastric cancer cell invasion and metastasis. Mol Carcinog. 2016;55(4):397–408. doi:10.1002/mc.22290
44. Li B, Jiang J, Assaraf YG, et al. Surmounting cancer drug resistance: new insights from the perspective of N6-methyladenosine RNA modification. Drug Resist Updat. 2020;53:100720. doi:10.1016/j.drup.2020.100720
 © 2022 The Author(s). This work is published and licensed by Dove Medical Press Limited. The
full terms of this license are available at https://www.dovepress.com/terms
and incorporate the Creative Commons Attribution
- Non Commercial (unported, 3.0) License.
By accessing the work you hereby accept the Terms. Non-commercial uses of the work are permitted
without any further permission from Dove Medical Press Limited, provided the work is properly
attributed. For permission for commercial use of this work, please see paragraphs 4.2 and 5 of our Terms.
© 2022 The Author(s). This work is published and licensed by Dove Medical Press Limited. The
full terms of this license are available at https://www.dovepress.com/terms
and incorporate the Creative Commons Attribution
- Non Commercial (unported, 3.0) License.
By accessing the work you hereby accept the Terms. Non-commercial uses of the work are permitted
without any further permission from Dove Medical Press Limited, provided the work is properly
attributed. For permission for commercial use of this work, please see paragraphs 4.2 and 5 of our Terms.