Back to Journals » Drug Design, Development and Therapy » Volume 16
Comprehensive Analysis of Metabolic Changes in Male Mice Exposed to Sodium Valproate Based on GC-MS Analysis
Authors Gao Y, Jiang D, Wang C, An G, Zhu L ![]() , Cui C
, Cui C
Received 9 January 2022
Accepted for publication 31 May 2022
Published 17 June 2022 Volume 2022:16 Pages 1915—1930
DOI https://doi.org/10.2147/DDDT.S357530
Checked for plagiarism Yes
Review by Single anonymous peer review
Peer reviewer comments 4
Editor who approved publication: Professor Manfred Ogris
Yahao Gao,1,* Di Jiang,2,* Changshui Wang,3 Gang An,1 Li Zhu,4 Changmeng Cui3
1Clinical Medical School, Jining Medical University, Jining, Shandong, People’s Republic of China; 2Cheeloo College of Medicine, Shandong University, Jinan, Shandong, People’s Republic of China; 3Department of Neurosurgery, Affiliated Hospital of Jining Medical University, Jining, People’s Republic of China; 4Department of Clinical Pharmacy, Jining First People’s Hospital, Jining Medical University, Jining, Shandong, People’s Republic of China
*These authors contributed equally to this work
Correspondence: Changmeng Cui, Department of Neurosurgery, Affiliated Hospital of Jining Medical University, 89 Guhuai Road, Jining, Shandong, 272000, People’s Republic of China, Tel +8617805378911, Email [email protected]
Purpose: Sodium valproate (VPA) is the most widely used broad-spectrum antiepileptic first-line drug in clinical practice and is effective against various types of epilepsy. However, VPA can induce severe cardiotoxicity, nephrotoxicity, hepatotoxicity, and neurotoxicity, which limits its use. Metabolomic studies of VPA-induced toxicity have focused primarily on changes in serum and urine metabolites but have not evaluated changes in major organs or tissues.
Methods: Central target tissues (intestine, lung, liver, hippocampus, cerebral cortex, inner ear, spleen, kidney, heart, and serum) were analyzed using gas chromatography mass spectrometry to comprehensively evaluate VPA toxicity in mouse models.
Results: Multivariate analyses, including orthogonal projections of the latent structure and Student’s t test, indicated that depending on the matrix used in the study (the intestine, lung, liver, hippocampus, cerebral cortex, inner ear, spleen, kidney, heart or serum) the number of metabolites differed, the lung being the poorest and the kidney the richest in number.
Conclusion: These metabolites were closely related and were found to participate in 12 key pathways related to amino acid, fatty acid, and energy metabolism, revealing that the toxic mechanism of VPA may involve oxidative stress, inflammation, amino acid metabolism, lipid metabolism, and energy disorder.
Keywords: sodium valproate, biomarker, gas chromatography mass spectrometry, metabolomics, toxicity mechanism
Introduction
Sodium valproate (VPA) is an eight-carbon molecule with the backbone of pentanoic acid and a propyl group attached to the second carbon.1 VPA is the most widely used antiepileptic due to its efficacy against a broad spectrum of epileptic disorders, rapid onset, and good disease control with the administration of a single drug.2 Furthermore, VPA is widely used to treat various types of minor seizures, myoclonic seizures, epilepsy, localized epilepsy, large seizures, and mixed seizures. It is also often used to treat migraines, chronic headaches, bipolar disorder, schizophrenia, and personality disorders.3 The use of VPA is limited because it can induce neurotoxicity,4 reproductive toxicity,5,6 genetic toxicity,7 and teratogenicity.8 Furthermore, VPA can also inhibit cell growth through cell cycle arrest, inhibition of proliferation, and increased apoptosis.9
Studies have shown that VPA can cause damage to the liver,10–12 kidney,13 heart,14 and brain.4,15 However, reports of VPA damage to other organs are rare, and the specific mechanism of VPA-induced organ toxicity has not been characterized. Therefore, the purpose and significance of this experiment is to comprehensively evaluate the toxic effect of VPA by studying the levels of metabolites in the intestine, lung, liver, hippocampus, cerebral cortex, inner ear, spleen, kidney, heart, and serum, and to preliminarily study the specific mechanism of organ toxicity induced by VPA.
Metabolomics is an emerging technique in the field of systems biology. Advances in analytical technology and bioinformatics have allowed widespread use of metabolomics in clinical and biomedical research.16 Currently, the most widely used metabolomics analysis methods mainly involved nuclear magnetic resonance spectroscopy (NMRS), mass spectrometry (MS), liquid chromatography mass spectrometry (LC-MS), gas chromatography mass spectrometry (GC-MS), and capillary electrophoresis-mass spectrometry (CE-MS),17 At present, various technologies have been widely used in medical and other related research fields. GC-MS technology has the advantages of high separation efficiency, high sensitivity, low cost, and accurate quantitative analysis of the results. Therefore, this method is widely used in metabolomics. Its main purpose is to define toxicology and biomarkers, and to diagnose and classify diseases.18 In this study, GC-MS was used to detect changes in levels of metabolites in various tissues and organs. Principal component analysis (PCA) and orthogonal partial least squares discriminant analysis (OPLS-DA) were used to analyze differences between VPA-treated and control groups.
Several studies have used GC-MS to study VPA-induced toxicity, but these studies have focused primarily on serum10 and urine19 metabolites to analyze systemic effects. Only one study used GC-MS to perform a metabolomics study to predict VPA-induced hepatotoxicity.20 No studies have performed a comprehensive and systematic metabolomics analysis of major tissues and organs. Our study was the first comprehensive metabolomics study to characterize the effects of VPA on different tissues and organs, including the intestines, lung, liver, hippocampus, brain, inner ear, spleen, kidney, heart, and serum. This study will provide novel insights into the metabolic pathogenesis of VPA-induced toxicity.
Materials and Methods
Chemicals and Reagents
VPA (purity≥98%) was obtained from Shanghai Macklin Biochemical (Shanghai, China). Heptadecanoic acid (purity≥98%) was obtained from Shanghai Macklin Biochemical (Shanghai, China) and was used as an internal standard (IS). O-methylhydroxylamine hydrochloride (purity≥98%) was obtained from J&K Scientific Ltd. (Beijing, China). N,O-bis(trimethylsilyl)trifluoroacetamide with trimethylchlorosilane (99% BSTFA + 1% TMCS) (v/v) was obtained from Sigma Aldrich. Methanol (chromatographic grade) and pyridine were purchased from Shanghai Macklin Biochemical (Shanghai, China). Water was purchased from Hangzhou Wahaha Company (Hangzhou, China).
Animal Treatment
A total of 18 male six-week-old KM mice (males, 40 g) were provided by Jining Medical College. The mice were allowed to habituate and were given food and water ad libitum for one week before the initiation of the experiments. Mice were randomly divided into the VPA group (n=9) and the control group (n=9). The VPA group was administrated with the same dose of VPA. The VPA group was injected intraperitoneally with 300 mg/kg, 3 times a day for 7 consecutive days. The control group was injected with the same volume of normal saline. The VPA dose was selected based on a review of the literature.21–25 This study was performed in accordance with the animal welfare guidelines laid down in China (Laboratory Animal Guidelines for Ethical Review of Animal Welfare, GB/T 35892-2018) and approved by the Ethics Committee of the Affiliated Hospital of Jining Medical University (Approval Number: 2022B001).
Solution Preparation
Internal Standard Preparation
One milligram of heptadecanoic acid dried to constant weight was accurately weighed and placed into a 10 mL volumetric flask. A 10-mL volume of methanol was added and the flask was shaken to obtain a 100 ug/mL heptadecanoic acid IS solution to be used with the serum samples. Similarly, 10 mg of heptadecanoic acid was placed in a 10 mL volumetric flask and 10 mL of methanol was added before shaking to obtain a 1 mg/mL heptadecanoic acid IS solution to be used with tissue homogenates.
Methoxypyridine Preparation
A total of 75 mg of methoxyamine hydrochloride was weighed and placed in a 5-mL volumetric flask. The volume was then adjusted with pyridine to 5 mL and shaken to obtain the 15 mg/mL methoxyamine pyridine solution.
Sample Collection and Preparation
Sample Collection
Eighteen mice were anesthetized by intraperitoneal injection with 10% chloral hydrate. Before the mice were euthanized, the eyeballs of each mouse were removed. After anesthesia approximately 2 mL of blood sample was retrieved and centrifuged at 5,000 rpm for 15 minutes to obtain serum. Each mouse was immediately dissected on ice to obtain the intestine, lung, liver, hippocampus, cerebral cortex, inner ear, spleen, kidney, and heart. All samples were washed with phosphate buffered saline (pH 7.2), then frozen at −80°C until use.
Preparation of Quality Control Samples
Serum samples stored at −80°C were thawed at room temperature and 100 μL of serum was obtained from each (18x100 μL) and placed in a centrifuge tube and then 350 μL of IS was added and the solution was vortexed for 2 min to obtain serum quality control (QC) samples.
For tissue samples, a 50 mg of sample was added 1 mL of methanol for homogenization26 and ground on a grinder for 180 s. The grinding parameters used were 70Hz, 1800 rpm. A 500 μL volume of sample was placed in a 1.5 mL centrifuge tube, followed by the addition of 50 μL of IS. The solution was vortexed for 2 min to obtain the QC sample for the tissue, which corresponded to 50 mg of each tissue (9) from each mouse (18x50mg).
Derivatization Treatment
After centrifuging the sample for 15 minutes (14,000 rpm, 4°C), 400 μL of the supernatant was removed and placed in a 15-mL centrifuge tube, and the methanol in the supernatant was air-dried at 37°C using high-purity nitrogen. After drying the samples, 80 μL of 15 mg/mL solution of methoxyamine pyridine was added and then the samples were vortexed for 2 min, and sealed with parafilm. The samples were then methoxylated in a 70°C water bath for 1.5 h. Next, the samples were removed and cooled to room temperature and 100 μL BSTFA (N, O-bis(trimethylsilyl)trifluoroacetamide) was added (containing 1% TMCS (trimethylchlorosilane)), vortexed for 2 min, then sealed and reacted in a 70°C water bath for 1 h. After vortex mixing, the sample was centrifuge at 3000 rpm for 2 min at 4°C and the supernatant was subjected to GC-MS analysis. The collection and preparation methods of samples mentioned above have been described in several studies.27–30
GC-MS Analysis
Samples were analyzed using a 7890B GC system/7000C triple quadrupole mass spectrometer (Agilent Technologies, USA) with a QC sample inserted after every nine test samples to assess the stability of the instrument. And all samples were injected randomly during the test. Samples were separated on an HP-5MS fused-silica capillary column, with helium as the carrier gas and at a 50:1 split ratio. The front inlet purge flow rate was 3 mL/min, and the gas flow rate was 1 mL/min. The temperatures of the transfer line, the inlet, and the ion source were 250°C, 280°C, and 230°C, respectively. The GC temperature program was held at 60°C for 4 minutes, then ramped at 8°C/min, and held at 300°C for 5 minutes. The electron beam was set to −70 eV, and the acquisition rate was 20 spectra/sec. MS detection was carried out by electrospray ionization and the scope of the full-scan mass/charge (m/z) values ranges 50–800.
Collection and Processing of GC-MS Data
GC-MS equipped with Agilent MassHunter Quantitative Analysis software and Unknowns Analysis software was used to process the GC data. This process enabled deconvolution, alignment, and data reduction to produce a list of m/z and RT pairs, with the corresponding intensities for all detected peaks from each data file in the dataset. The resulting table was exported into ExcelTM (Microsoft, Redmond, WA, United States), and the stability of the instrument was ensured by calculating the RSD value (RSD<5%) of the peak area of IS (heptadecanoic acid). The chromatograms of each sample were then integrated and the peak areas were area normalized. In this experimental design, random sampling was adopted when mice were grouped, and samples were detected.
Qualitative and Quantitative Analysis
Qualitative analysis was used to initially identify the compounds by matching the compound spectra with the Agilent Fiehn GC/MS Metabolomics RTL library, and then the NIST14.0 standard mass spectrum library was used to compare and select components with a similarity greater than 80% as metabolite components and other quantitative components. Quantitative analysis adopted a relative quantitative analysis. Unknowns Analysis software was used in combination with Agilent MassHunter Quantitative Analysis software (Agilent Technologies, USA) to analyze the QC samples, select endogenous compounds and export the screening results as a sample library. Using the quantitative analysis function in the Agilent MassHunter Quantitative Analysis software, the peak areas of various metabolites were integrated by retention time and location of the metabolites in the sample, and the peak areas were calculated by area normalization. The metabolites in the serum and different tissues were quantitatively analyzed by the internal standard quantitative method, and heptadecanoic acid was used as the internal standard. This is one of the most used relative quantitative methods and is widely used in chromatographic analysis. It has the advantages of convenience and accuracy. Quantitative values of metabolites in each tissue were tested for normality by Shapiro–Wilks testing using SPSS 19.0 software, and P>0.05 was considered to be in line with normal distribution.
Multivariate Statistical Analysis
The resulting three-dimensional data set that included the peak index (RT–m/z pairs), sample names (observations), and normalized peak area percentages was imported into SIMCA-P 14.0 (Umetrics, Ume, Sweden) for statistical analyses. Unsupervised principal component analysis (PCA) and orthogonal projections to latent structure discriminant analysis (OPLS-DA) were used to distinguish the VPA-treated and control groups. The validity of the model was verified with SIMCA-P software by permutation tests (200 permutations). SPSS 19.0 (SPSS Inc, Chicago, IL, USA) was used to conduct two-tailed Student’s t-tests. Variable importance in projection (VIP) values >1.0 in OPLS-DA and p-values <0.05 in Student’s t tests were considered statistically significant and were used to select compounds as differential metabolites.
Metabolic Markers and Analysis of Metabolic Pathways
MetaboAnalyst 5.0 (http://www.metaboanalyst.ca) and KEGG (Kyoto Encyclopedia of Genes and Genomes; http://www.kegg.jp) were used for the pathway analysis. Based on the selected specific metabolites, the metabolic pathway analysis tools were used to identify the differential metabolites and the most significant metabolic pathways involved. The pathways raw p<0.05 and impact >0 values were considered related to the mechanism of VPA toxicity.
Results
GC-MS Chromatograms of Serum and Tissue Samples
Under optimized GC-MS detection conditions, total ion chromatograms (TICs) of the QC serum and tissue samples (intestine, lung, liver, hippocampus, brain, inner ear, spleen, kidney, heart) were obtained (Supplementary Figure 1). It can be seen from the TICs that the number of chromatographic peaks is rich and most metabolites are completely separated. The internal standard peak was the heptadecanoic acid peak, and the peak time and peak area were stable. All samples showed strong signals and good reproducibility in retention time.
Multivariate Statistics of the Metabolomics Data
In the OPLS-DA analysis, there were obvious differences between the VPA-treated and control groups. There were 5, 2, 6, 11, 11, 6, 3, 18, 7, and 3 differentially abundant low molecular weight metabolites in the intestine, lung, liver, hippocampus, cerebral cortex, inner ear, spleen, kidney, heart, and serum, respectively, when two groups were compared (VIP > 1, p<0.05) (Table 1). The parameters (intestine: R2X=0.887, R2Y=0.947, Q2=0.725; lung: R2X=0.828, R2Y=1, Q2=0.535; liver: R2X=0.703, R2Y=1, Q2=0.825; hippocampus: R2X=0.621, R2Y=0.999, Q2=0.767; brain: R2X=0.731, R2Y=0.998, Q2=0.893; inner ear: R2X=0.509, R2Y=0.909, Q2=0.551; spleen: R2X=0.484, R2Y=0.92, Q2=0.452; kidney: R2X=0.633, R2Y=0.993, Q2=0.859; heart: R2X=0.443, R2Y=0.997, Q2=0.756; serum: R2X=0.646, R2Y=1, Q2=0.456) showed that the model was effective and could clearly distinguish between the VPA-treated and control groups. The values of these parameters are all close to 1.0, which indicated that the model was stable and had good predictive reliability. The permutation tests verified the model validation and the intersection of the regression lines of the Q2-points and the vertical axis on the left was less than zero.
 |
Table 1 List of Assigned Statistically Significant Metabolites of the Intestine, Lung, Liver, Hippocampus, Cerebral Cortex, Inner Ear, Spleen, Kidney, Heart, and Serum with Differential Levels in the VPA and Control Groups |
The results of the cluster analysis of metabolite abundance in each tissue for the control and VPA groups are shown in Figure 1. Although there was some overlap between the sample groups, the metabolite content of the VPA group was significantly different from that of the control group, indicating that the samples had good repeatability and that the data were reliable.
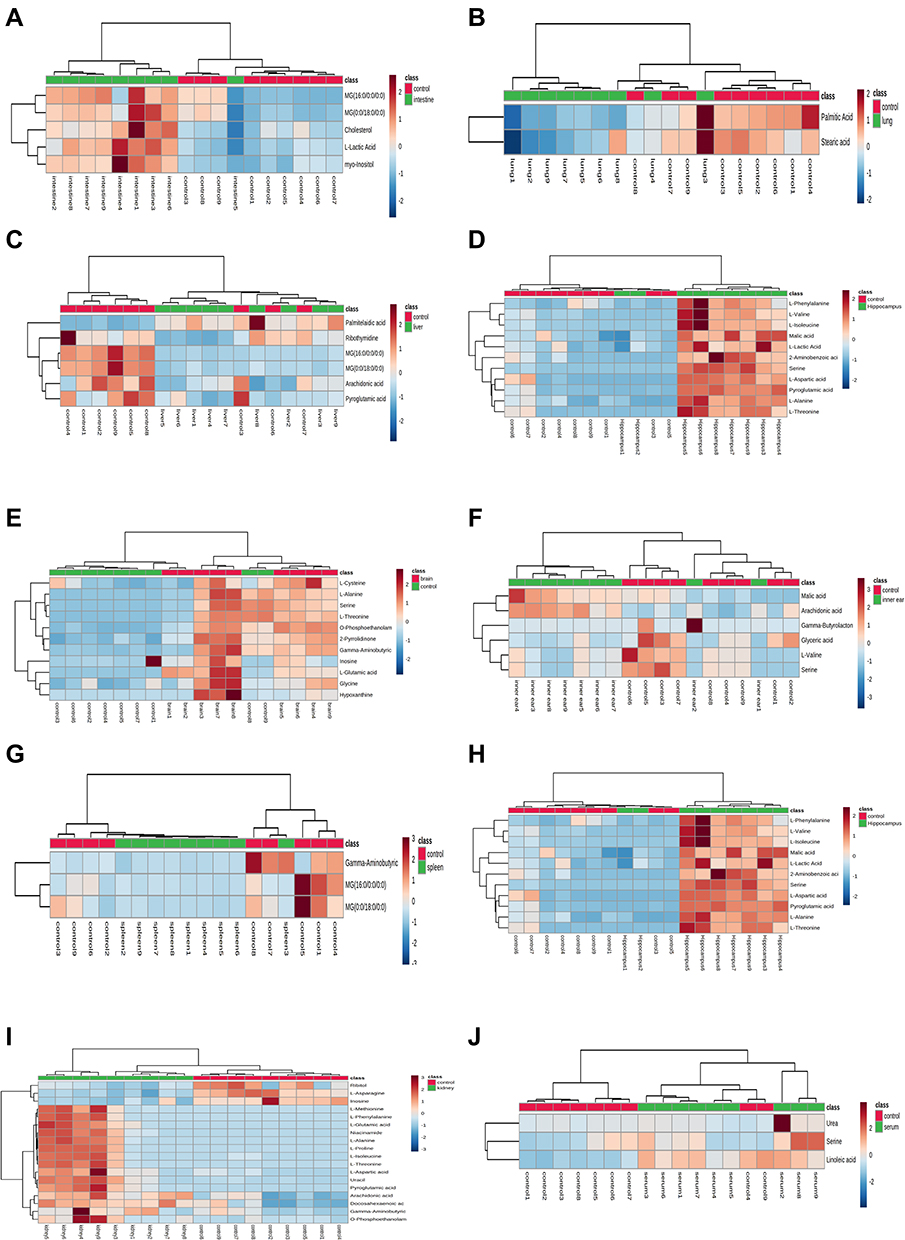 |
Figure 1 Heatmap of differential metabolites in intestine (A), lung (B), liver (C), hippocampus (D), cerebral cortex (E), inner ear (F), spleen (G), heart (H), kidney (I), and serum (J) samples in the VPA group compared to controls. The color of each part represents the importance of metabolite changes (blue, down-regulated; red, up-regulated). Rows represent samples, and columns represent metabolites. (Control in red and VPA-treated in green). |
Identification of Differential Metabolites
The identification of metabolic substances was based on the mature mass spectrometry database. Metabolites were initially identified by matching their metabolite profiles with the Agilent Fiehn GC/MS Metabolomics RTL Library. The metabolites were finally identified by referring to the standard spectrogram, compound name, structure, molecular formula, molecular weight, degree of matching, and similarity provided by the NIST14.0 database. A general similarity > 80% was considered credible. The compounds consisted of endogenous metabolites such as amino acids, fatty acids, sugars, esters, and cholesterol.
In tissues and serum, the levels of 40 metabolites were significantly different between the control group and the VPA group (Student’s t-test p<0.05). In the kidney, there were significant differences in the levels of 18 metabolites between the control group and the VPA group. These metabolites were amino acids and fatty acid derivatives. Eleven metabolites were differentially abundant in the hippocampus and included amino acids and their derivatives, and lactic acid. Furthermore, 11 metabolites were differentially abundant in the cerebral cortex and included amino acids, purine derivatives, and amines. In the heart, there were 7 differentially abundant metabolites, which included amino acids, lactic acid, fatty acids, and inosine. In the liver, VPA exposure led to altered levels of amino acids, fatty acids, and nucleosides. In the inner ear, there were significant differences in the levels of 6 metabolites between the control group and the VPA group, which included amino acids and fatty acids. The amino acids and unsaturated fatty acids are the two major group of compounds present in all tissues and serum able to separate VPA and control groups. The differences in metabolites between the groups are summarized in Table 1. Some were identified with a standard, while others were identified only by the index or NIST.
Analysis of Metabolic Pathways
To further evaluate the metabolic changes between the VPA group and the control group, identified metabolites were analyzed using MetaboAnalyst 5.0. Twelve metabolic pathways were strongly associated with exposure to VPA (raw p<0.05, impact > 0) (Table 2). Pathways in the liver included (a) glutathione metabolism and (b) arachidonic acid metabolism. The pathways in the hippocampus included (c) alanine, aspartate, and glutamate metabolism, and (d) phenylalanine, tyrosine, and tryptophan biosynthesis. Pathways in the cerebral cortex included (a) glutathione metabolism, (c) alanine, aspartate, and glutamate metabolism, (e) glycine, serine, and threonine metabolism, (f) butanoate metabolism, (g) glyoxylate and dicarboxylate metabolism, (h) arginine and proline metabolism, and (i) D-glutamine and D-glutamate metabolism. The pathways in the spleen included (c) alanine, aspartate, and glutamate metabolism, (f) metabolism, and (h) arginine and proline metabolism. Pathways in the kidney included (a) glutathione metabolism, (c) alanine, aspartate, and glutamate metabolism, (d) phenylalanine, tyrosine and tryptophan biosynthesis, (f) butanoate metabolism, (h) arginine and proline metabolism, (j) arginine biosynthesis, and (k) nicotinate and nicotinamide metabolism. The pathways in serum included (l) linoleic acid metabolism. The detailed results of the pathway analysis are shown in Table 2 and summarized in Figure 2.
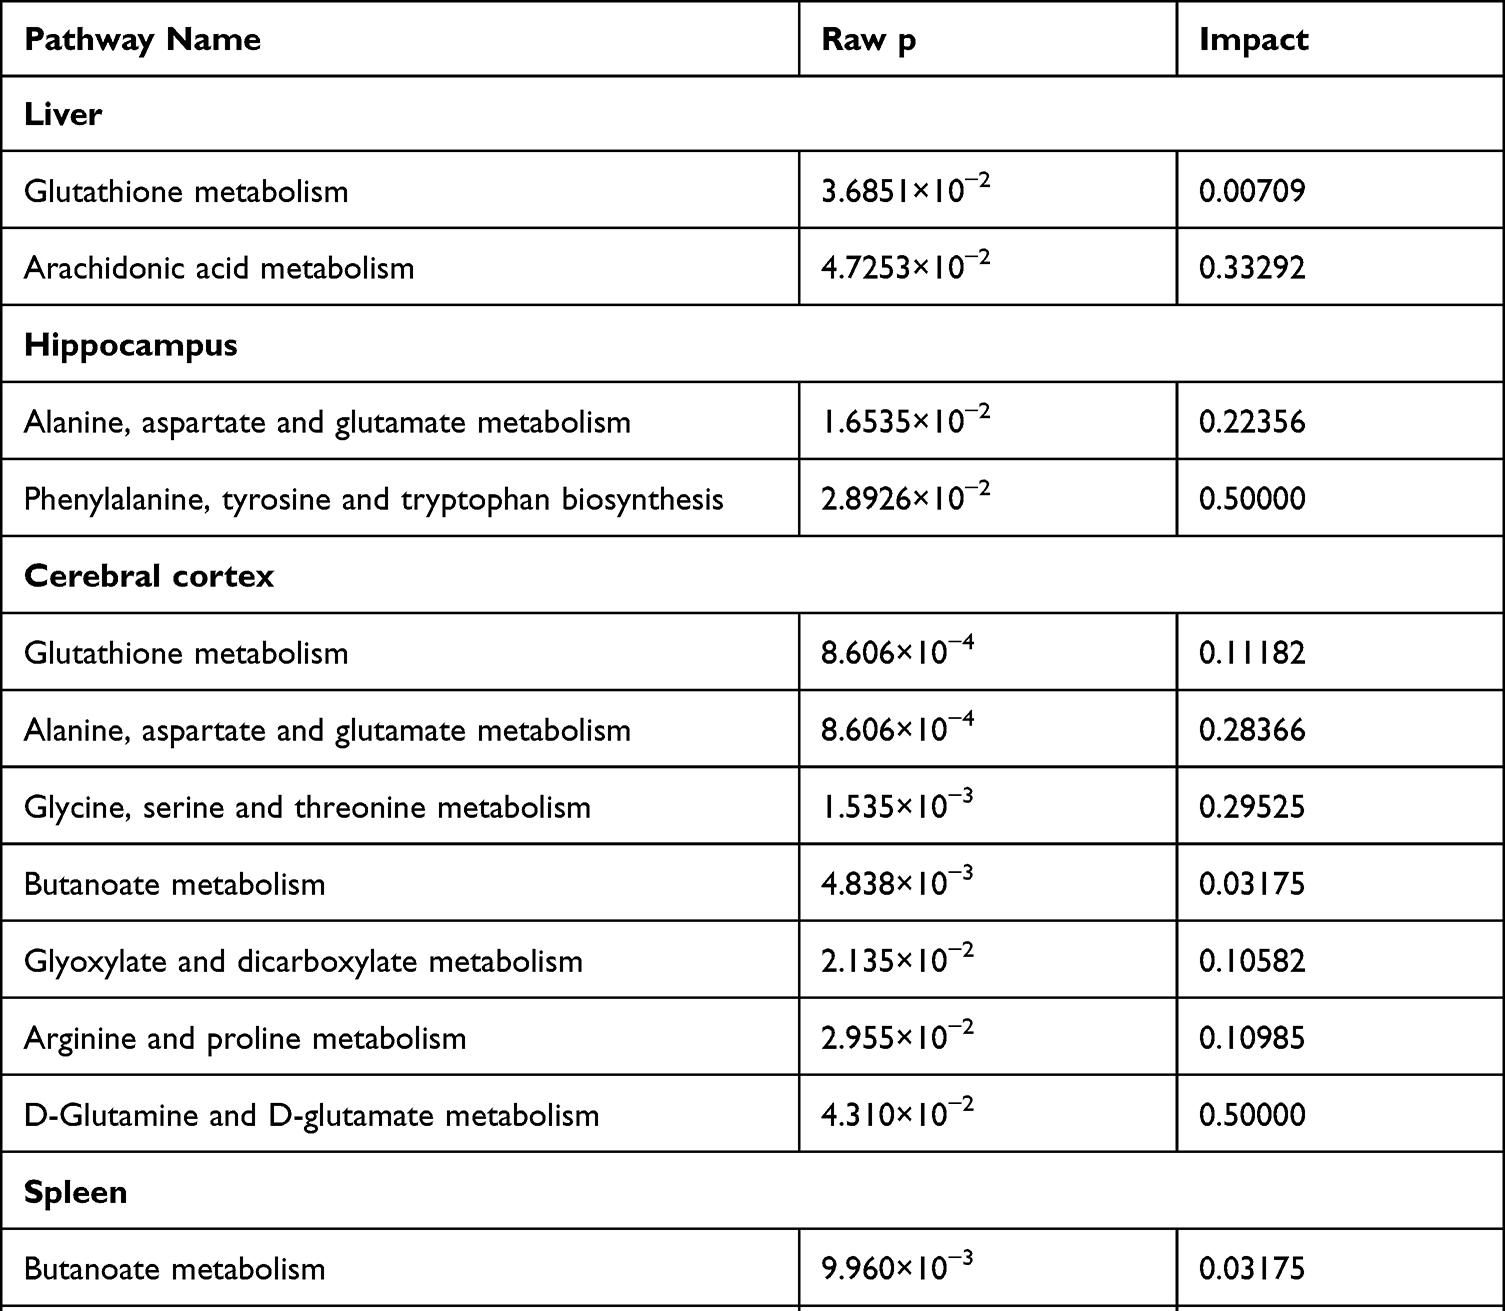 |
Table 2 Pathway Analysis Results Produced Using MetaboAnalyst 5.0. (Raw p < 0.05, Impact > 0) |
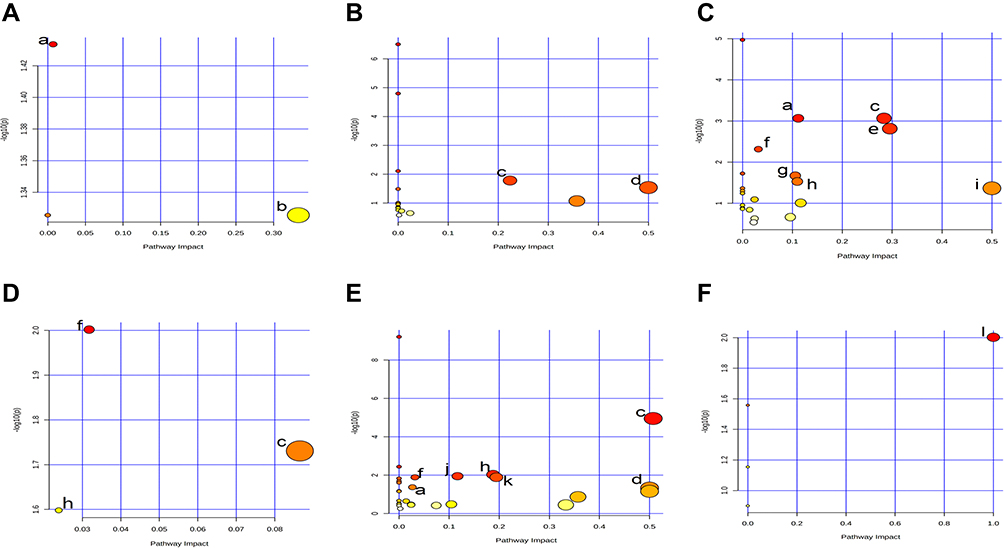 |
Figure 2 Pathway analysis diagram performed using MetaboAnalyst 5.0. (A) Liver: (a) Glutathione metabolism; (b) Arachidonic acid metabolism. (B) Hippocampus: (c) Alanine, aspartate and glutamate metabolism; (d) Phenylalanine, tyrosine and tryptophan biosynthesis. (C) Cerebral cortex: (a) Glutathione metabolism; (c) Alanine, aspartate and glutamate metabolism; (e) Glycine, serine and threonine metabolism; (f) Butanoate metabolism; (g) Glyoxylate and dicarboxylate metabolism; (h) Arginine and proline metabolism; (i) D-Glutamine and D-glutamate metabolism. (D) Spleen: (c) Alanine, aspartate and glutamate metabolism; (f) Butanoate metabolism; (h) Arginine and proline metabolism. (E) Kidney: (a) Glutathione metabolism; (c) Alanine, aspartate and glutamate metabolism; (d) Phenylalanine, tyrosine and tryptophan biosynthesis; (f) Butanoate metabolism; (h) Arginine and proline metabolism; (j) Arginine biosynthesis; (k) Nicotinate and nicotinamide metabolism. (F) Serum: (l) Linoleic acid metabolism. |
Discussion
Clinical evidence has shown that the toxic effects of VPA are manifested in the liver, but toxic effects on other organs have been rarely reported. Despite increasing evidence derived from studies on the toxic mechanisms of VPA, extensive tissue metabolomics research is currently lacking. Previous metabolomic studies of VPA-induced toxicity focused mainly on changes in serum and urine and did not focus on the main organs and tissues. For the first time, we evaluated the main organs and tissues in mice (intestine, lung, liver, hippocampus, cerebral cortex, inner ear, spleen, kidney, heart, and serum) using multivariate statistical analysis to comprehensively investigate VPA-related organ toxicity and in vivo potential biomarkers.
Using GC-MS, we identified 5, 2, 6, 11, 11, 6, 3, 18, 7, and 3 metabolites in the intestine, lung, liver, hippocampus, cerebral cortex, inner ear, spleen, kidney, heart, and serum, respectively, which were shown to be differentially abundant in response to treatment with VPA. Some differential metabolites were also found in these tissues and organs. Studying the levels of metabolites in these tissues and organs will help us to more thoroughly understand the metabolic pathways in which these differential metabolites participate. Metaboanalyst 5.0 was used to analyze the metabolic pathways associated with VPA treatment. These identified metabolites were involved in 12 metabolic pathways, including amino acid metabolism, fatty acid metabolism, energy metabolism, and nucleotide metabolism. The relationships among metabolites are shown in Figure 3. Therefore, the toxicity induced by VPA lies in its interference with amino acid metabolism, fatty acid metabolism, energy metabolism, and nucleotide metabolism. Potential biomarkers (marked in red in Figure 3) were identified from the OPLS–DA data along with VIP (VIP >1) and p-values arising from the t-tests (p<0.05) compared to healthy controls. These potential biomarkers exist in the heart, liver, kidney, hippocampus, and cerebral cortex.
 |
Figure 3 Schematic diagram of related metabolic pathways affected by VPA processing in the main tissues. Black arrows indicate the glycolysis and citrate cycle. Green arrows indicate the glutathione metabolism. Green frame and black line indicate arachidonic acid metabolism. Red arrows indicate the alanine, aspartate and glutamate metabolism. Dark blue arrows indicate Phenylalanine, tyrosine and tryptophan biosynthesis. Orange arrows indicate glycine, serine and threonine metabolism. Purple arrows indicate butanoate metabolism. Pink arrows indicate Glyoxylate and dicarboxylate metabolism. Yellow arrows indicate the arginine and proline metabolism. Light blue arrows indicate arginine biosynthesis and urea cycle. Metabolites marked in red represent potential biomarkers identified in the study. |
Based on the number of differential metabolites in various organs and the associated metabolic pathways, we inferred that the kidney was the most severely affected organ in terms of metabolism, followed by the hippocampus and the cerebral cortex. This finding was consistent with the nephrotoxicity and neurotoxicity associated with VPA. Furthermore, VPA also induced liver toxicity and cardiotoxicity in association with the metabolic changes. The metabolic effects in the different organs are discussed separately below.
Brain Tissue
A previous study showed that a high concentration of VPA induced neurotoxicity,31 and the mechanism may have been related to oxidative stress.32 Excessive release of reactive oxygen species (ROS) is the root cause of oxidative stress,33 and is a significant risk factor for tissue injury and organ dysfunction.34 Some studies have indicated that ROS production and oxidative stress may be mechanisms of VPA-induced neurotoxicity.35 Inhibition of the central nervous system is the most common manifestation of VPA neurotoxicity, resulting in a variety of symptoms, from mild drowsiness to deep coma or fatal brain edema. Furthermore, VPA interferes with the development of hippocampal and cerebellar neurons and can lead to cognitive and behavioral changes, learning deficits, and motor dysfunction.36
Disordered amino acid metabolism can induce progressive brain damage. Amino acids can be used as biomarkers for research focused on the mechanisms of disease onset and progression. Compared to the control group, the levels of phenylalanine, valine, isoleucine, serine, aspartic acid, alanine, threonine, cysteine, glutamic acid, and glycine increased significantly in the VPA group. The metabolic pathways involved included alanine, aspartate, and glutamate metabolism; glutathione metabolism; glycine, serine, and threonine metabolism; butanoate metabolism; glyoxylate and dicarboxylate metabolism; arginine and proline metabolism; D-glutamine and D-glutamate metabolism; and phenylalanine, tyrosine, and tryptophan biosynthesis. Glutamate plays an essential role in brain metabolism. It is the main excitatory neurotransmitter and the precursor of the main inhibitory neurotransmitter, GABA, in the central nervous system.37 Increased glutamate in this study was consistent with the findings from a previous study by Puig-Lagunes et al.38 Glutamate dehydrogenase (GDH) is a key enzyme in glutamate metabolism and is directly involved in the onset and progression of epilepsy. It is an important regulatory enzyme for maintaining the appropriate balance of glutamate and GABA levels, and it helps regulate neuronal excitability. Glutamate dehydrogenase can increase glutamate utilization and decrease glutamate levels, resulting in low neuronal excitability, which may contribute to the antiepileptic properties of VPA.39 Furthermore, VPA can also interfere with mitochondrial metabolism and induce hyperammonemia, resulting in a shift in glutamine/glutamate equilibrium toward glutamine through increased amidation of glutamate.40
Aspartic acid is an important amino acid in biosynthesis. It is the synthetic precursor of other amino acids including lysine, threonine, and isoleucine and is also a precursor for purine and pyrimidine bases. Aspartic acid is an excitatory neurotransmitter in brain synapses and has increased in patients with epilepsy and stroke,41 and decreased in patients with depression and brain atrophy. It is a non-essential amino acid, which participates in the ornithine cycle, promotes the conversion of oxygen and carbon dioxide into urea, reduces the content of nitrogen and carbon dioxide in the blood and reduces the appearance of neurotoxicity.42 In this study, we observed an increase in aspartic acid levels in the whole brain in response to VPA treatment, which was attributed to a significant increase in levels in the hippocampus and cerebral cortex. These findings contradicted the experimental findings obtained by Kharlamov et al.43 The authors found that the concentration of aspartic acid in the brain was significantly reduced in response to VPA treatment and suggested that this change in aspartic acid levels could be related to the sedative effect of VPA. This discrepancy may reflect differences in experimental species and experimental methods.
Liver
Sodium VPA-mediated liver toxicity is a fatal and irreversible reaction characterized by microcystic steatosis and necrosis.44 Compared to the control group, there were significant differences in the levels of metabolites of arachidonic acid, pyroglutamic acid, palmitelaidic acid, 5-methyluridine, 1-monopalmitin, and glycerol monostearate in the VPA group. The metabolic pathways involved included glutathione metabolism and arachidonic acid metabolism. Arachidonic acid is an important human essential fatty acid and is the most abundant fatty acid widely distributed in the human body. Arachidonic acid is the direct precursor for the synthesis of eicosanoids such as prostaglandins, thromboxanes, and leukotrienes. These biologically active substances induce important effects on the human liver, cardiovascular system, and immune system. The cytoprotective effects of prostaglandins have been shown in experiments using intact animals, isolated and perfused livers, and isolated hepatocytes.45 Leukotrienes can cause liver injury, which can be related to vasoconstriction, oxygen free radical damage, and interactions with other inflammatory mediators. Therefore, reduced levels of arachidonic acid may be a cause of liver toxicity.
Palmitelaidic acid is a saturated fatty acid widely present in human organs and tissues as a free fatty acid.46 In hepatocytes, it can promote stress and apoptosis of the endoplasmic reticulum through the PERK/ATF4/CHOP signaling pathway,47 which can contribute to liver toxicity. Compared to unsaturated fatty acids, the toxic effect of palmitelaidic acid may be due to fewer esterifications and incorporation into triglycerides.48 A previous study showed that palmitelaidic acid was elevated in patients with nonalcoholic fatty liver disease and was positively correlated with disease severity.49
Kidneys
The kidney is an essential metabolic organ in the human body. The primary function of the kidney is to produce urine and to remove metabolites and waste products. In addition, the kidney can retain water and other important substances, such as glucose, proteins, and amino acids, through re-absorption, which maintains the water, electrolyte, and acid-base homeostasis. VPA-induced kidney damage is associated with increased serum liver enzymes and decreased plasma albumin. Additionally, VPA can reduce the rate of glomerular filtration, which is manifested by increased levels of uric acid and serum creatinine, and decreased blood flow.13
The metabolites that were differentially abundant in the mouse kidney were mainly amino acids. L-alanine, L-isoleucine, L-proline, L-aspartic acid, L-methionine, L-glutamic acid, and L-phenylalanine levels increased to varying degrees in response to treatment with VPA. The metabolic pathways involved included alanine, aspartate, and glutamate metabolism; arginine and proline metabolism; arginine biosynthesis; butanoate metabolism; nicotinate and nicotinamide metabolism; glutathione metabolism; and phenylalanine, tyrosine, and tryptophan biosynthesis. Phenylalanine is an essential aromatic amino acid. Most phenylalanine in the body is oxidized to tyrosine by phenylalanine hydroxylase, which is important in neurotransmitter synthesis, sugar metabolism, and fat metabolism.50 Impaired renal function results in reduced transformation of phenylalanine to tyrosine, leading to increased phenylalanine concentration and reduced tyrosine concentration, and this reduced the tyrosine/phenylalanine ratio in plasma and many tissues. These changes affect the normal physiological function of the kidney.51
Proline is a non-essential amino acid that can be formed from glutamic acid and ornithine. It can be incorporated into tissue proteins and then hydroxylated to form hydroxyproline. Hyperprolinemia is an inherited metabolic disorder resulting from insufficient function of the enzyme that metabolizes proline, leading to accumulation of proline in the body. Studies have shown that the injection of L-proline into hippocampal neurons can induce neuronal damage. The resulting toxic effects may be related to neurological and cognitive deficits associated with hyperprolinemia.52 In addition, proline can induce oxidative stress and apoptosis, resulting in kidney damage, since proline can alter the activity of antioxidant enzymes and/or stimulate lipid peroxidation.53
Heart
Oxidative stress is a known cause of heart injury. Long-term treatment with VPA may alter the balance of oxidation/antioxidants in the heart, resulting in oxidative stress and an increased risk of atherosclerosis.54 A previous study showed that VPA administration resulted in increased cardiac lipid peroxidation and cardiac injury.55
Compared to the control group, the levels of lactic acid, stearic acid, L-valine, serine, L-threonine, L-proline, and inosine were significantly different in the VPA group. Valine is an essential branched chain amino acid (BCAA). In addition, leucine and isoleucine are also BCAAs. Catabolism of most amino acids occurs in the liver. On the contrary, BCAA catabolism occurs mainly in the heart, brain, skeletal muscle, and kidneys.56 Increased levels of BCAA often accompany heart damage. High concentrations of BCAA are associated with an increased risk of cardiovascular disease and plasma levels of BCAA circulating are positively correlated with the severity of coronary heart disease.57 Branched chain amino acids induced damage to mouse cardiomyocytes by generating excessive ROS and enhancing autophagy. In addition, activation of the AMPK-ULK1 signaling pathway has been shown to be involved in BCAA-induced enhancement of autophagy.58 Furthermore, BCAA enhanced glycolysis and fatty acid oxidation in mouse heart tissue, exacerbated lipid peroxidation-induced toxicity, and enhanced GCN2/ATF6/PPAR-α signaling, which resulted in enhanced susceptibility to myocardial ischemia/reperfusion injury.59 These results indicated that BCAA are not only important nutrients, but also play a key role in certain cardiovascular diseases. In addition, a differential metabolic pathway, linoleic acid metabolism, occurs in the serum.
Serum
There were significant differences in serum levels of endogenous metabolites between VPA-intoxicated mice and control mice, and those with statistical significance were urea, serine, and 9,12-octadecadienoic acid (linoleic acid). VPA could induce hyperammonemia, but its production mechanism is still not fully understood. Some studies have shown that it might be related to the urea cycle. Under normal metabolic conditions, acyl-CoA is transported into the mitochondria via a carnitine transport system. It is then converted to acetyl-CoA via β-oxidation and eventually to N-acetyl glutamate. This pathway can be interrupted by the introduction of VPA, leading to a reduction in free coenzyme A, acetyl-CoA, and carnitine, and resulting in a decreased availability of cofactors necessary for the function of the urea cycle. Since this is the primary mode of ammonia metabolism, patients taking VPA may experience severe elevations in serum ammonia levels, leading to hyperammonemia.60
Linoleic acid (LA) is an ω-6 polyunsaturated fatty acid (PUFA). LA is the most abundant ω-6 PUFA in human diets and in human serum and membrane lipids.61 LA is positively correlated with the increased prevalence of various pathological conditions, including VPA poisoning.62 LA can be enzymatically converted to bioactive oxidized LA metabolites (OXLAMs), primarily via the actions of cellular lipoxygenases [arachidonate 15-lipoxygenase (ALOX15) and ALOX15B in humans, and ALOX15 (12/15-LO) in rodents] or nonenzymatically via free radical–mediated oxidation in response to oxidative stress.63 OXLAMs are involved in a variety of intracellular signaling pathways and may induce pro-inflammatory responses in different cell types. OXLAM can increase in patients with nonalcoholic fatty liver, and the decrease in the serum OXLAM level is related to an improvement in liver histology in these patients.64
Study Limitations
In this study we used GC-MS to evaluate the metabolomics profile. The experimental material used was plastic instead of glass material, which may have interfered with the chromatographic peaks.
Although MS/MS has the advantages of high sensitivity and specificity, its price and routine maintenance cost are high, and it also has high requirements on the temperature and humidity of the environment. At present, our laboratory has no conditions to provide this equipment. Most importantly, it has a slow test speed, an extended analysis time, and complex functions, which require technical staff who have undergone special training for a long time to operate, which significantly affects the efficiency of analysis work. Therefore, we decided not to choose MS/MS for metabolomic analysis.
Conclusions
To evaluate VPA-induced toxicity using GC-MS technique-based profiling, the main target organs and tissues (intestine, lung, liver, hippocampus, cerebral cortex, inner ear, spleen, kidney, heart, and serum) were used to systematically evaluate VPA-induced toxicity. Treatment with VPA induced changes in levels of some metabolites and several metabolic pathways were altered, indicating that VPA may induce oxidative stress in organs, neurotoxicity, and disordered amino acid, fatty acid, and energy metabolism. This metabolomics study provided a novel understanding of the potential mechanisms of VPA-induced toxicity.
Acknowledgments
This work was supported by the Key Research and Development Projects of Jining City (2021YXNS003).
Disclosure
The authors report no conflicts of interest in this work.
References
1. Blaheta RA, Nau H, Michaelis M, Cinatl J
2. de Silva M, MacArdle B, McGowan M, et al. Randomised comparative monotherapy trial of phenobarbitone, phenytoin, carbamazepine, or sodium valproate for newly diagnosed childhood epilepsy. Lancet. 1996;347(9003):709–713. doi:10.1016/S0140-6736(96)90074-4
3. Haddad PM, Das A, Ashfaq M, Wieck A. A review of valproate in psychiatric practice. Expert Opin Drug Metab Toxicol. 2009;5(5):539–551. doi:10.1517/17425250902911455
4. Ranger P, Ellenbroek BA. Perinatal Influences of Valproate on brain and behaviour: an animal model for autism. Curr Top Behav Neurosci. 2016;29:363–386.
5. Inada H, Chihara K, Yamashita A, et al. Evaluation of ovarian toxicity of sodium valproate (VPA) using cultured rat ovarian follicles. J Toxicol Sci. 2012;37(3):587–594. doi:10.2131/jts.37.587
6. Girish C, Shweta O, Raj V, Balakrishnan S, Varghese RG. Ellagic acid modulates sodium valproate induced reproductive toxicity in male Wistar rats. Indian J Physiol Pharmacol. 2014;58(4):416–422.
7. Khan S, Ahmad T, Parekh CV, Trivedi PP, Kushwaha S, Jena G. Investigation on sodium valproate induced germ cell damage, oxidative stress and genotoxicity in male Swiss mice. Reprod Toxicol. 2011;32(4):385–394. doi:10.1016/j.reprotox.2011.09.007
8. Alsdorf R, Wyszynski DF. Teratogenicity of sodium valproate. Expert Opin Drug Saf. 2005;4(2):345–353.
9. Valančiūtė A, Mozuraitė R, Balnytė I, Didžiapetrienė J, Matusevičius P, Stakišaitis D. Sodium valproate effect on the structure of rat glandule thymus: gender-related differences. Exp Toxicol Pathol. 2015;67(7–8):399–406. doi:10.1016/j.etp.2015.04.005
10. Huo T, Chen X, Lu X, Qu L, Liu Y, Cai S. An effective assessment of valproate sodium-induced hepatotoxicity with UPLC-MS and (1) HNMR-based metabolomics approach. J Chromatogr B Analyt Technol Biomed Life Sci. 2014;969:109–116. doi:10.1016/j.jchromb.2014.08.011
11. Shakya R, Hoque MK, Sapkota AS, Gupta PK. Differential hepatotoxic effects of sodium valproate at different doses in albino rats. Kathmandu Univ Med J. 2018;16(61):78–82. doi:10.3126/jkmc.v6i2.19808
12. Chen Y, Zhou J, Xu S, et al. Association between the perturbation of bile acid homeostasis and valproic acid-induced hepatotoxicity. Biochem Pharmacol. 2019;170:113669. doi:10.1016/j.bcp.2019.113669
13. El-Shenawy NS, Hamza RZ. Nephrotoxicity of sodium valproate and protective role of L-cysteine in rats at biochemical and histological levels. J Basic Clin Physiol Pharmacol. 2016;27(5):497–504. doi:10.1515/jbcpp-2015-0106
14. Mazzoccoli G, Longhitano C, Vinciguerra M. Cardio-hepatic metabolic derangements and valproic acid. Curr Clin Pharmacol. 2014;9(2):165–170. doi:10.2174/1574884708999140101144839
15. Hisaki T, Kaneko MAN, Hirota M, Matsuoka M, Kouzuki H. Integration of read-across and artificial neural network-based QSAR models for predicting systemic toxicity: a case study for valproic acid. J Toxicol Sci. 2020;45(2):95–108. doi:10.2131/jts.45.95
16. Bujak R, Struck-Lewicka W, Markuszewski MJ, Kaliszan R. Metabolomics for laboratory diagnostics. J Pharm Biomed Anal. 2015;113:108–120. doi:10.1016/j.jpba.2014.12.017
17. Segers K, Declerck S, Mangelings D, Heyden YV, Eeckhaut AV. Analytical techniques for metabolomic studies: a review. Bioanalysis. 2019;11(24):2297–2318. doi:10.4155/bio-2019-0014
18. Beale DJ, Pinu FR, Kouremenos KA, et al. Review of recent developments in GC-MS approaches to metabolomics-based research. Metabolomics. 2018;14(11):152. doi:10.1007/s11306-018-1449-2
19. Sun J, Schnackenberg LK, Hansen DK, Beger RD. Study of valproic acid-induced endogenous and exogenous metabolite alterations using LC-MS-based metabolomics. Bioanalysis. 2010;2(2):207–216. doi:10.4155/bio.09.173
20. Lee MS, Jung BH, Chung BC, et al. Metabolomics study with gas chromatography-mass spectrometry for predicting valproic acid-induced hepatotoxicity and discovery of novel biomarkers in rat urine. Int J Toxicol. 2009;28(5):392–404. doi:10.1177/1091581809340329
21. Said SA, El-Agamy DS. Prevention of sodium valproate-induced hepatotoxicity by curcumin, rosiglitazone and N-acetylcysteine in rats. Arzneimittelforschung. 2010;60(11):647–653. doi:10.1055/s-0031-1296342
22. Turkyilmaz IB, Altas N, Arisan I, Yanardag R. Effect of vitamin B(6) on brain damage in valproic acid induced toxicity. J Biochem Mol Toxicol. 2021;35(9):e22855. doi:10.1002/jbt.22855
23. Joshi R, Reeta KH, Sharma SK, Tripathi M, Gupta YK. Panchagavya Ghrita, an Ayurvedic formulation attenuates seizures, cognitive impairment and oxidative stress in pentylenetetrazole induced seizures in rats. Indian J Exp Biol. 2015;53(7):446–451.
24. Pragnya B, Kameshwari JS, Veeresh B. Ameliorating effect of piperine on behavioral abnormalities and oxidative markers in sodium valproate induced autism in BALB/C mice. Behav Brain Res. 2014;270:86–94. doi:10.1016/j.bbr.2014.04.045
25. Sugimoto T, Araki A, Nishida N, et al. Hepatotoxicity in rat following administration of valproic acid: effect of L-carnitine supplementation. Epilepsia. 1987;28(4):373–377. doi:10.1111/j.1528-1157.1987.tb03660.x
26. Simpson RJ. Homogenization of mammalian tissue. Cold Spring Harb Protoc. 2010;2010(7):
27. Qamar W, Alqahtani S, Ahamad SR, Ali N, Altamimi MA. Untargeted GC-MS investigation of serum metabolomics of coronary artery disease patients. Saudi J Biol Sci. 2020;27(12):3727–3734. doi:10.1016/j.sjbs.2020.08.019
28. Wen C, Zhang M, Ma J, Hu L, Wang X, Lin G. Urine metabolomics in rats after administration of ketamine. Drug Des Devel Ther. 2015;9:717–722. doi:10.2147/DDDT.S76898
29. Liu S, Wang F, Mei W, Tao L. [GC-MS determination of metabolites in rat kidneys]. Zhong Nan Da Xue Xue Bao. 2013;38(7):661–669. Chinese. doi:10.3969/j.issn.1672-7347.2013.07.002
30. Geng C, Cui C, Wang C, et al. Systematic evaluations of doxorubicin-induced toxicity in rats based on metabolomics. ACS Omega. 2021;6(1):358–366. doi:10.1021/acsomega.0c04677
31. Gravemann U, Volland J, Nau H. Hydroxamic acid and fluorinated derivatives of valproic acid: anticonvulsant activity, neurotoxicity and teratogenicity. Neurotoxicol Teratol. 2008;30(5):390–394. doi:10.1016/j.ntt.2008.03.060
32. Chaudhary S, Parvez S. An in vitro approach to assess the neurotoxicity of valproic acid-induced oxidative stress in cerebellum and cerebral cortex of young rats. Neuroscience. 2012;225:258–268. doi:10.1016/j.neuroscience.2012.08.060
33. Marrocco I, Altieri F, Peluso I. Measurement and clinical significance of biomarkers of oxidative stress in humans. Oxid Med Cell Longev. 2017;2017:6501046. doi:10.1155/2017/6501046
34. Fourcade S, Ruiz M, Guilera C, et al. Valproic acid induces antioxidant effects in X-linked adrenoleukodystrophy. Hum Mol Genet. 2010;19(10):2005–2014. doi:10.1093/hmg/ddq082
35. Kiang TK, Teng XW, Karagiozov S, Surendradoss J, Chang TK, Abbott FS. Role of oxidative metabolism in the effect of valproic acid on markers of cell viability, necrosis, and oxidative stress in sandwich-cultured rat hepatocytes. Toxicol Sci. 2010;118(2):501–509. doi:10.1093/toxsci/kfq294
36. Verrotti A, Scaparrotta A, Cofini M, Chiarelli F, Tiboni GM. Developmental neurotoxicity and anticonvulsant drugs: a possible link. Reprod Toxicol. 2014;48:72–80. doi:10.1016/j.reprotox.2014.04.005
37. El Hage M, Conjard-Duplany A, Baverel G, Martin G. Metabolic fate of a high concentration of glutamine and glutamate in rat brain slices: a 13C NMR study. Neurochem Int. 2011;58(8):896–903. doi:10.1016/j.neuint.2011.02.018
38. Puig-Lagunes ÁA, Rocha L, Morgado-Valle C, BeltrÁn-Parrazal L, LÓpez-Meraz ML. Brain and plasma amino acid concentration in infant rats prenatally exposed to valproic acid. An Acad Bras Cienc. 2021;93(2):e20190861. doi:10.1590/0001-3765202120190861
39. Rasgado LA, Reyes GC, Díaz FV. Modulation of brain glutamate dehydrogenase as a tool for controlling seizures. Acta Pharm. 2015;65(4):443–452. doi:10.1515/acph-2015-0033
40. Garcia M, Huppertz HJ, Ziyeh S, Buechert M, Schumacher M, Mader I. Valproate-induced metabolic changes in patients with epilepsy: assessment with H-MRS. Epilepsia. 2009;50(3):486–492. doi:10.1111/j.1528-1167.2008.01801.x
41. Rainesalo S, Keränen T, Palmio J, Peltola J, Oja SS, Saransaari P. Plasma and cerebrospinal fluid amino acids in epileptic patients. Neurochem Res. 2004;29(1):319–324. doi:10.1023/B:NERE.0000010461.34920.0c
42. Gillessen T, Budd SL, Lipton SA. Excitatory amino acid neurotoxicity. Adv Exp Med Biol. 2002;513:3–40. doi:10.1007/978-1-4615-0123-7_1
43. Kharlamov AN, Kovalev GI, Shumkova OV. [Effect of sodium valproate on the mediator amino acid content in the rat brain]. Farmakol Toksikol. 1982;45(5):31–34. Turkish.
44. Tong V, Teng XW, Chang TK, Abbott FS. Valproic acid I: time course of lipid peroxidation biomarkers, liver toxicity, and valproic acid metabolite levels in rats. Toxicol Sci. 2005;86(2):427–435. doi:10.1093/toxsci/kfi184
45. Quiroga J, Prieto J. Liver cytoprotection by prostaglandins. Pharmacol Ther. 1993;58(1):67–91. doi:10.1016/0163-7258(93)90067-N
46. Tsai YW, Lu CH, Chang RC, Hsu YP, Ho LT, Shih KC. Palmitoleic acid ameliorates palmitic acid-induced proinflammation in J774A.1 macrophages via TLR4-dependent and TNF-α-independent signallings. Prostaglandins Leukot Essent Fatty Acids. 2021;169:102270. doi:10.1016/j.plefa.2021.102270
47. Cao J, Dai DL, Yao L, et al. Saturated fatty acid induction of endoplasmic reticulum stress and apoptosis in human liver cells via the PERK/ATF4/CHOP signaling pathway. Mol Cell Biochem. 2012;364(1–2):115–129. doi:10.1007/s11010-011-1211-9
48. Listenberger LL, Han X, Lewis SE, et al. Triglyceride accumulation protects against fatty acid-induced lipotoxicity. Proc Natl Acad Sci U S A. 2003;100(6):3077–3082. doi:10.1073/pnas.0630588100
49. Diraison F, Moulin P, Beylot M. Contribution of hepatic de novo lipogenesis and reesterification of plasma non esterified fatty acids to plasma triglyceride synthesis during non-alcoholic fatty liver disease. Diabetes Metab. 2003;29(5):478–485. doi:10.1016/S1262-3636(07)70061-7
50. Møller N, Meek S, Bigelow M, Andrews J, Nair KS. The kidney is an important site for in vivo phenylalanine-to-tyrosine conversion in adult humans: a metabolic role of the kidney. Proc Natl Acad Sci U S A. 2000;97(3):1242–1246. doi:10.1073/pnas.97.3.1242
51. Kopple JD. Phenylalanine and tyrosine metabolism in chronic kidney failure. J Nutr. 2007;137(6Suppl 1):
52. Nadler JV, Wang A, Hakim A. Toxicity of L-proline toward rat hippocampal neurons. Brain Res. 1988;456(1):168–172. doi:10.1016/0006-8993(88)90358-7
53. Li H, Xing L, Zhang M, Wang J, Zheng N. The toxic effects of Aflatoxin B1 and Aflatoxin M1 on kidney through regulating L-Proline and downstream apoptosis. Biomed Res Int. 2018;2018:9074861. doi:10.1155/2018/9074861
54. Verrotti A, Scardapane A, Franzoni E, Manco R, Chiarelli F. Increased oxidative stress in epileptic children treated with valproic acid. Epilepsy Res. 2008;78(2–3):171–177. doi:10.1016/j.eplepsyres.2007.11.005
55. Emekli-Alturfan E, Alev B, Tunali S, et al. Effects of edaravone on cardiac damage in valproic acid induced toxicity. Ann Clin Lab Sci. 2015;45(2):166–172.
56. Neinast M, Murashige D, Arany Z. Branched chain amino acids. Annu Rev Physiol. 2019;81(1):139–164. doi:10.1146/annurev-physiol-020518-114455
57. Tobias DK, Lawler PR, Harada PH, et al. Circulating branched-chain amino acids and incident cardiovascular disease in a prospective cohort of US women. Circ Genom Precis Med. 2018;11(4):e002157. doi:10.1161/CIRCGEN.118.002157
58. Jiang YJ, Sun SJ, Cao WX, et al. Excessive ROS production and enhanced autophagy contribute to myocardial injury induced by branched-chain amino acids: roles for the AMPK-ULK1 signaling pathway and α7nAChR. Biochim Biophys Acta Mol Basis Dis. 2021;1867(1):165980. doi:10.1016/j.bbadis.2020.165980
59. Li Y, Xiong Z, Yan W, et al. Branched chain amino acids exacerbate myocardial ischemia/reperfusion vulnerability via enhancing GCN2/ATF6/PPAR-α pathway-dependent fatty acid oxidation. Theranostics. 2020;10(12):5623–5640. doi:10.7150/thno.44836
60. Chan E, McQueen F. Valproate-induced hyperammonaemia superimposed upon severe neuropsychiatric lupus: a case report and review of the literature. Clin Rheumatol. 2013;32(3):403–407. doi:10.1007/s10067-012-2150-x
61. Kirpich IA, Petrosino J, Ajami N, et al. Saturated and unsaturated dietary fats differentially modulate ethanol-induced changes in gut microbiome and metabolome in a mouse model of alcoholic liver disease. Am J Pathol. 2016;186(4):765–776. doi:10.1016/j.ajpath.2015.11.017
62. Blasbalg TL, Hibbeln JR, Ramsden CE, Majchrzak SF, Rawlings RR. Changes in consumption of omega-3 and omega-6 fatty acids in the United States during the 20th century. Am J Clin Nutr. 2011;93(5):950–962. doi:10.3945/ajcn.110.006643
63. Warner DR, Liu H, Miller ME, et al. Dietary linoleic acid and its oxidized metabolites exacerbate liver injury caused by ethanol via induction of hepatic proinflammatory response in mice. Am J Pathol. 2017;187(10):2232–2245. doi:10.1016/j.ajpath.2017.06.008
64. Feldstein AE, Lopez R, Tamimi TA, et al. Mass spectrometric profiling of oxidized lipid products in human nonalcoholic fatty liver disease and nonalcoholic steatohepatitis. J Lipid Res. 2010;51(10):3046–3054. doi:10.1194/jlr.M007096
 © 2022 The Author(s). This work is published and licensed by Dove Medical Press Limited. The
full terms of this license are available at https://www.dovepress.com/terms
and incorporate the Creative Commons Attribution
- Non Commercial (unported, 3.0) License.
By accessing the work you hereby accept the Terms. Non-commercial uses of the work are permitted
without any further permission from Dove Medical Press Limited, provided the work is properly
attributed. For permission for commercial use of this work, please see paragraphs 4.2 and 5 of our Terms.
© 2022 The Author(s). This work is published and licensed by Dove Medical Press Limited. The
full terms of this license are available at https://www.dovepress.com/terms
and incorporate the Creative Commons Attribution
- Non Commercial (unported, 3.0) License.
By accessing the work you hereby accept the Terms. Non-commercial uses of the work are permitted
without any further permission from Dove Medical Press Limited, provided the work is properly
attributed. For permission for commercial use of this work, please see paragraphs 4.2 and 5 of our Terms.