Back to Journals » OncoTargets and Therapy » Volume 14
Comprehensive Analysis of Gene Expression Changes and Validation in Hepatocellular Carcinoma
Authors Zhang H, Liu R, Sun L, Guo W, Ji X, Hu X ![]()
Received 27 November 2020
Accepted for publication 3 February 2021
Published 15 February 2021 Volume 2021:14 Pages 1021—1031
DOI https://doi.org/10.2147/OTT.S294500
Checked for plagiarism Yes
Review by Single anonymous peer review
Peer reviewer comments 3
Editor who approved publication: Dr Federico Perche
Hao Zhang,1 Renzheng Liu,1 Lin Sun,2 Weidong Guo,1 Xiaoyue Ji,3 Xiao Hu1
1Department of Hepatobiliary Pancreatic Surgery, The Affiliated Hospital of Qingdao University, Qingdao, Shandong, People’s Republic of China; 2Department of ICU, The Affiliated Hospital of Qingdao University, Qingdao, Shandong, People’s Republic of China; 3Department of Ophthalmology, The Affiliated Hospital of Qingdao University, Qingdao, Shandong, People’s Republic of China
Correspondence: Xiao Hu
Department of Hepatobiliary Pancreatic Surgery, The Affiliated Hospital of Qingdao University, 16 Jiangsu Road, Qingdao, Shandong, People’s Republic of China
Tel +86 18661808808
Email [email protected]
Aim: This study aimed to analyze the involvement of hub genes in hepatocellular carcinoma.
Methods: Four series were used in this study: GSE45267, GSE84402, and GSE101685 from GPL570 platform in the Gene Expression Omnibus and the other from The Cancer Genome Atlas. The gene audition was completed using R software and Venn diagrams. The outcome, Gene Ontology enrichment, and Kyoto Encyclopedia of Genes and Genomes preliminary analyses of differentially expressed genes were performed using the R software. A string image was obtained using the Search Tool for the Retrieval of Interacting Genes. The protein–protein interaction network was examined using Cytoscape software. The corrplot package was used to analyze the correlation of genes. Human Protein Atlas was used to confirm the protein levels. Univariate Cox regression was used to analyze whether these genes were related to survival. UALCAN was used to confirm the effect of these genes on patient survival.
Results: A total of 107 differentially expressed genes from 491 patients with hepatocellular carcinoma and 119 normal individuals were selected in this study. Cytoscape revealed 25 central nodes from the 107 genes. CCNB1, CDK1, CCNA2, PTTG1, and CDC20 were selected based on the cell cycle pathway. A significant correlation was found among the 6 DEGs. The transcription levels and protein levels of these genes were verified in cells and human tissue samples. The overall survival for these genes was analyzed using univariate Cox regression and UALCAN.
Conclusion: CCNB1, CDK1, CDC20, PTTG1, CCNA2, and TTK were overexpressed and correlated in hepatocellular carcinoma cells and tumors. The results might help explore the prognosis and diagnostic markers of HCC.
Keywords: cell cycle, differentially expressed genes network analysis, hepatocellular carcinoma, oncogene, prognosis analysis
Introduction
Hepatocellular carcinoma (HCC) is a liver disease with poor prognosis; it is the sixth most common malignancy worldwide.1 The treatment methods for HCC are abundant in clinical practice. Patients in different stages of illness adopt different treatment measures in the hospital, while the long-term survival remains poor.2 Hence, HCC needs to be analyzed from a different perspective. Researchers are involved in identifying the origin and development of HCC at the molecular level so as to achieve accurate treatment of HCC.
A DNA chip can detect differentially expressed genes (DEGs) quickly and accurately. After years of development, the technology has become mature and is widely used in public databases. Based on the databases, a series of processing is carried out to select the desired data. In recent years, researchers have analyzed a large amount of data on liver cancer, hoping to improve human health. The current research situation is gratifying, and the prospect of integrated bioinformatics methods is huge.
In the present study, the DEGs in 491 pathological liver tissues and 119 normal tissues were analyzed with R software in the interest of studying the potential valuable genes in HCC. The top genes were selected to construct a protein–protein interaction (PPI) network, and Cytoscape MCODE was used to screen out more valuable genes. The transcriptional levels were checked by quantitative real-time polymerase chain reaction and the protein levels were got from Human Protein Atlas (HPA). The effect of genes on the survival of patients with HCC were verified using the UALCAN-based Cancer Genome Atlas (TCGA) database. Finally, six genes overexpressed in HCC were obtained.
This study aimed to explore the prognosis and diagnostic markers of HCC. Four series were used in this study: GSE45267, GSE84402, GSE101685 and the other from TCGA. The gene audition was completed using R software and Venn diagrams. A total of 107 DEGs were selected in this study. Cytoscape revealed 25 central nodes from the 107 genes. CCNB1, CDK1, CCNA2, PTTG1, and CDC20 were selected based on the cell cycle pathway. CCNB1 and CDC20 had the highest correlation. The transcription levels were verified by quantitative real-time polymerase chain reaction and protein levels were verified from HPA. 6 DEGs were overexpressed and were associated with a significant overall survival in patients with HCC. The screening process in our study is reliable and has been applied in previous study.3–5
Materials and Methods
Clinical Samples and Ethics Statement
The ethics committee of the Affiliated Hospital of Qingdao University approved the study. This included 10 patients with HCC (5 men and 5 women) diagnosed pathologically between June 2018 and June 2019 in the Affiliated Hospital of Qingdao University (Shandong, China). They were aged 50–80 years. The tissues were sliced into small pieces and stored at –80°C. All adjacent noncancerous and cancerous tissues were simultaneously collected. The Institutional Review Board of the hospital approved the study in strict adherence to the Declaration of Helsinki protocol. The written informed consent form was signed by each patient.
Cell Culture
Immortalized human hepatocyte LO2 cells and human HCC cells (Huh7, Hep3B) were purchased from the Shanghai Institute for Cell Biological Science (Shanghai, China). The cells were cultured in Dulbecco’s modified Eagle’s medium supplemented with 10% fetal bovine serum, 100 U/mL penicillin, and 100 mg/mL streptomycin (Gibco; Thermo Fisher Scientifc, Inc., MA, USA).
Data Sources
Researchers submitted their own research data to Gene Expression Omnibus (GEO, https://www.ncbi.nlm.nih.gov/gds/) and The Cancer Genome Atlas (TCGA, https://www.cancer.gov/about-nci/organization/ccg/research/structural-genomics/tcga) to share data with other researchers freely around the world. We downloaded three series GSE45267, GSE84402, and GSE101685 from the GEO database, which were found in GPL570 Platforms ([HG-U133_Plus_2] Affymetrix Human Genome U133 Plus 2.0 Array) and 465 cases from The Cancer Genome Atlas (TCGA).
Data Processing of DEGs
The quality of GSE45267, GSE84402, and GSE101685 was evaluated using R software (Version 3.6.1). Since these are the probes of Affymetrix, Affy package (https://bioconductor.org/packages/release/bioc/html/affy.html) and AffyPLM package (http://bioconductor.org/packages/release/bioc/html/affyPLM.html) were used to parse the original data. The log scale robust multi-array analysis was applied to background correction, quantile normalization, and median polish in the R software.6 The first screening of genes was identified via the Linear Models for Microarray Data7(http://www.bioconductor.org/packages/release/bioc/html/limma.html) package (|logFC|>2 and adjusted P value <0.05). Venn software was used to find the commonly expressed DEGs among the four series. Corrplot package was used to analyze the correlation of genes.
GO and KEGG Pathway Analysis
Gene Ontology (GO) enrichment is used to define genes and their RNA or protein products so as to determine the unique biological characteristics of transcriptome and genomic data.8 Kyoto Encyclopedia of Genes and Genomes (KEGG) pathway is a collection of databases that can deal with genomes, drugs, diseases, chemical materials, and biological pathways.9 R software was used to analyze the DEG enrichment of biological process, molecular function, and cellular component and pathways.
PPI Network and Module Analysis
PPI information stemmed from an online tool Search Tool for the Retrieval of Interacting Genes (Version 11.0). In addition, the MCODE app in Cytoscape was used for checking cluster analysis of the PPI network (degree cutoff = 2, max. depth = 100, k-core = 2, and node score cutoff = 0.9) after analyzing the interaction between these DEGs in Cytoscape (Version 3.7.0) (maximum number of interactors = 0 and confidence score ≥0.4).10
RNA Extraction, Reverse Transcription, and Quantitative Real-Time Polymerase Chain Reaction
RNAiso Plus (TaKaRa, Tokyo, Japan) was used to deal with tissues. After getting total RNA, the quality of RNA was detected using a NanoDrop 2000 spectrophotometer (Thermo Fisher Scientific, Inc.). Next, a T100TM Thermal Cycler (Bio-Rad, USA) was used to perform reverse transcription with a PrimeScript RT reagent Kit and a gDNA Eraser (TaKaRa). Under the following conditions: 37°C for 15 min, 85°C for 30 s, and 4°C for 5 min, quantitative real-time polymerase chain reaction (PCR) was performed in a LightCycler 96 (Roche, Switzerland) with TB Green Premix Ex Taq (Tli RNase H Plus) (TaKaRa). The reaction was performed using the following conditions: initial denaturation at 95°C for 30 s; 40 cycles of 95°C for 30 s and 60°C for 30 s. The relative level of gene expression was calculated using the 2−ΔΔCt method. The primer sequences are listed in Table 1.
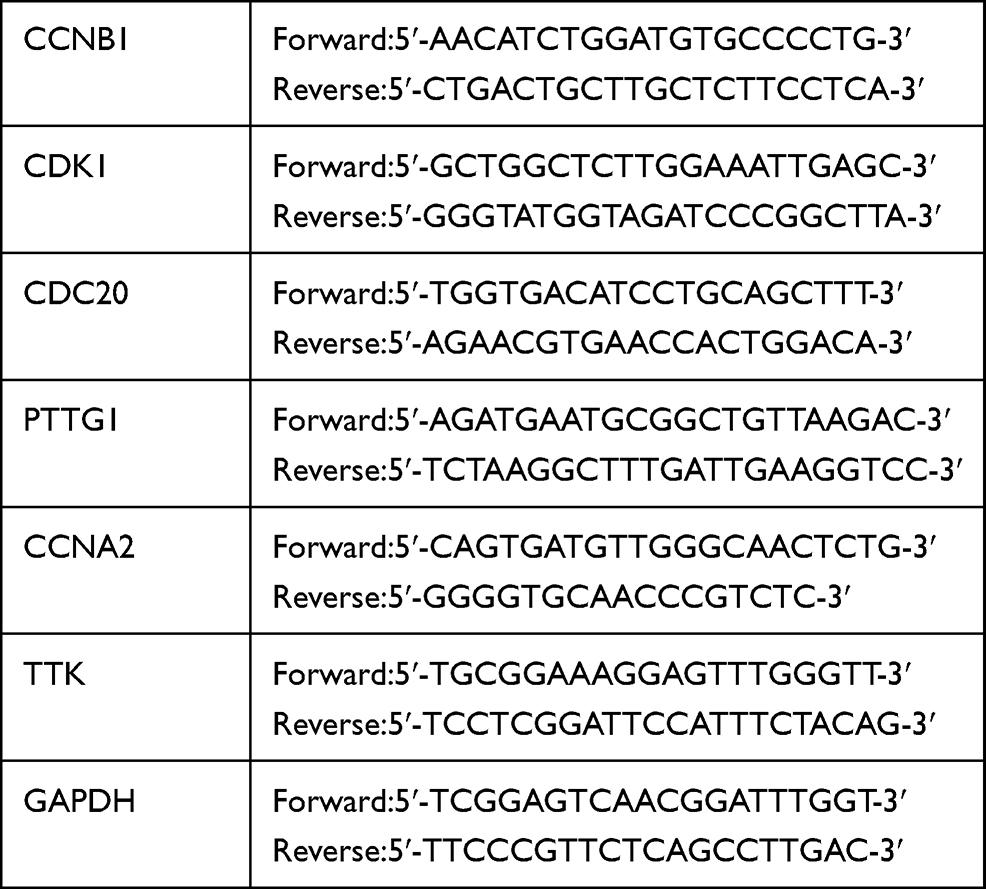 |
Table 1 Primer Sequences Used in the Study |
Protein Level, Survival Analysis and Correlation of DEGs
The protein level was checked by immunohistochemistry from HPA11 (http://www.proteinatlas.org/). Univariate Cox hazard analysis was used to look for genes related to survival. UALCAN is a user-friendly, comprehensive, interactive, and free web resource for analyzing cancer data from TCGA. The corrplot package was used to analyze the correlation of DEGs (P < 0.001).
Statistical Analysis
SPSS 24.0 software (IBM Corp, NY, USA) and GraphPad Prism 8 (GraphPad, USA) were used for statistical analysis. The 2−ΔΔCt method was USED to analyze the relative expression of genes. The Student t-test was used to analyze the difference in genes. |logFC|>2 and P < 0.05 were set as a threshold to choose the significance level.
Results
Data Collection and Processing
The three gene expression profiles, GSE45267, GSE84402, and GSE101685, were obtained from the NCBI and GEO databases. The quality of gene chips was evaluated with R software. The RNA degradation plots were used to analyze the quality (Figure 1). Robust Multi-array Average (RMA) quantile normalization and background correction were performed in the R software.
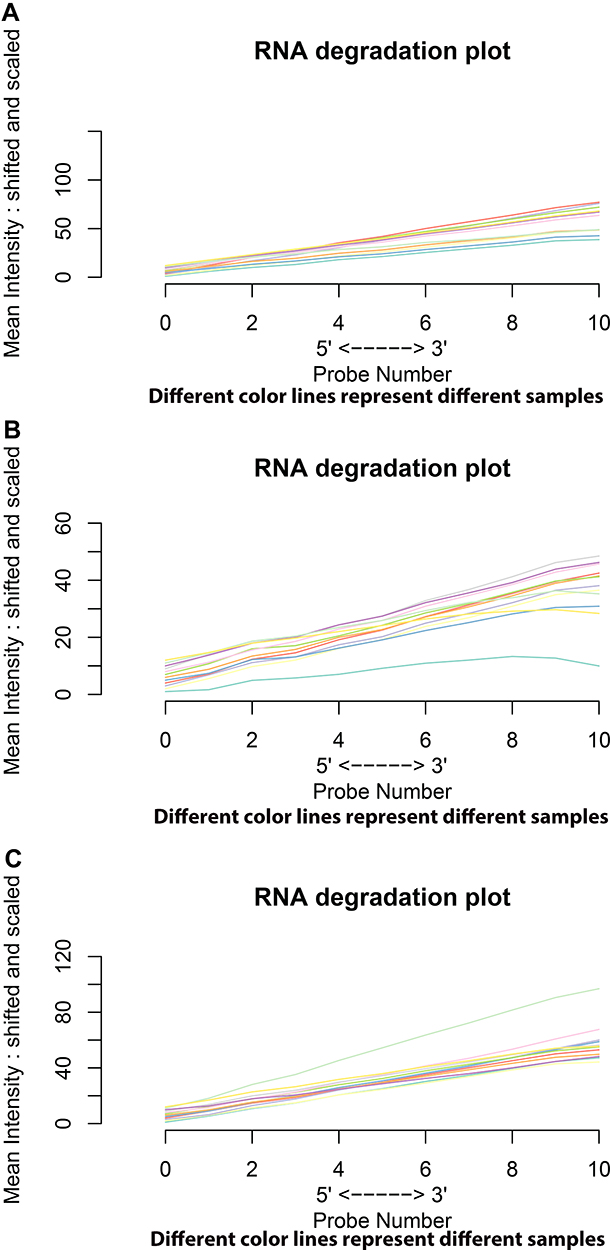 |
Figure 1 RNA degradation plots of GSE45267, GSE84402, and GSE101685 showed that GSE45267 (A) was suitable for further study. However, the GSM2233086 in GSE84402 (B) and the GSM2712027 in GSE101685 (C) needed to be eliminated. Different color lines represent different samples in chips. |
Identification of DEGs
DEGs with P < 0.05 and |logFC| > 2 were selected from 491 HCC tissues and 119 normal tissues in the present study. The R software was used to check 306, 205, 359, and 3905 DEGs from GSE45267, GSE84402, GSE101685, and TCGA, respectively. The |logFC| and adjusted P value were visualized using the volcano plots drawn (Figure 2A–D). Venn software online was used to find the intersectional DEGs in the four series (Figure 2E and F). The Venn plots showed that 107 overlapping DEGs were outputted, including 61 upregulated genes (logFC >0) and 46 downregulated genes (logFC <0).
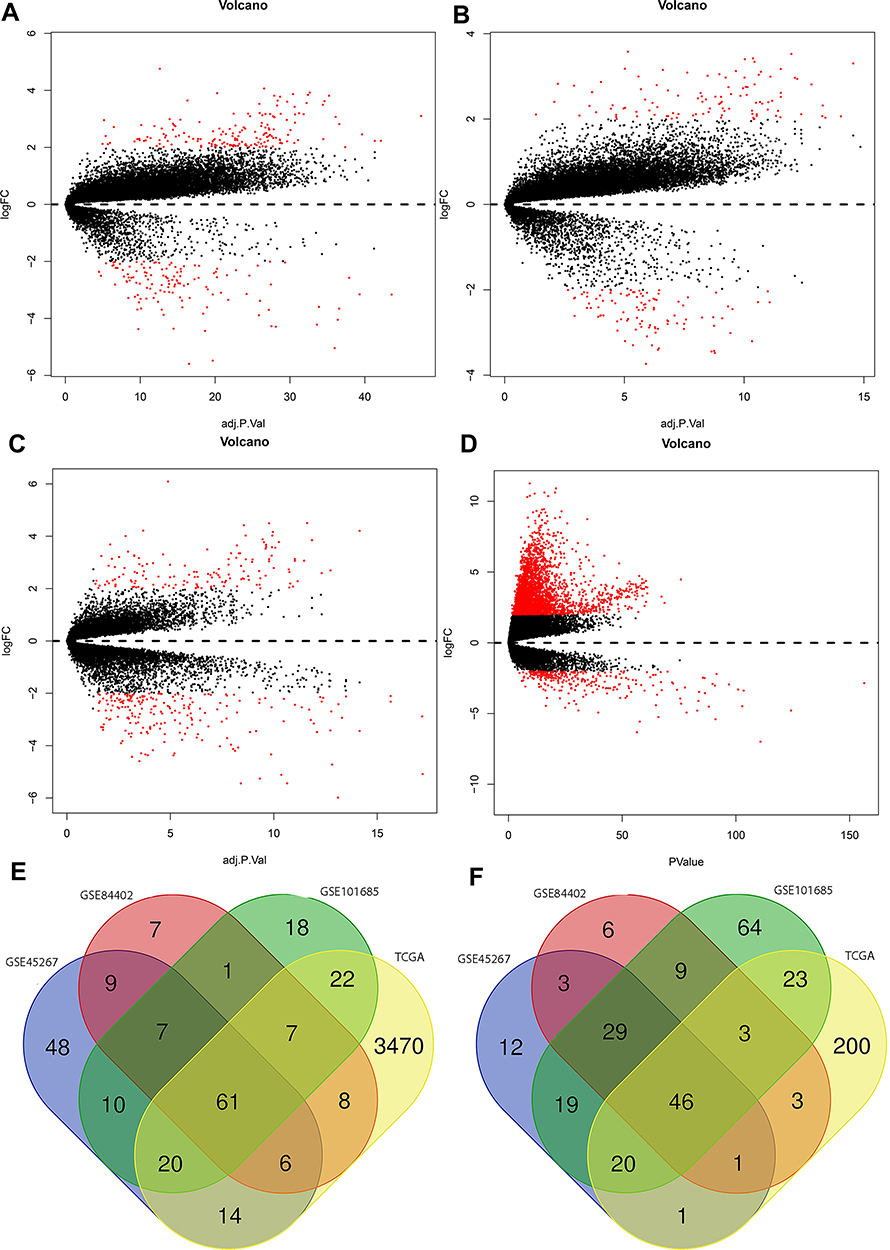 |
Figure 2 Volcano plots drawn of GSE45267 (A), GSE84402 (B), GSE101685 (C), and TCGA (D). The red point denotes DEGs; the black point was not selected in the present study. A Venn diagram of upregulated genes (E) and downregulated genes (F). |
GO and KEGG Pathway Analyses of DEGs in HCC
All 107 DEGs were detected using R software. The results of GO analysis demonstrated that these DEGs were for biological process, cellular component, and molecular function. The DEGs were particularly gathered in nuclear division and organelle fission for biological process; spindle and chromosomal region for cellular component; and monooxygenase activity, microtubule binding, and tubulin binding for molecular function. KEGG analysis results demonstrated that DEGs were particularly gathered in mineral absorption, cell cycle, and retinol metabolism (Figure 3).
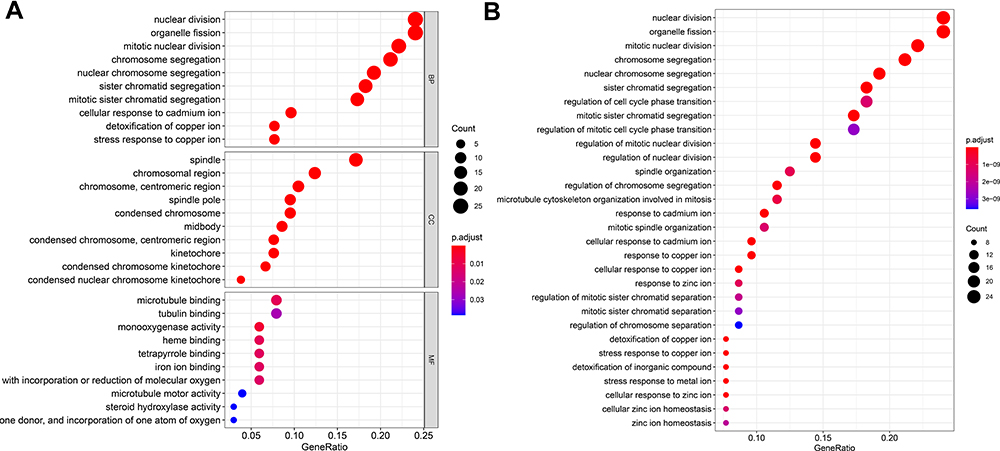 |
Figure 3 GO (A) and KEGG (B) analyses of 107 DEGs. Red represents the more obvious difference, and blue means that the difference is relatively not obvious; the larger the circle, the more the genes are enriched. |
PPI Network and Cluster Analysis
A total of 107 genes were imported into the gene PPI network complex (degree cutoff = 2, max. depth = 100, k-core = 2, and node score cutoff = 0.9). Then, the Cytoscape MCODE app was used for further analysis, revealing 25 central nodes, including MKI67, NUF2, KIF20A, TPX2, KIF4A, CCNB1, KIF4A, PBK, KIF11, CDK1, TTK, TOP2A, ASPM, RRM2, NDC80, MELK, UBE2C, PTTG1, NUSAP1, PRC1, NCAPG, CDC20, DLGAP5, CCNA2, BUB1B, and NEK2 (Figure 4).
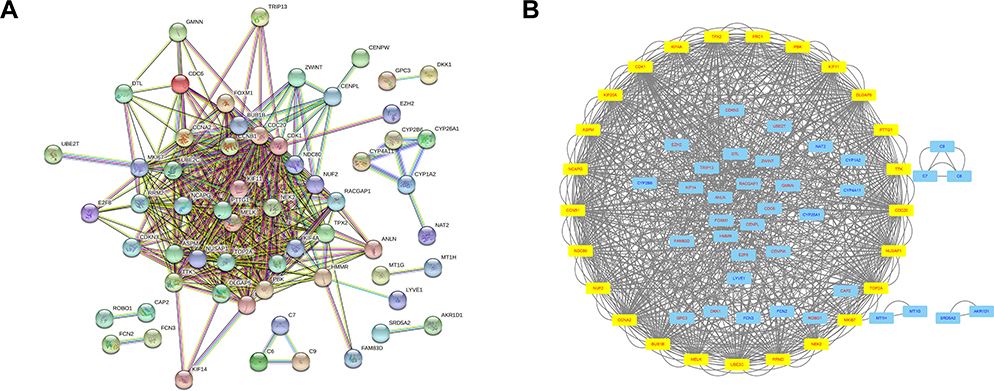 |
Figure 4 In total, 61 genes are selected from 107 genes using the PPI network (A). Cytoscape MCODE app selected 25 genes (B). The yellow box denotes selected genes; genes in red color were upregulated, and genes in blue color were downregulated. |
Verification at the Transcriptional, Protein Level and the Effect of Genes on the Survival of Patients with HCC Using UALCAN
The corresponding KEGG pathway was detected in 25 central nodes. Notably, the cell cycle pathway has a prominent role in tumorigenesis. CCNB1, CDK1, CCNA2, PTTG1, CDC20, and TTK which are rich in the cell cycle, were chosen for the next study. The correlation between the genes from TCGA data (Figure 5) was analyzed. CCNB1 and CDC20 had the highest correlation of 0.86. The study verified that the transcription levels of these six genes in Huh 7 and Hep 3B were higher than that in L02, and the expression levels in tumor tissues were higher than that in normal human tissues (Figure 6). The expression levels of 6 genes were detected by immunohistochemistry from HPA (Figure 7). Next, we searched for genes related to survival using univariate Cox hazard analysis (Figure 8). These six genes were high-risk genes, and the TTK hazard ratio was the highest (P < 0.001, HR = 1.333, 95% CI 1.212–1.466). The overall survival for six significant genes was analyzed with UALCAN (Figure 9). The results showed that the survival time was shorter in the high-expression group.
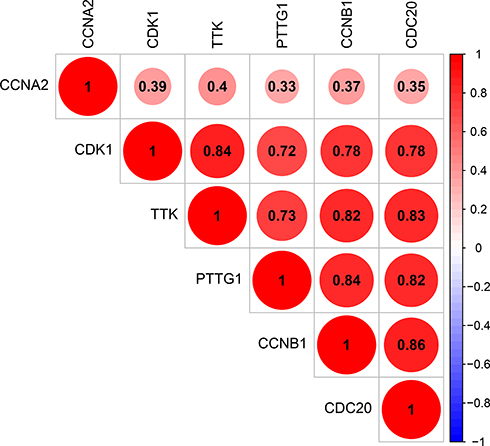 |
Figure 5 Correlation between CCNA2, CCNB1, CDC20, CDK1, PTTG1, and TTK. |
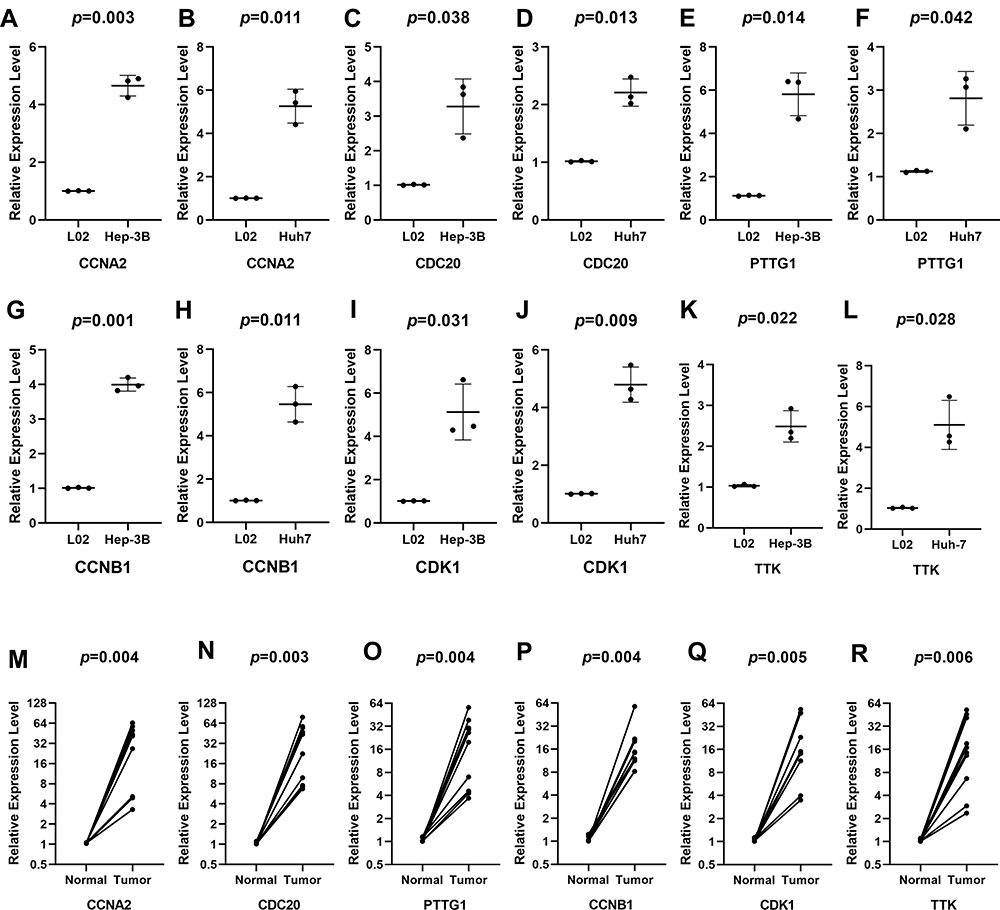 |
Figure 6 Verification at the transcriptional levels of 6 genes. The expression of CCNA2 (A, B), CCNB1 (C, D), CDC20 (E, F), CDK1 (G, H), PTTG1 (I, J), and TTK (K, L) in cells and the expression of CCNA2 (M), CCNB1 (N), CDC20 (O), CDK1 (P), PTTG1 (Q), and TTK (R) in tissues. The expression of all genes was significantly different in 10 tissues. |
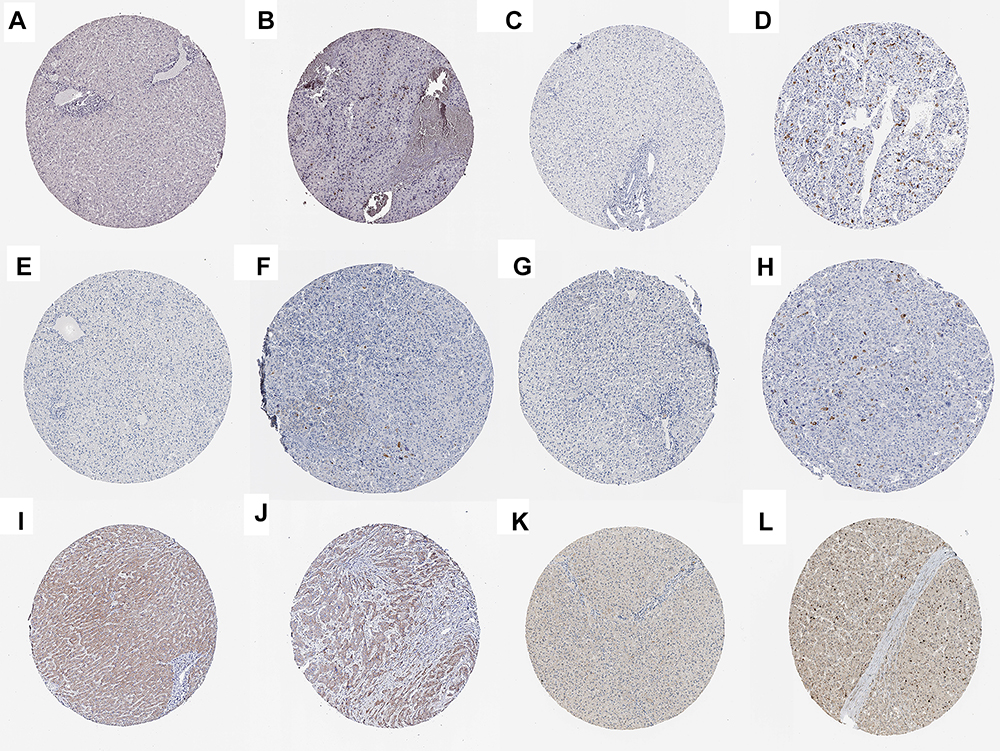 |
Figure 7 Verification at the protein levels of 6 genes. The immunohistochemistry of CCNA2 (A, B), CCNB1 (C, D), CDC20 (E, F), CDK1 (G, H), PTTG1 (I, J), and TTK (K, L) from HAP. |
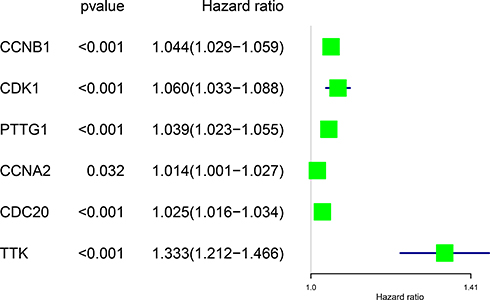 |
Figure 8 Forest map showing six genes identified using Cox proportional hazard regression. |
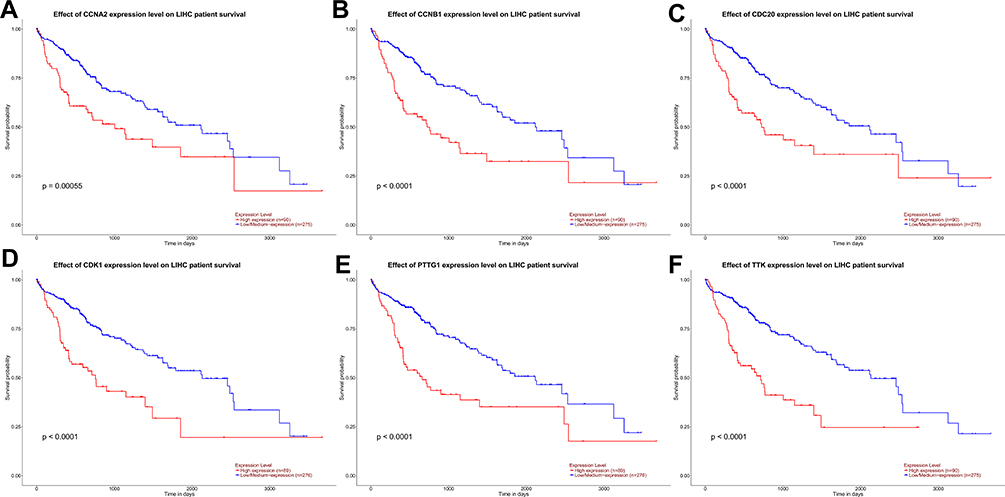 |
Figure 9 Effect of CCNA2 (A), CCNB1 (B), CDC20 (C), CDK1 (D), PTTG1 (E), and TTK (F) expression level on the survival data of patients with HCC from UALCAN. |
Discussion
This study was based on the profile datasets. A total of 491 HCC tissues and 119 normal liver specimens were included in the study. NUSE plots were exported using R software to analyze the quality of the gene chips. The data were processed using RMA. Limma package was used to filter the DEGs with adjusted P value <0.05 and |logFC| >2. The results revealed 107 DEGs, including 61 upregulated genes and 46 downregulated genes. The |logFC| and adjusted P value were obtained using the volcano plots. Next, GO using R software showed biological process, cellular component, and molecular function in both upregulated and downregulated genes. KEGG analysis results demonstrated that DEGs were particularly gathered in mineral absorption, cell cycle, and retinol metabolism. Next, 107 genes were imported into the gene PPI network with the STRING database and Cytoscape software. Six of the 25 core genes were found in the cell cycle pathway. Next, the correlation between the genes was described. CCNB1 and CDC20 had the highest correlation. Furthermore, the expression levels of these six genes in normal and HCC cells, as well cancer and adjacent tissues, were verified through quantitative real-time PCR. The protein levels of the six genes were verified from HPA. All genes were associated with a significant overall survival in patients with HCC.
Some studies showed that the CCNB1–CDK1 complex was an important regulator in cell division.12 Li et al found that the expression level of CCNB1 was high in HCC samples and RP11-295G20. Further, the 2/miR-6884-3p/CCNB1 axis meditated tumorigenic behaviors in HCC cells.13 CDK1 is one of the serine/threonine kinases playing a pivotal role in cell division. Li et al found that the Upf1/SNORD52/CDK1 axis might have an important role in facilitating hepatocarcinogenesis.14 Circular RNA circ-ADD3 inhibits HCC metastasis via CDK1-mediated ubiquitination.15 The efficacy of sorafenib treatment by targeting cancer stem cells was better by blocking CDK1/PDK1/β-catenin signaling in HCC.16 CDC20 exhibits an oncogenic function in carcinogenesis. Higher expression of CDC20 exists in a large number of human tumors. Moreover, the higher the content, the poorer the prognosis and survival in HCC. The overexpression of CDC20 plays a crucial role in the proliferation of HCC cells both in vitro and in vivo by governing PHD3 protein.17 SIRT2 regulates mitosis and genome integrity through the deacetylation of CDC20.18 PTTG1 belongs to the PTTG family and is overexpressed in various human cancers including HCC. The downregulation of PTTG1 inhibited HCC cell proliferation by reducing c-myc expression.19 The long noncoding RNA PTTG3P regulated PTTG1 and activating PI3K/Akt signaling promoted HCC cell growth and metastasis.20 The thyroid hormone 3/Sp1/PTTG1 axis was crucial in the development of HCC.21 The overexpression of PTTG1 in HCC was associated with angiogenesis.22 CCNA2 promoted the cell cycle transition. The FXR-miR-22-CCNA2 signaling pathway promoted the proliferation of hepatoma cells and tumorigenesis.23 Notably, TTK was likely associated with cell cycle. TTK overexpression promoted cell proliferation and resistance to sorafenib in HCC cells.24 Inhibiting TTK could trigger apoptosis and inhibited the growth of HCC cells.25
The correlation analysis of DEGs is not common in similar studies. Jin et al found that CDK1/CCNB1 was involved in the regulation axis of LINC00346 in HCC. After overexpression, CDK1/CCNB1 blocked the P53 signaling pathway and regulated the apoptosis, invasion, and cell cycle of HCC.26 This finding also verified the correlation between the six genes detected in this study. The study showed that the correlation score of CDK1 and CCNB1 reached 0.78. Among the six genes, CCNB1 and CDC20 had the highest correlation, but the underlying mechanism in liver cancer has not been explored. Although the correlation between CCNA2 and other five genes was relatively low, the P value in the correlation test was less than 0.001. Hence, the correlation analysis of these six genes is the next experimental plan.
Conclusions
The present study found six genes (CCNB1, CDK1, CDC20, PTTG1, CCNA2, and TTK) in TCGA and GEO databases. These genes were overexpressed in HCC. The study also explored the unreported correlation of these genes with HCC. The results of this study might help in exploring the prognosis and diagnostic markers of HCC in the future.
Abbreviations
DEGs, Differentially expressed genes; GEO, Gene Expression Omnibus; GO, Gene Ontology; HCC, hepatocellular carcinoma; KEGG, Kyoto Encyclopedia of Genes and Genomes; PPI, protein–protein interaction; STRING, Search Tool for the Retrieval of Interacting Genes; TCGA, The Cancer Genome Atlas; NUSE, Normalized Unscaled Standard Errors; RMA, Robust Multi-array Average; HAP, Human Protein Atlas.
Ethics Approval and Informed Consent
The study had a statement on ethics approval. The ethics committee of the Affiliated Hospital of Qingdao University approved the study.
Consent for Publication
All authors confirm that the details of images, videos, recordings, and so forth can be published.
Author Contributions
All authors made a significant contribution to the work reported, whether that is in the conception, study design, execution, acquisition of data, analysis and interpretation, or in all these areas; took part in drafting, revising or critically reviewing the article; gave final approval of the version to be published; have agreed on the journal to which the article has been submitted; and agree to be accountable for all aspects of the work.
Funding
The study was supported by the Youth Project ZR2016HQ15 of the Natural Science Foundation of Shandong Province and the Youth Project 81602083 of the National Natural Science Foundation of China.
Disclosure
The authors report no conflicts of interest in this work.
References
1. Kew MC. Epidemiology of chronic hepatitis B virus infection, hepatocellular carcinoma, and hepatitis B virus-induced hepatocellular carcinoma. Pathol Biol. 2010;58(4):273–277. doi:10.1016/j.patbio.2010.01.005
2. Zhu AX, Duda DG, Sahani DV, Jain RK. HCC and angiogenesis: possible targets and future directions. Nat Rev Clin Oncol. 2011;8(5):292–301. doi:10.1038/nrclinonc.2011.30
3. Sun Q, Liu P, Long B, Zhu Y, Liu T. Screening of significant biomarkers with poor prognosis in hepatocellular carcinoma via bioinformatics analysis. Medicine. 2020;99:e21702. doi:10.1097/MD.0000000000021702
4. Meng Z, Wu J, Liu X, et al. Identification of potential hub genes associated with the pathogenesis and prognosis of hepatocellular carcinoma via integrated bioinformatics analysis. J Int Med Res. 2020;48:300060520910019. doi:10.1177/0300060520910019
5. Zeng L, Fan X, Wang X, et al. Bioinformatics analysis based on multiple databases identifies hub genes associated with hepatocellular carcinoma. Curr Genomics. 2019;20:349–361. doi:10.2174/1389202920666191011092410
6. Li WC, Bai L, Xu Y, et al. Identification of differentially expressed genes in synovial tissue of rheumatoid arthritis and osteoarthritis in patients. J Cell Biochem. 2019;120(3):4533–4544. doi:10.1002/jcb.27741
7. Smyth GK. Linear models and empirical bayes methods for assessing differential expression in microarray experiments. Stat Appl Genet Mol Biol. 2004;3:Article3. doi:10.2202/1544-6115.1027
8. Ashburner M, Ball CA, Blake JA, et al. Gene ontology: tool for the unification of biology. The gene ontology consortium. Nat Genet. 2000;25(1):25–29. doi:10.1038/75556
9. Kanehisa M, Goto S. KEGG: kyoto encyclopedia of genes and genomes. Nucleic Acids Res. 2000;28:27–30. doi:10.1093/nar/28.1.27
10. Smoot ME, Ono K, Ruscheinski J, Wang PL, Ideker T. Cytoscape 2.8: new features for data integration and network visualization. Bioinformatics. 2011;27:431–432. doi:10.1093/bioinformatics/btq675
11. Uhlen M, Fagerberg L, Hallstrom BM, et al. Proteomics. Tissue-based map of the human proteome. Science. 2015;347(6220):1260419. doi:10.1126/science.1260419
12. Nakayama Y, Yamaguchi N. Role of cyclin B1 levels in DNA damage and DNA damage-induced senescence. Int Rev Cell Mol Biol. 2013;305:303–337.
13. Li J, Xia T, Cao J, et al. RP11-295G20.2 facilitates hepatocellular carcinoma progression via the miR-6884-3p/CCNB1 pathway. Aging (Albany NY). 2020;12(14):14918–14932. doi:10.18632/aging.103552
14. Li C, Wu L, Liu P, et al. The C/D box small nucleolar RNA SNORD52 regulated by Upf1 facilitates hepatocarcinogenesis by stabilizing CDK1. Theranostics. 2020;10(20):9348–9363. doi:10.7150/thno.47677
15. Sun S, Wang W, Luo X, et al. Circular RNA circ-ADD3 inhibits hepatocellular carcinoma metastasis through facilitating EZH2 degradation via CDK1-mediated ubiquitination. Am J Cancer Res. 2019;9(8):1695–1707.
16. Wu CX, Wang XQ, Chok SH, et al. Blocking CDK1/PDK1/β-Catenin signaling by CDK1 inhibitor RO3306 increased the efficacy of sorafenib treatment by targeting cancer stem cells in a preclinical model of hepatocellular carcinoma. Theranostics. 2018;8(14):3737–3750. doi:10.7150/thno.25487
17. Shi M, Dai WQ, Jia RR, et al. APC(CDC20)-mediated degradation of PHD3 stabilizes HIF-1a and promotes tumorigenesis in hepatocellular carcinoma. Cancer Lett. 2021;496:144–155. doi:10.1016/j.canlet.2020.10.011
18. Kim HS, Vassilopoulos A, Wang RH, et al. SIRT2 maintains genome integrity and suppresses tumorigenesis through regulating APC/C activity. Cancer Cell. 2011;20:487–499. doi:10.1016/j.ccr.2011.09.004
19. Lin X, Yang Y, Guo Y, et al. PTTG1 is involved in TNF-alpha-related hepatocellular carcinoma via the induction of c-myc. Cancer Med. 2019;8:5702–5715. doi:10.1002/cam4.2473
20. Huang J-L, Cao S-W, Ou Q-S, et al. The long non-coding RNA PTTG3P promotes cell growth and metastasis via up-regulating PTTG1 and activating PI3K/AKT signaling in hepatocellular carcinoma. Mol Cancer. 2018;17(1):93. doi:10.1186/s12943-018-0841-x
21. Chen RN, Huang YH, Yeh CT, Liao CH, Lin KH. Thyroid hormone receptors suppress pituitary tumor transforming gene 1 activity in hepatoma. Cancer Res. 2008;68:1697–1706. doi:10.1158/0008-5472.CAN-07-5492
22. Fujii T, Nomoto S, Koshikawa K, et al. Overexpression of pituitary tumor transforming gene 1 in HCC is associated with angiogenesis and poor prognosis. Hepatology. 2006;43(6):1267–1275. doi:10.1002/hep.21181
23. Yang F, Gong J, Wang G, et al. Waltonitone inhibits proliferation of hepatoma cells and tumorigenesis via FXR-miR-22-CCNA2 signaling pathway. Oncotarget. 2016;7(46):75165–75175. doi:10.18632/oncotarget.12614
24. Liang XD, Dai YC, Li ZY, et al. Expression and function analysis of mitotic checkpoint genes identifies TTK as a potential therapeutic target for human hepatocellular carcinoma. PLoS One. 2014;9:e97739. doi:10.1371/journal.pone.0097739
25. Choi M, Min YH, Pyo J, et al. TC Mps1 12, a novel Mps1 inhibitor, suppresses the growth of hepatocellular carcinoma cells via the accumulation of chromosomal instability. Br J Pharmacol. 2017;174:1810–1825. doi:10.1111/bph.13782
26. Jin J, Xu H, Li W, et al. LINC00346 acts as a competing endogenous RNA regulating development of hepatocellular carcinoma via modulating CDK1/CCNB1 axis. Front Bioeng Biotechnol. 2020;8:54. doi:10.3389/fbioe.2020.00054
 © 2021 The Author(s). This work is published and licensed by Dove Medical Press Limited. The
full terms of this license are available at https://www.dovepress.com/terms
and incorporate the Creative Commons Attribution
- Non Commercial (unported, 3.0) License.
By accessing the work you hereby accept the Terms. Non-commercial uses of the work are permitted
without any further permission from Dove Medical Press Limited, provided the work is properly
attributed. For permission for commercial use of this work, please see paragraphs 4.2 and 5 of our Terms.
© 2021 The Author(s). This work is published and licensed by Dove Medical Press Limited. The
full terms of this license are available at https://www.dovepress.com/terms
and incorporate the Creative Commons Attribution
- Non Commercial (unported, 3.0) License.
By accessing the work you hereby accept the Terms. Non-commercial uses of the work are permitted
without any further permission from Dove Medical Press Limited, provided the work is properly
attributed. For permission for commercial use of this work, please see paragraphs 4.2 and 5 of our Terms.