")
Back to Journals » Journal of Inflammation Research » Volume 17
Comprehensive Analysis of Fatty Acid Metabolism in Diabetic Nephropathy from the Perspective of Immune Landscapes, Diagnosis and Precise Therapy
Authors Zhu E, Zhong M, Liang T, Liu Y, Wu K , Zhang Z, Zhao S, Guan H, Chen J, Zhang LZ , Zhang Y
Received 15 September 2023
Accepted for publication 23 January 2024
Published 3 February 2024 Volume 2024:17 Pages 693—710
DOI https://doi.org/10.2147/JIR.S440374
Checked for plagiarism Yes
Review by Single anonymous peer review
Peer reviewer comments 2
Editor who approved publication: Professor Ning Quan
Enyi Zhu,1,2,* Ming Zhong,3,* Tiantian Liang,4,* Yu Liu,3,* Keping Wu,1,2 Zhijuan Zhang,1,2 Shuping Zhao,1,2 Hui Guan,5 Jiasi Chen,6 Li-Zhen Zhang,7 Yimin Zhang1,2
1The Division of Nephrology, The Sixth Affiliated Hospital, Sun Yat-sen University, Guangdong Provincial Key Laboratory of Colorectal and Pelvic Floor Diseases, Guangzhou, Guangdong, 510000, People’s Republic of China; 2Biomedical Innovation Center, The Sixth Affiliated Hospital, Sun Yat-sen University, Guangdong Provincial Key Laboratory of Colorectal and Pelvic Floor Diseases, Guangzhou, Guangdong, 510000, People’s Republic of China; 3Department of Nephrology, Center of Kidney and Urology, The Seventh Affiliated Hospital of Sun Yat-sen University, Shenzhen, Guangdong, 517108, People’s Republic of China; 4Nephrology Division, The Third Affiliated Hospital of Sun Yat-sen University, Guangzhou, Guangdong, 510630, People’s Republic of China; 5Department of Radiation Oncology, The First Affiliated Hospital of Zhengzhou University, Zhengzhou, Henan, 450000, People’s Republic of China; 6Department of Nephrology, The First Affiliated Hospital of Guangzhou Medical University, Guangzhou, Guangdong, 510030, People’s Republic of China; 7Department of Urology, The First Affiliated Hospital of Sun Yat-sen University, Guangzhou, Guangdong, 510080, People’s Republic of China
*These authors contributed equally to this work
Correspondence: Yimin Zhang, The Division of Nephrology, The Sixth Affiliated Hospital, Sun Yat-sen University, Guangdong Provincial Key Laboratory of Colorectal and Pelvic Floor Diseases, Guangzhou, People’s Republic of China, Email [email protected] Li-Zhen Zhang, Department of Urology, The First Affiliated Hospital of Sun Yat-sen University, Guangzhou, People’s Republic of China, Email [email protected]
Objective: Diabetic nephropathy (DN) represents the principal cause of end-stage renal diseases worldwide, lacking effective therapies. Fatty acid (FA) serves as the primary energy source in the kidney and its dysregulation is frequently observed in DN. Nevertheless, the roles of FA metabolism in the occurrence and progression of DN have not been fully elucidated.
Methods: Three DN datasets (GSE96804/GSE30528/GSE104948) were obtained and combined. Differentially expressed FA metabolism-related genes were identified and subjected to DN classification using “ConsensusClusterPlus”. DN subtypes-associated modules were discovered by “WGCNA”, and module genes underwent functional enrichment analysis. The immune landscapes and potential drugs were analyzed using “CIBERSORT” and “CMAP”, respectively. Candidate diagnostic biomarkers of DN were screened using machine learning algorithms. A prediction model was constructed, and the performance was assessed using receiver operating characteristic (ROC) curves, calibration curves, and decision curve analysis (DCA). The online tool “Nephroseq v5” was conducted to reveal the clinical significance of the candidate diagnostic biomarkers in patients with DN. A DN mouse model was established to verify the biomarkers’ expression.
Results: According to 39 dysregulated FA metabolism-related genes, DN samples were divided into two molecular subtypes. Patients in Cluster B exhibited worse outcomes with a different immune landscape compared with those in Cluster A. Ten potential small-molecular drugs were predicted to treat DN in Cluster B. The diagnostic model based on PRKAR2B/ANXA1 was created with ideal predictive values in early and advanced stages of DN. The correlation analysis revealed significant association between PRKAR2B/ANXA1 and clinical characteristics. The DN mouse model validated the expression patterns of PRKAR2B/ANXA1.
Conclusion: Our study provides new insights into the role of FA metabolism in the classification, immunological pathogenesis, early diagnosis, and precise therapy of DN.
Keywords: diabetic nephropathy, fatty acid metabolism, molecular subtypes, immune landscape, pharmacotherapy, diagnostic model
Introduction
With the increasing prevalence of diabetes mellitus, diabetic nephropathy (DN) represents the most common complication of diabetes.1,2 It is becoming the leading cause of end-stage renal disease worldwide, bringing a substantial economic burden to the public.3–5 Excessive mesangial matrix production, renal hypertrophy, and fibrosis are the typical pathological changes in DN.6–8 The pathogenesis of DN is complicated. Various risk factors, eg, deposition of advanced glycation end products (AGEs), boosting of the renin-angiotensin-aldosterone system (RAAS), and oxidative stress, are reported to exert critical effects on the initiation and evolution of DN.9–12 Yet, the underlying mechanisms of DN remain largely unrevealed. Over the past few decades, only a few medications, including RAS inhibitors, Finerenone, sodium-glucose co-transporter-2 (SGLT-2) inhibitors, and glucagon-like peptide 1 (GLP-1) agonists, have been available for reducing the incidence of DN in populations with diabetes by controlling the glucose level or arterial pressure.4,13,14 Nonetheless, the therapeutic drug strategy directly targeting DN is still limited. In addition, due to the heterogeneity and complicated mechanisms of diabetes-related injuries in the kidney, the existing diagnosis and therapy of DN remain controversial,15,16 which are more complicated than other types of kidney diseases.17 Therefore, further exploring the pathogenesis is of great significance, and identifying novel biomarkers for early diagnosis, preferable classification, and precise treatment of DN is urgently needed.
It is well acknowledged that the kidney is an active metabolic organ and requires vast energy to maintain the homeostasis of the microenvironment.18–20 A growing number of studies have considered fatty acid (FA) as the primary energy source to support kidney functional needs.18 Dysfunction of FA metabolism could be observed in the experimental DN mouse models, as indicated by excessive deposition of lipid and decreased expression of carnitine palmitoyl transferase 1A (CPT1A), which is a rate-limiting enzyme in the FA metabolism of the kidney.21,22 Recent studies have highlighted that impaired FA metabolism may play an essential role in the pathogenic procedures of multiple kidney injuries.18,23 Overexpression of renal CPT1A markedly ameliorates kidney injuries and fibrosis in experimental animal models by modulating the oxidative process of FA metabolism.24 Consistently, inhibition of FA oxidation significantly restores the damaged barrier function of renal vessels in DN mice.25 Moreover, fatty acid-binding protein 4 (FABP4), an important fatty acid transporter protein, is involved in apoptosis of mesangial cells in DN via regulating endoplasmic reticulum (ER) stress.26 Furthermore, previous studies have also shown that abnormal metabolism of multiple nutrients, including impaired FA metabolism, can alter the immune microenvironment via different pathways during the pathological processes.27 Both innate and adaptive immune responses have been recently found to participate in the pathogenesis of DN.28 However, the regulatory role of FA metabolism and its association with immune responses in DN have not been fully elucidated, and it remains undetermined whether some factors associated with FA metabolism could become promising biomarkers for DN diagnosis or classification.
In the present study, we further clarified the role of FA metabolism-related genes in DN by integrating multiply bioinformatics analysis. Patients with DN were firstly classified into two groups via clustering analysis. We then investigated the differences in functional enrichment and immune landscape as well as clinical outcomes between these clusters and also discovered candidate drugs for precise medication. Importantly, novel biomarkers (PRKAR2B and ANXA1) were identified and a diagnostic model for predicting DN risk was further established based on the dysregulated FA metabolism-related genes by two machine learning algorithms. Our study will provide new insights into the role of FA metabolism in the pathogenesis and the classification of DN, and the early diagnostic biomarkers and precise therapy for DN.
Methods
Data Processing
Microarray datasets of glomerulus tissues from patients with DN and control groups, including GSE96804, GSE30528, and GSE104948, were taken from the Gene Expression Omnibus (GEO) repository. The integrated DN dataset, which contained 57 DN and 54 control samples, was generated after the batch effect correction of these three datasets using the combat function of the “SVA” package29 in R software.
Access of Fatty Acid Metabolism-Related Genes
Fatty acid (FA) metabolism-related genes were downloaded from the fatty acid metabolism process (ontology gene sets) in the Molecular Signatures Database (MsigDB) (https://www.gsea-msigdb.org/gsea/msigdb).
Identification of differentially expressed fatty acid metabolism-related genes
The “Limma” package30 in R software was applied to the identification of all differentially expressed genes (DEGs) (DN vs Control) with the cut-off values of adjusted p-value <= 0.05 and |log2 Fold Change (FC)| ≥ 0.585. Venn plot was then used to define differentially expressed FA metabolism-related genes by intersection of FA metabolism-related genes downloaded from the database and all DEGs in DN.
Molecular Typing of Fatty Acid Metabolism-Related Genes
The “ConsensusClusterPlus” package31 in R software was used for clustering analysis to identify potential subtypes of the DN on the basis of differentially expressed FA metabolism-related genes. The optimal k-value was selected using the consensus matrix (CM) and the maximum cumulative distribution function (CDF) index. The DEGs between the two molecular subclusters were screened out by “Limma” package with the threshold of adjusted p-value <= 0.05, |log2 FC| ≥ 0.585.
Weighted Gene Co-Expression Network Analysis (WGCNA) and critical module genes determination
The “WGCNA” package32 in R software was carried out to determine key modules associated with different molecular subtypes of the DN samples. After obtaining the optimal soft threshold power, constructing a scale-free co-expression gene network, and calculating the correlation coefficient between modules and subtypes, the module-trait relationships were then built. Modules with highly positive correlations with different molecular subtypes were selected for further analysis.
Functional Enrichment Analysis
The roles of genes in different molecular subtypes were revealed by annotation of Gene Ontology (GO) and analysis of Kyoto Encyclopedia of Genes and Genomes (KEGG) pathway, and p-value < 0.05 was regarded as significant.
Immune Landscape Analysis
The “CIBERSORT” package33 in R software was employed to evaluate the abundances of the infiltrated immune cells from the DN dataset. The Wilcoxon test was used to determine the differences in the number of 22 types of immune cells between controls and DN samples, together with different molecular subtypes, respectively. The correlation among 22 types of immune cells, and the relationship between differentially expressed FA metabolism-related genes, and the infiltrated immune cells, were calculated using Spearman’s rank correlation coefficient. Adjusted p-value < 0.05 was determined to be significant.
Potential Small-Molecular Drugs Prediction
Connectivity map (CMAP)34 (https://clue.io) serves as a repository for gene expression data on the alteration of gene expression signatures following treatment of various small-molecular compounds, providing information for predicting potentially therapeutic drugs. Up-regulated key genes in Cluster B, based on the molecular subtyping of FA metabolism-related genes, were imported into the CMAP database to predict the potential small-molecular drugs for future therapeutic application. The top 10 drugs with the highest negative enrichment scores were chosen as potential pharmacological agents.
Screening of Diagnostic Biomarkers and Establishment of DN Risk Prediction Nomogram
To screen the candidate diagnostic biomarkers, the Least Absolute Shrinkage and Selection Operator (LASSO) together with Support Vector Machine-Recursive Feature Elimination (SVM-RFE) algorithms were performed by the “glmnet”35 and “e1071”36 packages in R software, respectively. The genes included in both algorithms were defined as potential diagnostic biomarkers for further construction of DN risk prediction model using the “rms” package37 in R software.
Evaluation for Diagnostic Efficacy of the Prediction Model
The calibration curves, decision curve analysis (DCA), and the receiver operating characteristic (ROC) curves were applied to evaluate the performance of the nomogram in diagnosing patients with DN. Moreover, the ROC curve was also conducted to assess the efficacy of the nomogram to predict the risk of an early DN stage.
Correlation Analysis of Clinical Features
The “Nephroseq v5” tool (https://nephroseq.org/) was utilized to evaluate the correlation between the expression of the candidate diagnostic biomarkers and clinical characteristics in patients with DN.
Establishment of an Experimental Animal Model
Six-week-old of male C57BL/6J mice were obtained from GemPharmatech Co. Ltd, China. After adaptive feeding for a week, mice were randomly divided into two groups and given access to a normal chow diet (NCD, 10 kcal% fat) or high-fat diet (HFD, 60 kcal% fat), respectively. After four weeks of NCD or HFD, the HFD mice were induced by streptozotocin (STZ; Sigma-Aldrich, USA) via intraperitoneal (i.p.) injection in a dose of 40 mg/kg body weight for seven consecutive days, whereas NCD mice were received the same volume of vehicle buffer through i.p. injection. After two weeks of the injection, the blood samples were obtained from the tail vein of mice and the random blood glucose levels were detected by an ACCU-CHEK® Performa glucometer (Roche, Manheim, Germany).38 The blood glucose levels more than 16.7 mmol/L were regarded as the successful establishment of an experimental diabetic animal model and the corresponding mice were finally used in this study. Mice were sacrificed after 11 weeks of NCD or HFD, and the serum and urine samples as well as kidney tissues were harvested to perform further experimental analysis. Animal experimental protocols gained approval from the Institutional Research Ethics Committee at the Sun Yat-sen University (SYSU-IACUC-2022-001575). They were carried out following the relevant guidelines and the Guide for the Care and Use of Laboratory Animals (NIH publications Nos. 80–23, revised 1996).
Renal Function and Histology
Serum creatinine (SCr) and urinary creatinine (UCr) were measured by using the Creatinine Assay kit (Nanjing Jiancheng Bioengineering Institute, Nanjing, China). Blood urea nitrogen (BUN) was detected by the Urea Nitrogen Content Assay Kit (Solarbio, Beijing, China). Urine albumin protein levels were determined using the Albumin assay kit (Nanjing Jiancheng Bioengineering Institute). Paraffin-embedded kidney tissues were sectioned (4 μm) and subjected to Periodic Acid-Schiff stain (PAS) and Masson’s trichrome staining. The areas of glomerular and mesangial matrix were quantified using ImageJ software version 1.53e (National Institutes of Health, Bethesda, USA), respectively, and the mesangial matrix index was obtained as the ratio of the mesangial matrix area to the glomerular area. The areas of collagen deposition were calculated using ImageJ software based on 10 randomly chosen high-power fields per kidney section.
Protein Extraction and Western Blotting (WB)
The kidney tissues were lysed in RIPA buffer (Beyotime, Shanghai, China) containing protease and phosphatase inhibitors. The proteins in the lysates were resolved via sodium dodecyl sulfate- polyacrylamide gel electrophoresis (SDS-PAGE), and transferred onto the polyvinylidene difluoride (PVDF) membranes.39 The membranes were then blocked by 5% skim milk at room temperature (RT) for an hour, followed by incubation of anti-PRKAR2B (28351-1-AP; Proteintech, Wuhan, China; diluted 1:500), anti-ANXA1 (21990-1-AP; Proteintech; diluted 1:5000) or anti-GAPDH (60004-1-Ig; Proteintech; diluted 1:20000) antibodies at 4°C for 16 hours. On the second day, the membranes were incubated with the horseradish peroxidase (HRP)-conjugated secondary antibody (SA00001-1, SA00001-2; Proteintech; diluted 1:10000) at RT for an hour. Protein levels were assessed by WB Chemiluminescence Detection. GAPDH was used as the endogenous reference and the grey values of protein bands were quantified by ImageJ software.
Real-Time Quantitative Polymerase Chain Reaction (RT-qPCR)
RNA extraction was carried out by the Trizol reagent (ThermoFisher Scientific, Darmstadt, Germany) according to previous study,40 and reverse transcription was conducted with the QuantiTect Reverse Transcription Kit (Ruizhen Bio, Guangzhou, China). RT-qPCR was performed via the SYBR Green PCR kit (Ruizhen Bio). The 2−ΔΔCt approach was adopted to calculate the relative mRNA expression of PRKAR2B and ANXA1. Primers for β-actin, PRKAR2B and ANXA1 were as shown as followings, mouse PRKAR2B-F: 5’-CCAGTAAGGGTGTCAACTTCG-3’, mouse PRKAR2B-R: 5’-GGACTCTGCATCGTCTTCCTC-3’; mouse ANXA1-F: 5’-AAGCAGGCCCGTTTTCTTGAA-3’; mouse ANXA1-R: 5’-GCAACATCCGAGGATACATTGA-3’; mouse β-actin-F: 5’-GGCTGTATTCCCCTCCATCG-3’, mouse β-actin-R: 5’-CCAGTTGGTAACAATGCCATGT-3’.
Statistical Analysis
Data processing and analysis were conducted in R software (version 4.2.1). GraphPad Prism version 9.0.2 was performed for statistical analysis in RT-qPCR analysis, and an unpaired t-test was performed to calculate the differences between the two groups. Results were shown as mean ± standard deviation (SD), and p-value < 0.05 was regarded as significance.
Results
Differential Expression Analysis of FA Metabolism-Related Genes in Patients with Diabetic Nephropathy
The flow diagram of this present research process is performed in Figure 1. In this study, three microarray datasets were obtained from the GEO repository and integrated after eliminating the batch effects, finally consisting of 57 DN and 54 control glomerular samples (Additional file: Figure S1A and B). With the threshold of adjusted p-value < 0.05 and |log2 FC| > = 0.585, 610 differentially expressed genes (DEGs), including 219 up-regulated and 391 down-regulated genes, were identified and presented in the volcano plot (Additional file: Figure S1C) and the expression of partial DEGs was shown in the heatmap (Additional file: Figure S1D). Among them, a total of 39 FA metabolism-related genes (8 up-regulated and 31 down-regulated genes) were found to be dysregulated in patients with DN by overlapping genes in FA metabolic process with DN-associated DEGs (Additional file: Figure S1E and F).
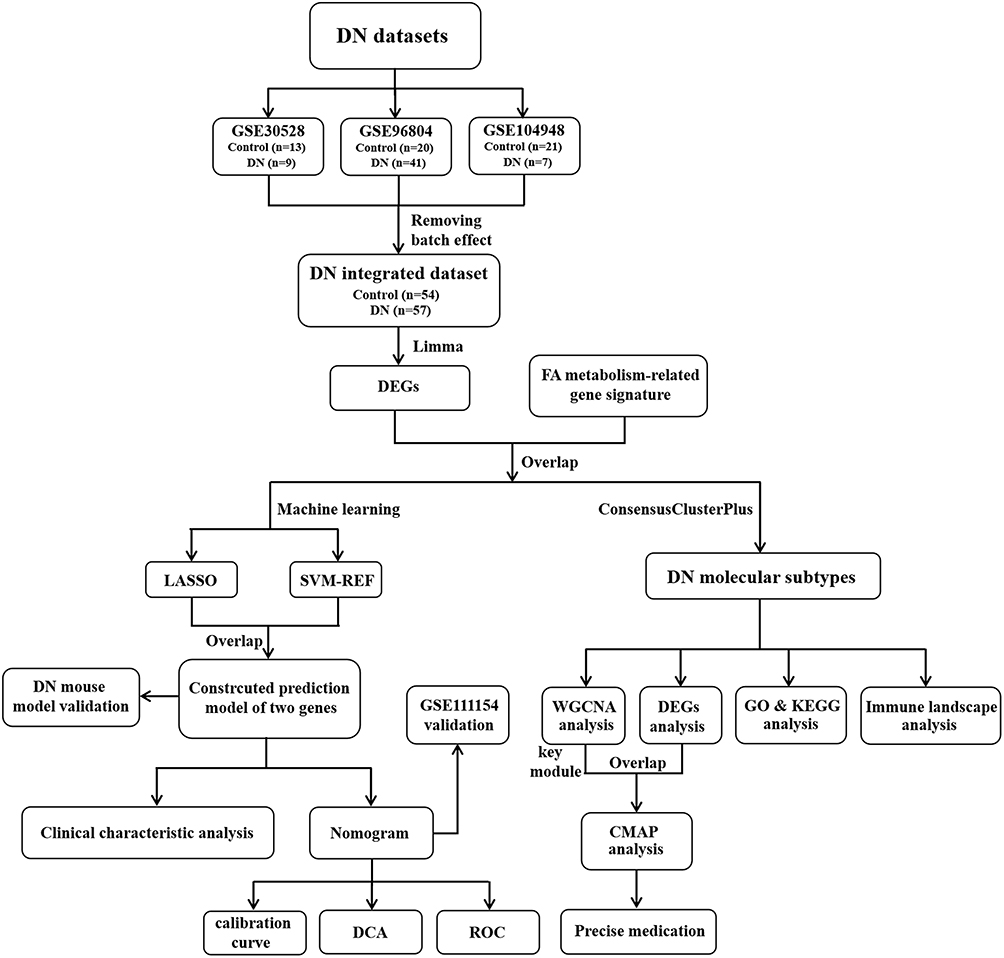 |
Figure 1 The research flow chart of this study. |
Identification of Molecular Subtypes Based on FA Metabolism-Related Genes
Based on the 39 dysregulated FA metabolism-related genes, patients with DN were divided into two subtypes (Cluster A, n = 31 and Cluster B, n = 26) using the “Consensus Cluster Plus” package, as k = 2 was found to be comparatively stable in classification (Additional file: Figure S2A–C). WGCNA was employed to identify the key gene modules in Cluster A and Cluster B with the soft-threshold power of β = 7 (R2 = 0.929, Additional file: Figure S2D). In all, ten gene modules were obtained, and the cluster dendrogram of the modules was then created (Additional file: Figure S2E and F). Furthermore, the correlation coefficient of molecular subtypes with gene modules was calculated, and yellow together with green modules had high positive association with Cluster A, whereas the turquoise together with magenta modules exhibited high positive relative to Cluster B (Additional file: Figure S2G). Thus, these four modules were chosen as the key modules for further analysis. By functional enrichment analysis of the biological process (BP), the genes included in Cluster A-associated modules were mainly correlated to “cell cycle”, “response to endoplasmic reticulum stress” and “integrin-mediated signaling pathway” (Additional file: Figure S3A). For Cluster B-associated modules, the included genes were mainly enriched in “inflammatory response”, “immune response” and “innate immune response” (Additional file: Figure S3B). KEGG analysis revealed that the Cluster A-associated modules were principally related to “protein processing in endoplasmic reticulum”, while in the Cluster B-associated modules “cytokine-cytokine receptor interaction” was the major enriched pathway (Additional file: Figure S3C and D).
Determination of the Differences in Functional Enrichment and Immunological Characteristics Between the Clusters Based on FA Metabolism-Related Genes
In order to further explore the differences in the biologically relevant function between the molecular clusters based on FA metabolism-related genes, 545 DEGs were screened out according to the criteria of adjusted p-value < 0.05 and |log2 FC| > = 0.585. Volcano plot and heatmap were presented to show the significant difference in gene expression patterns between the two subtypes (Figure 2A and B). Subsequently, functional enrichment analysis was employed to clearly understand the role of DEGs between these two FA metabolism-related groupings. Gene Ontology (GO) term analysis showed that the DEGs were functionally annotated. Of note, the DEGs were mainly enriched in “inflammatory response”, “immune response” and “extracellular matrix organization” upon biological process analysis (Figure 2C). Interestingly, the expression levels of pro-fibrotic genes (FN1, COL1A1, and ACTA2) were significantly higher in Cluster B than those in Cluster A. Meanwhile, compared to Cluster B, pro-inflammatory genes, such as CCL18, CCL2, and TNFRSF12A, showed markedly lower expression levels in Cluster A, suggesting the distinct status of the patients with DN (Figure 2D).
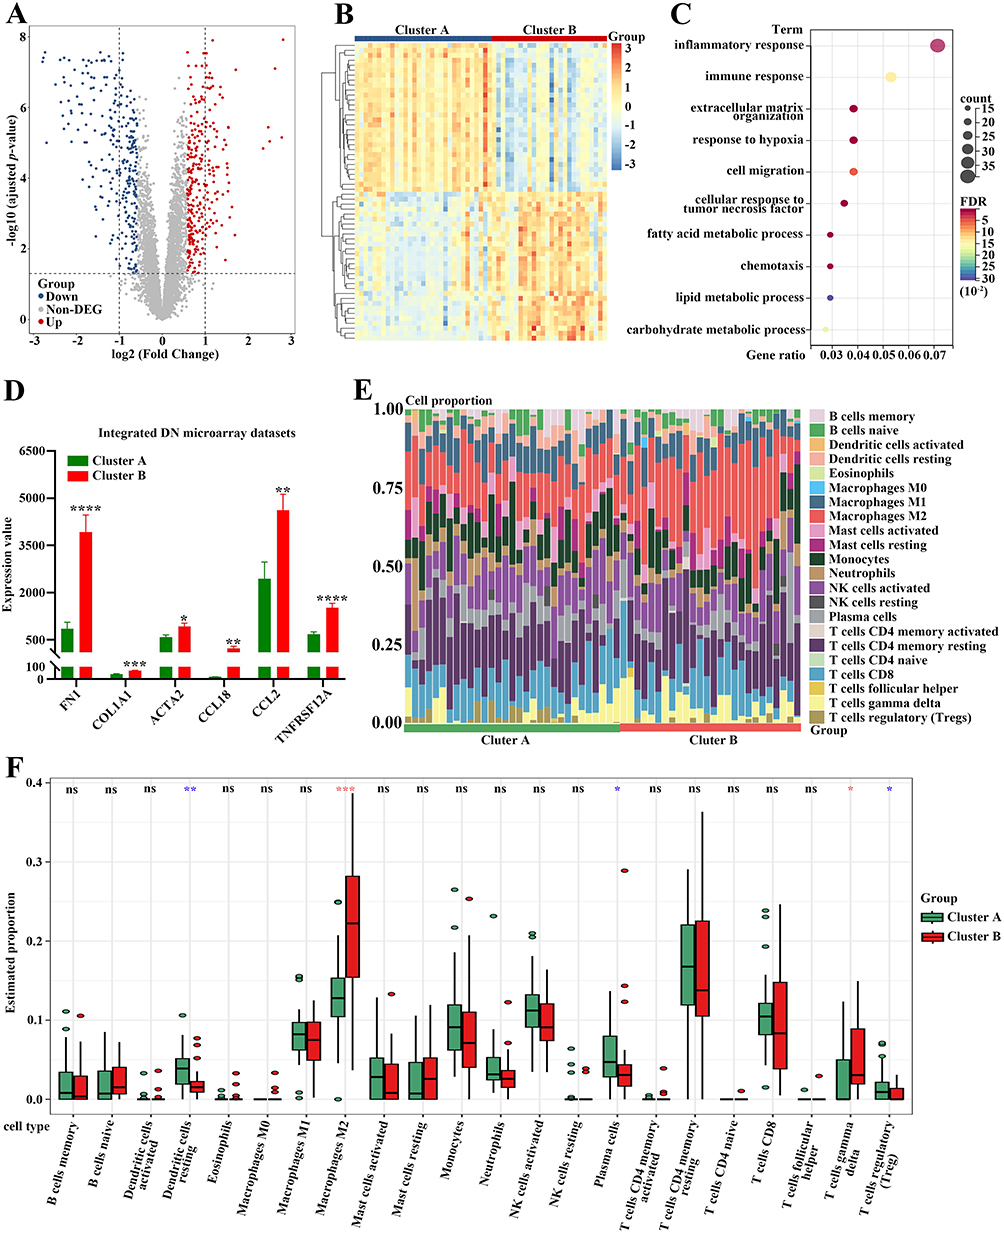 |
Figure 2 Functional enrichment analysis and immune cell infiltration analysis between these two subtypes. (A) The volcano plot of the DEGs between these two subtypes. (B) The heatmap of the DEGs between these two subtypes. (C) GO analysis of the DEGs upon the biological process. (D) The differential expression of FN1, COL1A1, ACTA2, CCL18, CCL2 and TNFRSF12A between these two subtypes. (E) The stacked histogram for the immune cell abundances between Cluster A and Cluster B of DN patients. (F) The violin diagram exhibiting the differences of immune cells between Cluster A and Cluster B. Red asterisks showing the increased number of immune cells infiltration in Cluster B, whereas blue asterisks indicating the reduction in Cluster B. *p-value < 0.05; **p-value < 0.01; ***p-value < 0.001; ****p-value < 0.0001. Abbreviation: ns, not significant. |
Given that DEGs were closely associated with inflammatory and immune processes, the CIBERSORT algorithm was performed to clarify the characteristics of immune cell infiltration according to gene expression in immune cells between these two groupings. The proportions for 22 types of immune cells in each sample are presented in Figure 2E. Notably, five subpopulations of immune cells exhibited significant differences between cluster A and cluster B (Figure 2F). Samples in Cluster A had higher proportions of “Dendritic cells resting”, “Plasma cells”, and “T cells regulatory (Tregs)” than those in Cluster B. However, the lower abundances of “Macrophages M2” and “T cells gamma delta” were observed in Cluster A compared to Cluster B (Figure 2F).
Relationship Between the Differentially Expressed FA Metabolism-Related Genes and Immune Cell Infiltration
The immune landscape in kidney samples of patients with DN was dramatically changed (Figure 3A). The correlation analysis for 22 types of immune cells in DN samples showed that the proportion of “T cells CD8” was significantly negatively correlated to that of “T cells CD4 memory resting” (r = −0.73), and the abundance of “Mast cells activated” was negatively associated with that of “Mast cells resting” (r = −0.86) (Figure 3B). We further explored the relationship between the expression of differentially expressed FA metabolism-related genes and the abundance of immune cells (Figure 3C). Interestingly, the results indicated that “T cells gamma delta” was positively associated with PLA2G4A, SOX9, CD36, and C3, whereas “Macrophages M2” was positively correlated to APOC1 but negatively correlated to PTGDS (Figure 3D and E). In addition, infiltrated “Neutrophils” was closely positively related to HPGD in kidney samples of patients with DN (Figure 3F).
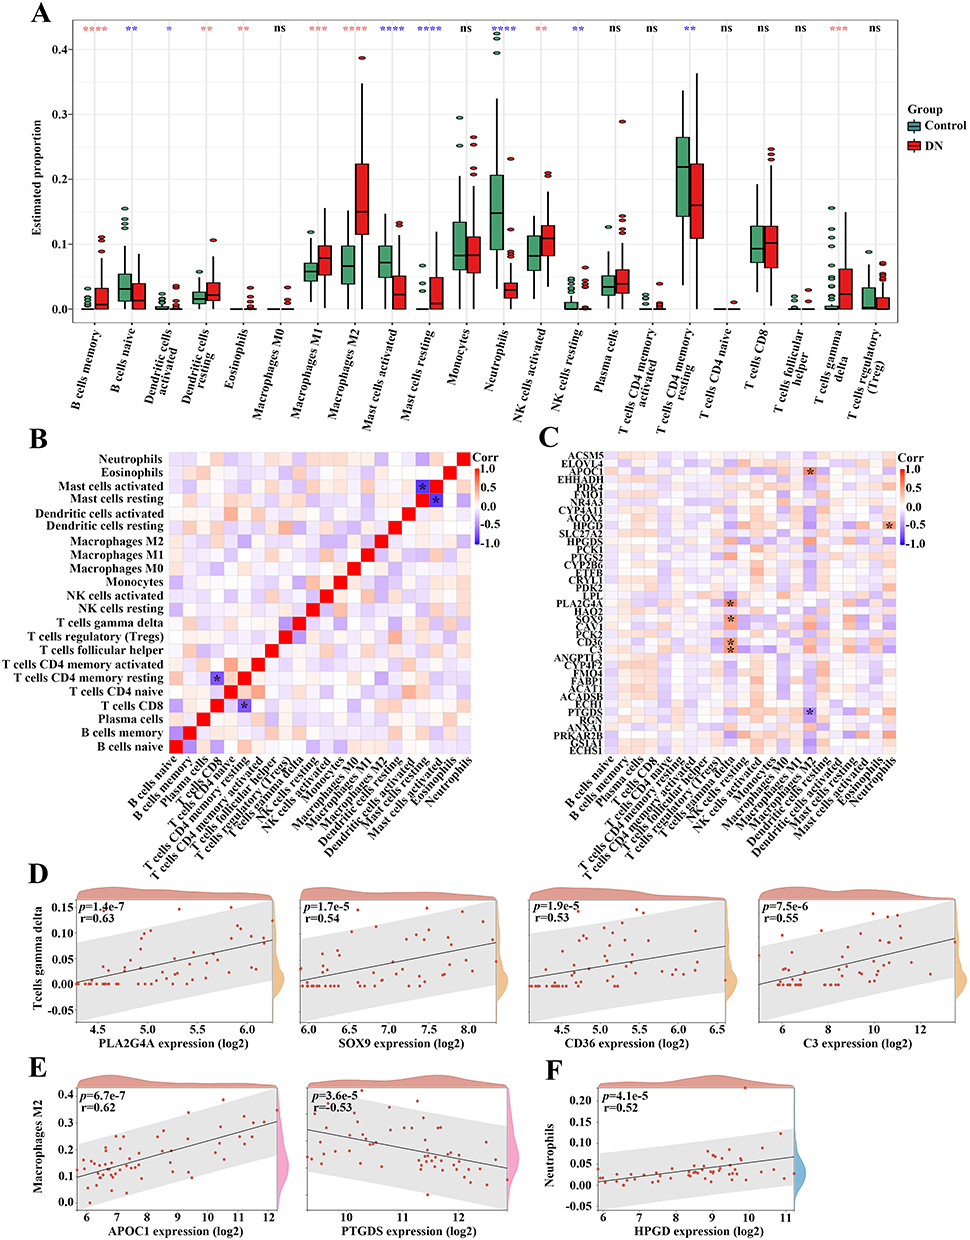 |
Figure 3 The correlation of differentially expressed FA metabolism-related genes with the immune landscape in DN patients. (A) The violin diagram showing the immune cell differences between individuals with or without DN. Red asterisks exhibiting a high proportion of immune cell accumulation in DN, whereas blue asterisks displaying a decrease in DN. (B) The heatmap indicating the correlation among recruited immune cells in DN. (C) The correlation map for the differentially expressed FA metabolism-related genes and recruited immune cells in DN. (D) The association between the expression of PLA2G4A, SOX9, CD36, and C3 with the proportion of T cells gamma delta in DN. (E) The relation between the expression of APOC1 and PTGDS with the proportion of Macrophages M2 in DN. (F) The correlation between the expression of HPGD with the proportion of Neutrophils in DN. *p-value < 0.05; **p-value < 0.01; ***p-value < 0.001; ****p-value < 0.0001. Abbreviation: ns, not significant. |
Prediction of Candidate Small Molecular Drugs for Treating FA Metabolism-Based DN Subtypes with Poor Outcomes
Molecular subtyping can be carried out not only to reveal the distinct characteristic of DN but also to facilitate precise therapeutic strategies. As indicated by higher expression of pro-fibrotic and pro-inflammatory factors (Figure 2D), patients in Cluster B exhibited worse outcomes than those in Cluster A. Thus, based on the original therapeutic strategy, supplemented novel drugs for patients in Cluster B were urged to be discovered. First, Up-regulated genes in Cluster B (DN-Cluster B vs Control) were identified according to the cut-off value of adjusted p-value < 0.05 and log2 FC > = 1 (Figure 4A–B). Of note, the overlapped genes between up-regulated genes and genes included in the key module of Cluster B (Additional file: Figure S2G) were imported to the connectivity map (CMAP) database to predict potential small-molecule drugs for further treatment (Figure 4C). By using QUERY CMAP, the top 10 small-molecule drugs, which exhibited the highest negative scores, were identified and considered to be candidate pharmacological therapies for FA metabolism-based Cluster B of patients with DN (Figure 4D). The targeted signaling pathways and chemical structures of these drugs are detailly shown in Figure 4E.
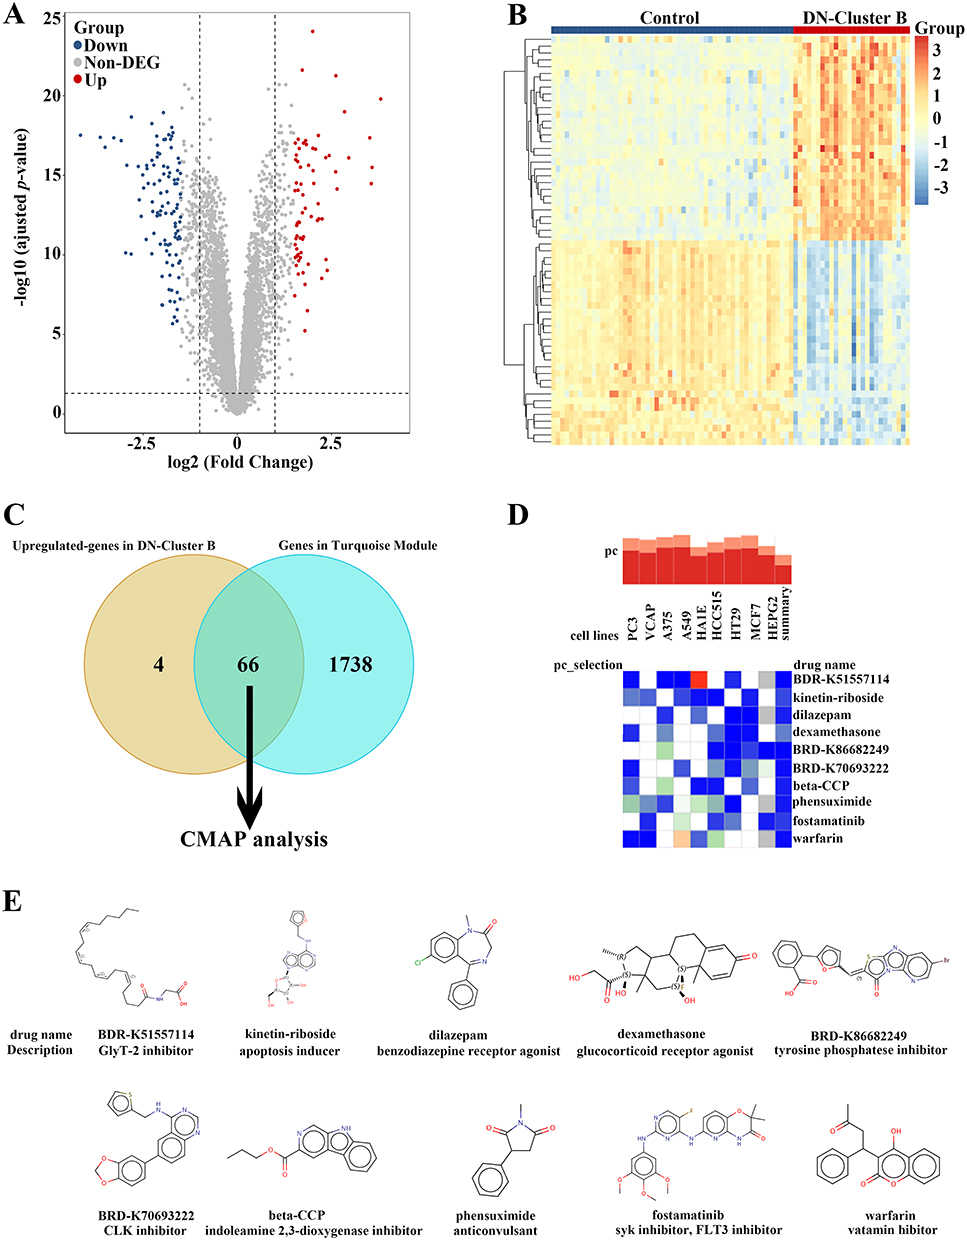 |
Figure 4 Prediction of the potential small-molecular drugs for treating FA metabolism-based subtypes of DN by CMAP analysis. (A) The volcano plot of the DEGs between control individuals and DN-Cluster B patients. (B) The heatmap of the DEGs between control individuals and DN-Cluster B patients. (C) The Venn diagram identifying 66 key up-regulated genes in DN-Cluster B patients for CMAP analysis. (D) The heatmap showing the top 10 drugs with the highest negative scores in 9 cell lines with CMAP analysis. (E) The chemical structures and detailed description of these top 10 drugs. |
Establishment of a Prediction Model Based on FA Metabolism-Related Genes via Machine Learning Algorithms
To screen out the potential diagnostic biomarkers to distinguish patients with DN, the LASSO regression algorithm was employed to reveal 11 potential diagnostic biomarkers out of 39 differentially expressed FA metabolism-related genes (Figure 5A and B). Moreover, using the SVM-RFE algorithm, 7 FA metabolism-related genes were determined as candidate biomarkers (Figure 5C). After intersecting the potential biomarkers extracted from LASSO and SVM-RFE algorithms, only two genes (PRKAR2B and ANXA1) were overlapped via a Venn diagram and were regarded as optimum diagnostic biomarkers (Figure 5D). For better performance in DN prediction, a prediction model was established and visualized as a nomogram based on PRKAR2B and ANXA1 expression by carrying out logistics regression analysis (Figure 5E). Thus, by using the established nomogram, we could convert the renal expression of PRKAR2B and ANXA1 into points, respectively, and the total points were obtained by adding of these two points, corresponding to the risk of DN.
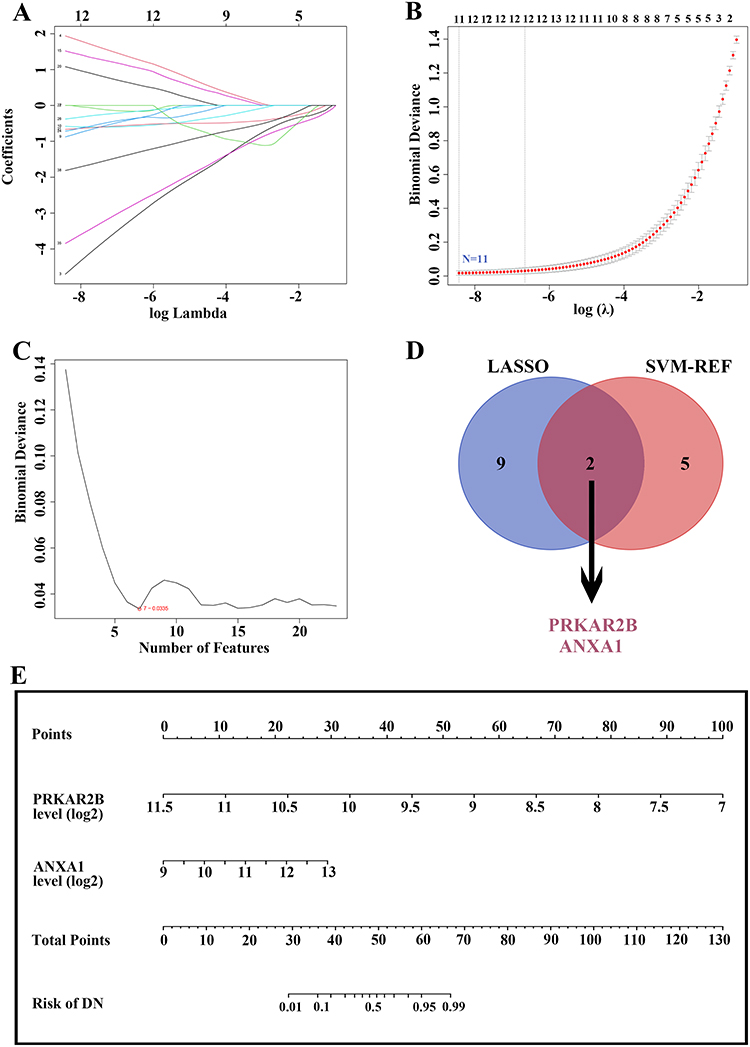 |
Figure 5 Identification of candidate diagnostic biomarkers and construction of a prediction model based on differentially expressed FA metabolism-related genes by machine learning algorithms. (A and B) LASSO algorithm for identifying potential biomarkers for DN diagnosis. The number of genes (N = 11) was selected as the most suitable parameter for DN prediction. (C) SVM-REF algorithm for screening candidate biomarkers for DN diagnosis. The number of genes (N = 7) was chosen as the optimal argument for DN diagnosis. (D) The Venn diagram showing two overlapped reliable diagnostic biomarkers between LASSO and SVM-REF methods. (E) The prediction model was constructed based on the two diagnostic biomarkers. |
Predictive Ability and Performance of the Constructed Nomogram Based on FA Metabolism-Related Genes
The area under the curve (AUC) values of PRKAR2B, ANXA1, and nomogram were 0.95, 0.80, and 0.97, respectively (Figure 6A–C). Moreover, the DN risk prediction nomogram displayed ideal consistency between predictions and actual observations in the DN cohort (Figure 6D). Additionally, the decision curve analysis (DCA) for the nomogram suggested that clinical decision-making based on the nomogram might be beneficial for the prediction of the risk of patients with DN (Figure 6E). Furthermore, the receiver operating characteristic (ROC) curve revealed that the nomogram based on FA metabolism-related genes exhibited a relatively good predictive value of patients with early stages of DN (Figure 6F), implying that the prediction model could also be extensively applied to diagnose the occurrence of early DN.
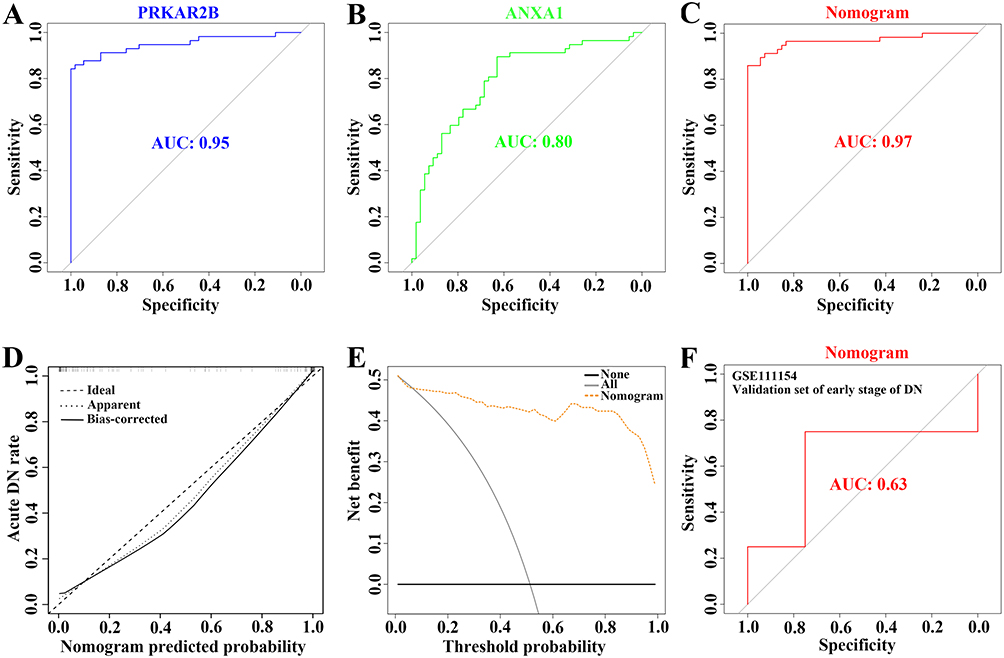 |
Figure 6 Verification of the predictive ability and performance of the constructed prediction model for DN risk. (A–C) The ROC curve evaluating the diagnostic efficacy of PRKAR2B (A) and ANXA1 (B) and the constructed prediction model (C) in the risk of DN prediction. (D) The calibration curve of the prediction model for diagnosing DN patients. (E) The DCA for the prediction model. (F) The ROC curve showing the diagnostic performance of the prediction model in the external dataset with the early stage of DN. |
The Relevance Between FA Metabolism-Related Genes and Clinical Characteristics of DN
To further elaborate the clinical significance of FA metabolism-related genes in DN, we performed the correlation analysis between the renal expression of PRKAR2B and ANXA1 with clinicopathological features, including serum creatinine (SCr) together with glomerular filtration rate (GFR) using Nephroseq v5 online tool. The results showed that the renal PRKAR2B expression was negatively correlated with the SCr level (Figure 7A) and positively associated with GFR in patients with DN (Figure 7B), suggesting that PRKAR2B may exert renoprotective effects in patients with DN. In addition, high renal ANXA1 expression was associated with the increased SCr level and decreased GFR of DN patients (Figure 7C and D), which revealed that renal ANXA1 might be involved in the progression of DN.
 |
Figure 7 Correlation between renal expression of FA metabolism-related genes and clinical characteristics in DN patients. (A and B) The correlation between renal PRKAR2B expression and the SCr level (A) or GFR (B) in DN. (C and D) The association of renal ANXA1 expression with the SCr level (C) or GFR (D) in DN. |
Validation of Data in the Animal Model of DN
The renal expression levels of PRKAR2B and ANXA1 were obtained from the integrated DN microarray datasets, and the results showed that PRKAR2B was significantly decreased, while ANXA1 was increased in patients with DN (Figure 8A). To confirm the results of bioinformatics analysis, we firstly established an experimental STZ/High-fat diet (HFD)-induced diabetic mouse model of DN (Figure 8B). We found that multiple renal functional indicators, including blood glucose, serum creatinine (SCr), blood urea nitrogen (BUN), and urine albumin as well as urine albumin/creatinine (UACR), were significantly elevated, and urine creatinine (UCr) was markedly decreased in the diabetic mice, compared to the control mice (Figure 8C). Moreover, PAS staining showed mesangial matrix expansion and increased mesangial matrix index, and Masson’s trichrome staining displayed excessive collagen deposition in both glomeruli and renal interstitium in diabetic mice, indicating successful establishment of the DN animal model (Figure 8D-E). Next, we assessed the mRNA and protein levels of PRKAR2B and ANXA1 in the DN and control mice. Consistent with the bioinformatics results of DN datasets, the DN animal model displayed similar renal expression patterns of PRKAR2B and ANXA1, in which the mRNA and protein levels of PRKAR2B were significantly decreased, whereas those of ANXA1 were increased in the kidney tissues of the DN mice compared to the control mice (Figures 8F, 9A and B).
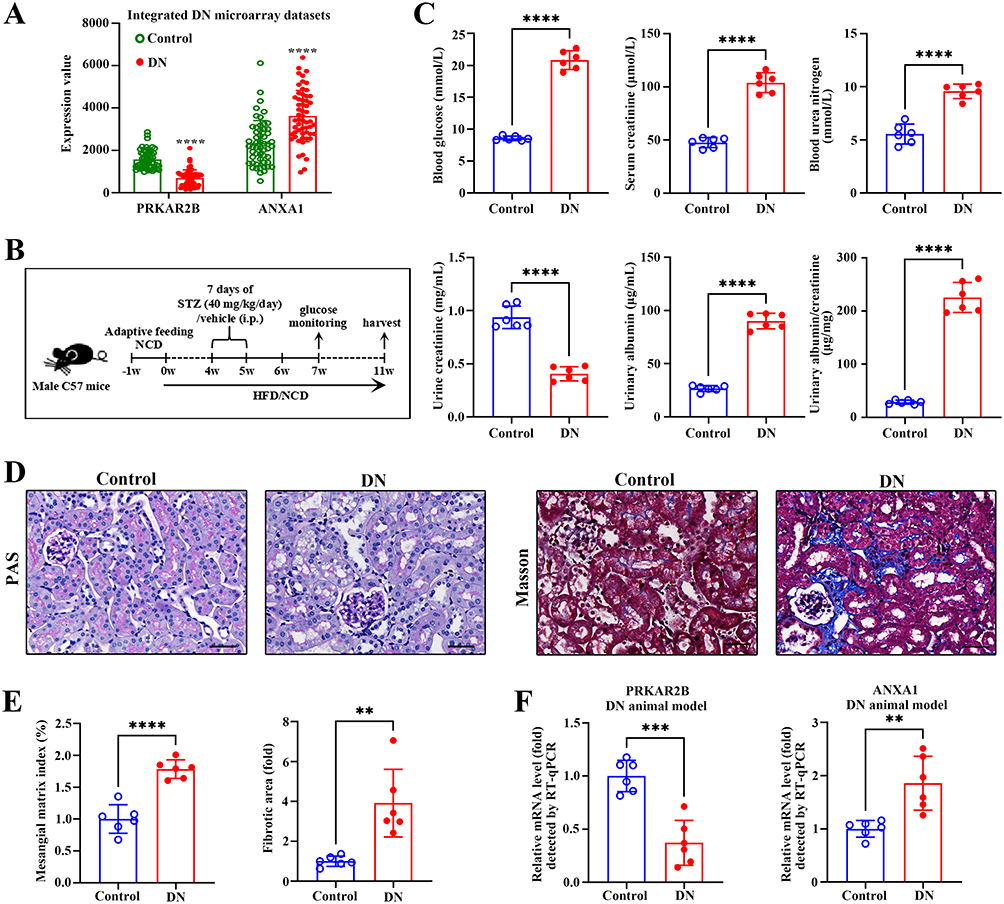 |
Figure 8 Validation of data in the experimental DN animal model. (A) The expression levels of PRKAR2B and ANXA1 in the integrated DN microarray datasets. (B) The flow diagram for establishing an experimental animal model. (C) The blood glucose, serum creatinine, blood urea nitrogen, urine creatinine, and urinary albumin were measured, and the urinary albumin/creatinine (UACR) was calculated. (D) The PAS and Masson’s trichrome staining of the control and DN kidney samples. Bar scale, 50 μm. (E) The quantification of mesangial matrix index and fibrotic area between the control and DN kidney samples. (F) RT-qPCR detected the mRNA levels of PRKAR2B and ANXA1 in the kidney tissues of mice with STZ/HFD-induced DN and in those of the control mice. Data are shown as mean ± SD from groups of six mice. **p-value < 0.01; ***p-value < 0.001; ****p-value < 0.0001. |
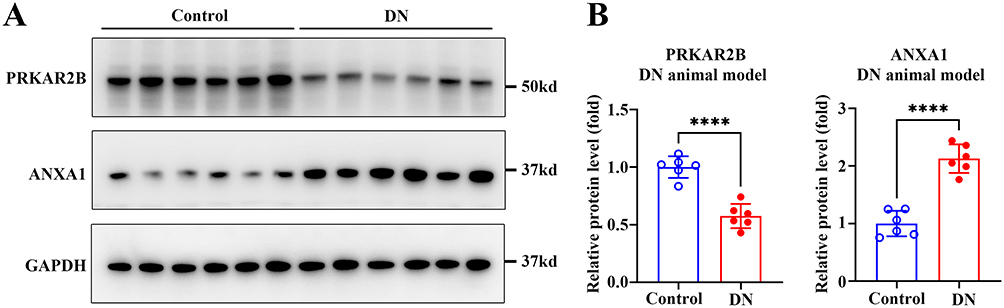 |
Figure 9 Detection of the protein levels of PRKAR2B and ANXA1 in the experimental DN animal model. (A) The protein levels of PRKAR2B and ANXA1 in the kidney tissues of mice with STZ/HFD-induced DN and in those of the control mice. (B) Quantitative grey values of protein expression are shown. Data are shown as mean ± SD from groups of six mice. ****p-value < 0.0001. |
Discussion
With the development of the second-generation sequencing technology and the standardized establishment of public databases, more and more DN-related transcriptome information has been found and clarified, providing scientific guidance for early diagnosis of diabetes mellitus progression to DN and the exploration of DN pathogenesis. Recent evidence implies that FA metabolism-related genes may participate in the pathogenetic process of DN, but the underlying mechanism of FA metabolism-mediated DN progression has not been fully explained in the existing studies. In this study, we performed an in-depth study on the role of FA metabolism-related genes in DN by integrated bioinformatics analysis and machine learning. A total of 39 differentially expressed FA metabolism-related genes were identified based on analysis of the combined dataset from 54 DN and 57 control kidney samples. Importantly, patients with DN were classified into two subclusters according to the FA metabolism signature. Enrichment analysis of the DEGs and abundance analysis of immune cells between the two subtypes revealed that the significant differences were the immune responses and ECM deposition. Moreover, we also discovered potential drugs for the precise treatment of FA metabolism signature-classified DN subtypes. Furthermore, the FA metabolism-related diagnostic nomogram model was established and evaluated comprehensively, unveiling that this model effectively distinguished patients with DN, regardless of the early or advanced stages of DN. These findings may provide a comprehensive overview of FA metabolism in diabetes-induced kidney injuries and may be beneficial to uncover the underlying mechanisms and precise medication of DN.
Impairment of lipid metabolism, especially FA metabolism, may be involved in kidney diseases (eg, acute/chronic kidney diseases and glomerulonephritis), which has started to attract public attention.41–44 Inhibiting the oxidative process of FA improves kidney function in DN mice,25 suggesting that dysregulation of FA metabolism may also contribute to the onset and progression of DN. However, the regulatory role of FA metabolism in DN remains obscure. Here, two subtypes of DN were identified based on differentially expressed FA metabolism-related genes. The enrichment analysis based on the DEGs between these two groups suggests that the underlying mechanism of FA metabolism in DN may be closely associated with “inflammatory/responses” and “extracellular matrix organization”. Increasing studies have demonstrated that the recruitment of multiple types of immune cells in the kidney can be observed in different experimental DN animal models45,46 and clinical biopsy samples at all stages of DN.47 Both the innate immune system (eg, macrophages and dendritic cells)48 and the adaptive immune system (eg, T cells and B cells) may participate in the progression of DN.49 In this study, we noticed that the alteration of the immune landscape was also closely correlated to FA metabolism-related genes-based groupings, as indicated by infiltrated immune cell analysis in the present study. A total of five types of immune cells, including “Dendritic cells resting”, “Plasma cells”, “Treg”, “Macrophages M2”, and “T cells gamma delta”, were differentially recruited in two distinct DN subgroups. Furthermore, the expression of FA metabolism-related genes was associated with the abundance of “Macrophages M2”, “T cells gamma delta”, and “Neutrophils”, demonstrating that FA metabolism was involved in the regulation of immune cell accumulation in patients with DN.
The concept of precise medication has facilitated the classification of patients. Different subtypes may display different pathogenic mechanisms and clinical outcomes. It has been widely accepted that activation of ECM organization leads to the accelerated accumulation of ECM and the progression of renal fibrosis in DN, indicating poor outcomes of kidney function.50 This study found the increased expression of pro-fibrotic factors (eg, FN1, COL1A1, and ACTA2) in patients within Cluster B compared to Cluster A. Given the poor clinical outcomes of patients in Cluster B, potential complementary drugs on the basis of typical therapeutic methods for precise treatment need to be explored. During the last few decades, small-molecular drugs targeting a series of diseases have achieved great success.51,52 Several merits, including high tissue penetration, a tunable half-life, and oral bioavailability, have made small-molecular drugs more effective in conducting precise medication. Using CMAP analysis, several small-molecule drugs for the precise medication of patients in Cluster B were screened based on key genes included in both subsets (up-regulated genes and crucial module genes of Cluster B), whereas further trials are needed for assessing the therapeutic effects of those drugs in ameliorating kidney function of DN patients in Cluster B.
So far, challenges still exist in the diagnosis of DN due to the limited ideal clinical indicators and the heterogeneity of lesions in the kidney.53 Thus, potential biomarkers which exhibit high specificity and sensitivity are still urgently identified. Recently, FA metabolism-related genes have been suggested to be helpful for the risk prediction of various cancers.54–56 However, the diagnostic performance of FA metabolism-related genes for DN has yet to be explored. In this study, machine learning methods, including LASSO and SVM-REF, were used to explore the candidate FA metabolism-related biomarkers to effectively distinguish DN patients. PRKAR2B and ANXA1 with optimal predictive efficacy were eventually identified. The most noteworthy finding in this study was that a more comprehensive prediction model based on these two biomarkers was established to improve the diagnostic efficacy of DN. Furthermore, an external dataset also validated that the diagnostic model was efficient in predicting the risk of patients with DN of early stages, suggesting the FA metabolism-related prediction model constructed in our study is beneficial for diagnosing patients with DN of different stages. Additionally, significant clinical correlations were found between these two biomarkers and renal function such as SCr level and GFR. Thus, both renal PRKAR2B and ANXA1 have the potential to be biomarkers for predicting the severity of DN.
In summary, our results brought a comprehensive overview of FA metabolism in patients with DN. We demonstrated the potential association between FA metabolism signature and infiltrating immune cells as well as extracellular matrix organization, explored precise medication targeting distinct DN clusters based on FA metabolism-related genes, and identified PRKAR2B/ANXA1 as the candidate biomarkers for patients with DN by LASSO and SVM-REF algorithms. Furthermore, a prediction model combining PRKAR2B and ANXA1 was constructed to diagnose DN of early and advanced stages with high accuracy. Therefore, these findings may elucidate the role of FA metabolism in diabetic kidney injury, providing evidence for better management and therapy of patients with DN.
Data Sharing Statement
We downloaded and analyzed the public datasets (GSE96804, GSE30528, GSE104948, and GSE111154) from the GEO data repository.
Author Contributions
All authors made a significant contribution to the work reported, whether that is in the conception, study design, execution, acquisition of data, analysis and interpretation, or in all these areas; took part in drafting, revising or critically reviewing the article; gave final approval of the version to be published; have agreed on the journal to which the article has been submitted; and agree to be accountable for all aspects of the work.
Funding
This study was supported by grants from Guangdong Basic and Applied Basic Research Foundation (2020A1515111077) and China Postdoctoral Science Foundation Funded Project (2021M693672).
Disclosure
There were no competing interests.
References
1. Demir Y, Ceylan H, Türkeş C, Beydemir Ş. Molecular docking and inhibition studies of vulpinic, carnosic and usnic acids on polyol pathway enzymes. J Biomol Struct Dyn. 2022;40(22):12008–12021. doi:10.1080/07391102.2021.1967195
2. Sever B, Altıntop MD, Demir Y, et al. Design, synthesis, in vitro and in silico investigation of aldose reductase inhibitory effects of new thiazole-based compounds. Bioorg Chem. 2020;102:104110. doi:10.1016/j.bioorg.2020.104110
3. Bellary S, Kyrou I, Brown JE, Bailey CJ. Type 2 diabetes mellitus in older adults: clinical considerations and management. Nat Rev Endocrinol. 2021;17(9):534–548. doi:10.1038/s41574-021-00512-2
4. Hu Q, Chen Y, Deng X, et al. Diabetic nephropathy: focusing on pathological signals, clinical treatment, and dietary regulation. Biomed Pharmacother. 2023;159:114252. doi:10.1016/j.biopha.2023.114252
5. Sharma D, Bhattacharya P, Kalia K, Tiwari V. Diabetic nephropathy: new insights into established therapeutic paradigms and novel molecular targets. Diabetes Res Clin Pract. 2017;128:91–108. doi:10.1016/j.diabres.2017.04.010
6. Kato M, Natarajan R. Epigenetics and epigenomics in diabetic kidney disease and metabolic memory. Nat Rev Nephrol. 2019;15(6):327–345. doi:10.1038/s41581-019-0135-6
7. Sever B, Altıntop MD, Demir Y, et al. Identification of a new class of potent aldose reductase inhibitors: design, microwave-assisted synthesis, in vitro and in silico evaluation of 2-pyrazolines. Chem Biol Interact. 2021;345:109576. doi:10.1016/j.cbi.2021.109576
8. Sever B, Altıntop MD, Demir Y, et al. An extensive research on aldose reductase inhibitory effects of new 4H-1, 2, 4-triazole derivatives. J Mol Struct. 2021;1224:129446. doi:10.1016/j.molstruc.2020.129446
9. Warren AM, Knudsen ST, Cooper ME. Diabetic nephropathy: an insight into molecular mechanisms and emerging therapies. Expert Opinion Therap Targets. 2019;23(7):579–591. doi:10.1080/14728222.2019.1624721
10. Liu L, Bai F, Song H, et al. Upregulation of TIPE1 in tubular epithelial cell aggravates diabetic nephropathy by disrupting PHB2 mediated mitophagy. Redox Biol. 2022;50:102260. doi:10.1016/j.redox.2022.102260
11. Türkeş C, Arslan M, Demir Y, et al. N-substituted phthalazine sulfonamide derivatives as non-classical aldose reductase inhibitors. J Mol Recog. 2022;35(12):e2991. doi:10.1002/jmr.2991
12. Akdağ M, Özçelik AB, Demir Y, Beydemir Ş. Design, synthesis, and aldose reductase inhibitory effect of some novel carboxylic acid derivatives bearing 2-substituted-6-aryloxo-pyridazinone moiety. J Mol Struct. 2022;1258:132675. doi:10.1016/j.molstruc.2022.132675
13. Rossing P, Anker SD, Filippatos G, et al. Finerenone in patients with chronic kidney disease and type 2 diabetes by sodium–glucose cotransporter 2 inhibitor treatment: the FIDELITY Analysis. Diabetes Care. 2022;45(12):2991–2998. doi:10.2337/dc22-0294
14. Sharma D, Verma S, Vaidya S, Kalia K, Tiwari V. Recent updates on GLP-1 agonists: current advancements & challenges. Biomed Pharmacother. 2018;108:952–962. doi:10.1016/j.biopha.2018.08.088
15. Tokalı FS, Demir Y, Türkeş C, Dinçer B, Beydemir Ş. Novel acetic acid derivatives containing quinazolin-4(3H)-one ring: synthesis, in vitro, and in silico evaluation of potent aldose reductase inhibitors. Drug Dev Res. 2023;84(2):275–295. doi:10.1002/ddr.22031
16. Ertano BY, Demir Y, Nural Y, Erdoğan O. Investigation of the effect of acylthiourea derivatives on diabetes‐associated enzymes. ChemistrySelect. 2022;7(46):e202204149. doi:10.1002/slct.202204149
17. Fioretto P, Mauer M. Diabetic nephropathy—challenges in pathologic classification. Nat Rev Nephrol. 2010;6(9):508–510. doi:10.1038/nrneph.2010.96
18. Gao Z, Chen X. Fatty acid β-oxidation in kidney diseases: perspectives on pathophysiological mechanisms and therapeutic opportunities. Front Pharmacol. 2022;13:805281.
19. Palabıyık E, Sulumer AN, Uguz H, et al. Assessment of hypolipidemic and anti-inflammatory properties of walnut (Juglans regia) seed coat extract and modulates some metabolic enzymes activity in triton WR-1339-induced hyperlipidemia in rat kidney, liver, and heart. J Mol Recog. 2023;36(3):e3004. doi:10.1002/jmr.3004
20. Çağlayan C, Taslimi P, Demir Y, et al. The effects of zingerone against vancomycin‐induced lung, liver, kidney and testis toxicity in rats: the behavior of some metabolic enzymes. J Biochem Mol Toxicol. 2019;33(10):e22381. doi:10.1002/jbt.22381
21. Gray SP, Di Marco E, Okabe J, et al. NADPH oxidase 1 plays a key role in diabetes mellitus–accelerated atherosclerosis. Circulation. 2013;127(18):1888–1902. doi:10.1161/CIRCULATIONAHA.112.132159
22. Ghosh A, Gao L, Thakur A, Siu PM, Lai CW. Role of free fatty acids in endothelial dysfunction. J Biomed Sci. 2017;24(1):1–15. doi:10.1186/s12929-017-0357-5
23. De Vries AP, Ruggenenti P, Ruan XZ, et al. Fatty kidney: emerging role of ectopic lipid in obesity-related renal disease. Lancet Diabetes Endocrinol. 2014;2(5):417–426. doi:10.1016/S2213-8587(14)70065-8
24. Miguel V, Tituaña J, Herrero JI, et al. Renal tubule Cpt1a overexpression protects from kidney fibrosis by restoring mitochondrial homeostasis. J Clin Invest. 2021;131(5). doi:10.1172/JCI140695
25. Shu Z, Chen S, Xiang H, et al. AKT/PACS2 participates in renal vascular hyperpermeability by regulating endothelial fatty acid oxidation in diabetic mice. Front Pharmacol. 2022;13. doi:10.3389/fphar.2022.876937
26. Yao F, Li Z, Ehara T, et al. Fatty acid-binding protein 4 mediates apoptosis via endoplasmic reticulum stress in mesangial cells of diabetic nephropathy. Mol Cell Endocrinol. 2015;411:232–242. doi:10.1016/j.mce.2015.05.003
27. Zhang Y, Kurupati R, Liu L, et al. Enhancing CD8+ T cell fatty acid catabolism within a metabolically challenging tumor microenvironment increases the efficacy of melanoma immunotherapy. Cancer Cell. 2017;32(3):377–391. e379. doi:10.1016/j.ccell.2017.08.004
28. Chen J, Liu Q, He J, Li Y. Immune responses in diabetic nephropathy: pathogenic mechanisms and therapeutic target. Front Immunol. 2022;13:958790. doi:10.3389/fimmu.2022.958790
29. Leek JT, Johnson WE, Parker HS, Jaffe AE, Storey JD. The sva package for removing batch effects and other unwanted variation in high-throughput experiments. Bioinformatics. 2012;28(6):882–883. doi:10.1093/bioinformatics/bts034
30. Ritchie ME, Phipson B, Wu D, et al. limma powers differential expression analyses for RNA-sequencing and microarray studies. Nucleic Acids Res. 2015;43(7):e47. doi:10.1093/nar/gkv007
31. Wilkerson MD, Hayes DN. ConsensusClusterPlus: a class discovery tool with confidence assessments and item tracking. Bioinformatics. 2010;26(12):1572–1573. doi:10.1093/bioinformatics/btq170
32. Langfelder P, Horvath S. WGCNA: an R package for weighted correlation network analysis. BMC Bioinf. 2008;9(1):1–13. doi:10.1186/1471-2105-9-559
33. Steen CB, Liu CL, Alizadeh AA, Newman AM. Profiling cell type abundance and expression in bulk tissues with CIBERSORTx. In: Stem Cell Transcriptional Networks. Springer; 2020:135–157.
34. Gao Y, Kim S, Lee Y-I, Lee J. Cellular stress-modulating drugs can potentially be identified by in silico screening with connectivity map (CMap). Int J Mol Sci. 2019;20(22):5601. doi:10.3390/ijms20225601
35. Friedman J, Hastie T, Tibshirani R. Regularization paths for generalized linear models via coordinate descent. J Stat Software. 2010;33(1). doi:10.18637/jss.v033.i01
36. Lin X, Yang F, Zhou L, et al. A support vector machine-recursive feature elimination feature selection method based on artificial contrast variables and mutual information. J Chromatogr B. 2012;910:149–155. doi:10.1016/j.jchromb.2012.05.020
37. Harrell FE. RMS: Regression Modeling Strategies. R Package Version 5.1-2. Nashville, TN, USA: Dept. Biostatist., Vanderbilt Univ; 2017.
38. Sharma D, Tekade RK, Kalia K. Kaempferol in ameliorating diabetes-induced fibrosis and renal damage: an in vitro and in vivo study in diabetic nephropathy mice model. Phytomedicine. 2020;76:153235. doi:10.1016/j.phymed.2020.153235
39. Burnette WN. “Western blotting”: electrophoretic transfer of proteins from sodium dodecyl sulfate-polyacrylamide gels to unmodified nitrocellulose and radiographic detection with antibody and radioiodinated protein A. Anal Biochem. 1981;112(2):195–203. doi:10.1016/0003-2697(81)90281-5
40. Sharma D, Gondaliya P, Tiwari V, Kalia K. Kaempferol attenuates diabetic nephropathy by inhibiting RhoA/Rho-kinase mediated inflammatory signalling. Biomed Pharmacother. 2019;109:1610–1619. doi:10.1016/j.biopha.2018.10.195
41. Li B, Hao J, Zeng J, Sauter ER. SnapShot: FABP functions. Cell. 2020;182(4):1066–1066. e1061. doi:10.1016/j.cell.2020.07.027
42. Li L, Tao S, Guo F, et al. Genetic and pharmacological inhibition of fatty acid-binding protein 4 alleviated inflammation and early fibrosis after toxin induced kidney injury. Int Immunopharmacol. 2021;96:107760. doi:10.1016/j.intimp.2021.107760
43. Labes R, Dong L, Mrowka R, et al. Annexin A1 exerts renoprotective effects in experimental crescentic glomerulonephritis. Front Physiol. 2022;13:2164.
44. Li J, Yang Y, Li Q, et al. STAT6 contributes to renal fibrosis by modulating PPARα-mediated tubular fatty acid oxidation. Cell Death Dis. 2022;13:1–11.
45. Chow FY, Nikolic-Paterson DJ, Atkins RC, Tesch GH. Macrophages in streptozotocin-induced diabetic nephropathy: potential role in renal fibrosis. Nephrol Dial Transplant. 2004;19(12):2987–2996. doi:10.1093/ndt/gfh441
46. Chow F, Ozols E, Nikolic-Paterson DJ, Atkins RC, Tesch GH. Macrophages in mouse type 2 diabetic nephropathy: correlation with diabetic state and progressive renal injury. Kidney Int. 2004;65(1):116–128. doi:10.1111/j.1523-1755.2004.00367.x
47. Tervaert TWC, Mooyaart AL, Amann K, et al. Pathologic classification of diabetic nephropathy. J Am Soc Nephrol. 2010;21(4):556–563. doi:10.1681/ASN.2010010010
48. Tang SC, Yiu WH. Innate immunity in diabetic kidney disease. Nat Rev Nephrol. 2020;16(4):206–222. doi:10.1038/s41581-019-0234-4
49. Tesch GH. Diabetic nephropathy–is this an immune disorder? Clin Sci. 2017;131:2183–2199.
50. Hills C, Siamantouras E, Smith SW, et al. TGFβ modulates cell-to-cell communication in early epithelial-to-mesenchymal transition. Diabetologia. 2012;55(3):812–824. doi:10.1007/s00125-011-2409-9
51. Li L, Zhang CT, Zhu FY, et al. Potential natural small molecular compounds for the treatment of chronic obstructive pulmonary disease: an overview. Front Pharmacol. 2022;13:911.
52. Zhang B, Dömling A. Small molecule modulators of IL-17A/IL-17RA: a patent review (2013–2021). Expert Opin Ther Patents. 2022;32(11):1161–1173. doi:10.1080/13543776.2022.2143264
53. Lei L, Bai Y, Fan Y, et al. Comprehensive diagnostics of diabetic nephropathy by transcriptome RNA sequencing. Diabetes Metabol Syndr Obes. 2022;Volume 15:3069–3080. doi:10.2147/DMSO.S371026
54. Wei Z, Cheng G, Ye Y, et al. A fatty acid metabolism signature associated with clinical therapy in clear cell renal cell carcinoma. Front Genetics. 2022;13. doi:10.3389/fgene.2022.894736
55. Zhang Y, Kong X, Xin S, Bi L, Sun X. Discovery of lipid metabolism-related genes for predicting tumor immune microenvironment status and prognosis in prostate cancer. J Oncol. 2022;2022. doi:10.1155/2022/8227806
56. Yang J, Yang X, Guo J, Liu S. A novel fatty acid metabolism-related gene prognostic signature and candidate drugs for patients with hepatocellular carcinoma. PeerJ. 2023;11:e14622. doi:10.7717/peerj.14622
 © 2024 The Author(s). This work is published and licensed by Dove Medical Press Limited. The full terms of this license are available at https://www.dovepress.com/terms.php and incorporate the Creative Commons Attribution - Non Commercial (unported, v3.0) License.
By accessing the work you hereby accept the Terms. Non-commercial uses of the work are permitted without any further permission from Dove Medical Press Limited, provided the work is properly attributed. For permission for commercial use of this work, please see paragraphs 4.2 and 5 of our Terms.
© 2024 The Author(s). This work is published and licensed by Dove Medical Press Limited. The full terms of this license are available at https://www.dovepress.com/terms.php and incorporate the Creative Commons Attribution - Non Commercial (unported, v3.0) License.
By accessing the work you hereby accept the Terms. Non-commercial uses of the work are permitted without any further permission from Dove Medical Press Limited, provided the work is properly attributed. For permission for commercial use of this work, please see paragraphs 4.2 and 5 of our Terms.