Back to Journals » OncoTargets and Therapy » Volume 11
Comprehensive analysis of a long noncoding RNA-associated competing endogenous RNA network in colorectal cancer
Received 28 November 2017
Accepted for publication 3 March 2018
Published 1 May 2018 Volume 2018:11 Pages 2453—2466
DOI https://doi.org/10.2147/OTT.S158309
Checked for plagiarism Yes
Review by Single anonymous peer review
Peer reviewer comments 4
Editor who approved publication: Dr Samir Farghaly
Qiaowei Fan,1,2 Bingrong Liu1
1Department of Gastroenterology and Hepatology, The Second Affiliated Hospital of Harbin Medical University, Harbin, Heilongjiang, People’s Republic of China; 2Translational Medicine Research and Cooperation Center of Northern China, Heilongjiang Academy of Medical Sciences, Harbin, Heilongjiang, People’s Republic of China
Purpose: This study was aimed to develop a lncRNA-associated competing endogenous RNA (ceRNA) network to provide further understanding of the ceRNA regulatory mechanism and pathogenesis in colorectal cancer (CRC).
Patients and methods: Expression profiles of mRNAs, lncRNAs, and miRNAs, and clinical information for CRC patients were obtained from The Cancer Genome Atlas. The differentially expressed mRNAs, lncRNAs, and miRNAs (referred to as “DEmRNAs”, “DElncRNAs”, and “DEmiRNAs”, respectively) were screened out between 539 CRC samples and 11 normal samples. The interactions between DElncRNAs and DEmiRNAs were predicted by miRcode. The DEmRNAs targeted by the DEmiRNAs were retrieved according to TargetScan, miRTarBase, and miRDB. The lncRNA–miRNA–mRNA ceRNA network was constructed based on the DEmiRNA–DElncRNA and DEmiRNA–DEmRNA interactions. Functional enrichment analysis revealed the biological processes and pathways of DEmRNAs involved in the development of CRC. Key lncRNAs were further analyzed for their associations with overall survival and clinical features of CRC patients.
Results: A total of 1,767 DEmRNAs, 608 DElncRNAs, and 283 DEmiRNAs were identified as CRC-specific RNAs. Three hundred eighty-two DEmiRNA–DElncRNA interactions and 68 DEmiRNA–DEmRNA interactions were recognized according to the relevant databases. The lncRNA–miRNA–mRNA ceRNA network was constructed using 25 DEmiRNAs, 52 DEmRNAs, and 64 DElncRNAs. Two DElncRNAs, five DEmiRNAs, and six DEmRNAs were demonstrated to be related to the prognosis of CRC patients. Four DElncRNAs were found to be associated with clinical features. Twenty-eight Gene Ontology terms and 10 Kyoto Encyclopedia of Genes and Genomes pathways were found to be significantly enriched by the DEmRNAs in the ceRNA network.
Conclusion: Our results showed cancer-specific mRNA, lncRNA, and miRNA expression patterns and enabled us to construct an lncRNA-associated ceRNA network that provided new insights into the molecular mechanisms of CRC. Key RNA transcripts related to the overall survival and clinical features were also found with promising potential as biomarkers for diagnosis, survival prediction, and classification of CRC.
Keywords: colorectal cancer, competing endogenous RNA network, long noncoding RNA, survival analysis
Introduction
Noncoding RNAs (ncRNAs) are RNAs that lack protein-coding functions.1 On the basis of their characteristics, ncRNAs can be divided into several classes, including lncRNAs, miRNAs, small interfering RNAs, small nuclear RNAs, and ribosomal RNAs.1 miRNAs are a class of small ncRNAs with important regulatory roles, ~22 nt in length.2 They can posttranscriptionally regulate gene expression through binding to miRNA response elements (MREs) on their target transcripts.3,4 A single miRNA can regulate up to hundreds of target genes, and each gene may also be modulated by multiple miRNAs.5,6 Aberrantly expressed miRNAs are associated with many diseases including cancer.7–10
In 2011, Salmena et al presented a competing endogenous RNA (ceRNA) hypothesis, which proposed a new “language” among different types of RNA transcripts.11 The hypothesis postulates that RNA molecules can communicate with each other through shared MREs. MRNAs, lncRNAs, and other RNA transcripts could act as endogenous miRNA sponges to inhibit miRNA function, thereby impact the multiple targets of multiple miRNAs.11 RNA transcripts sharing one or more MREs can actively regulate their respective expression levels by competing for a limited pool of miRNAs. This ceRNA crosstalk forms a large-scale regulatory network across the transcriptome, including protein-coding and noncoding RNAs.11 LncRNAs, a class of ncRNAs >200 nt in length, are suggested to participate in various biological processes (BPs) by regulating gene expression at transcriptional, posttranscriptional, and epigenetic levels.12–14 Recent studies have provided emerging support for the ceRNA activity of lncRNAs involved in the progression of various types of cancer.15–18 LncRNA-associated ceRNA networks have been constructed and analyzed in lung squamous cell carcinoma, papillary renal cell carcinoma, hepatocellular carcinoma, and gastric cancer.19–22 However, there have been few integrated analyses of lncRNA-associated ceRNA networks in colorectal cancer (CRC).
In the present study, we conducted a comprehensive analysis of the mRNA, lncRNA, and miRNA expression profiles in CRC and constructed a CRC-specific lncRNA-associated ceRNA network using a large cohort from The Cancer Genome Atlas (TCGA). To the best of our knowledge, our study is the first to establish an lncRNA-associated ceRNA network in CRC using a combined dataset of colon adenocarcinoma and rectum adenocarcinoma from TCGA. The results are expected to help to further elucidate the lncRNA–miRNA–mRNA crosstalk in CRC and generate insight into the molecular mechanisms involved in the tumorigenesis and progression of CRC.
Patients and methods
Selection of CRC patients
The mRNA, lncRNA, and miRNA expression quantification files and the corresponding clinical information for CRC patients were obtained from TCGA (https://cancergenome.nih.gov/). The inclusion criteria were as follows: 1) patients with complete clinical information including age, gender, pathological stage, TNM stage, survival status, and survival time; 2) patients with complete RNA-Seq data of mRNAs and lncRNAs, and complete miRNA-Seq data; 3) patients with a follow-up survival time of ≤2,000 days. After filtering with the inclusion criteria, a total of 539 CRC patients and 11 normal controls were finally enrolled in the study. The clinicopathological characteristics of the CRC patients are summarized in Table 1.
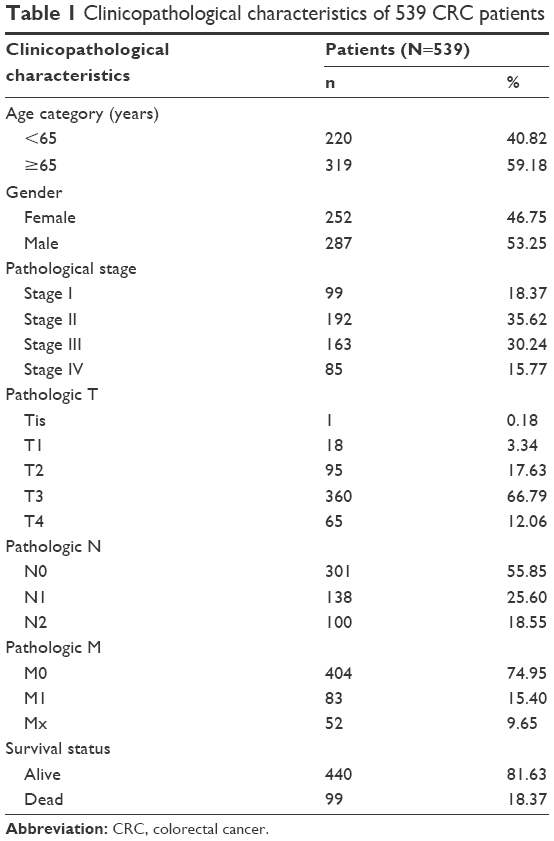 | Table 1 Clinicopathological characteristics of 539 CRC patients |
Expression profile analysis of mRNAs, lncRNAs, and miRNAs in CRC and normal tissues
The differentially expressed mRNAs, lncRNAs, and miRNAs (hereafter referred to as “DEmRNAs”, “DElncRNAs”, and “DEmiRNAs”, respectively) in CRC and normal tissues were screened out individually using the edgeR package in the R language with the threshold of |log2fold change (log2FC)| >2 and false discovery rate (FDR) <0.01.23 Hierarchical clustering analysis was then performed using the pheatmap package in R (Version 1.0.8) to evaluate the specificity of the differentially expressed RNAs.24
Construction of the ceRNA network
The interactions between DElncRNAs and DEmiRNAs were predicted by miRcode.25 The mRNAs targeted by the DEmiRNAs were retrieved according to TargetScan, miRTarBase, and miRDB.26–28 Only mRNAs recognized by all three databases were considered as candidate mRNAs and intersected with the DEmRNAs to screen out the DEmRNAs targeted by the DEmiRNAs. Then, the lncRNA–miRNA–mRNA ceRNA network was constructed based on the DEmiRNA–DElncRNA and DEmiRNA–DEmRNA interactions and visualized using the Cytoscape software.29 A flowchart of the lncRNA–miRNA–mRNA ceRNA network analysis is displayed in Figure 1. Linear regression analysis was performed to evaluate the correlation between ceRNA expression levels.
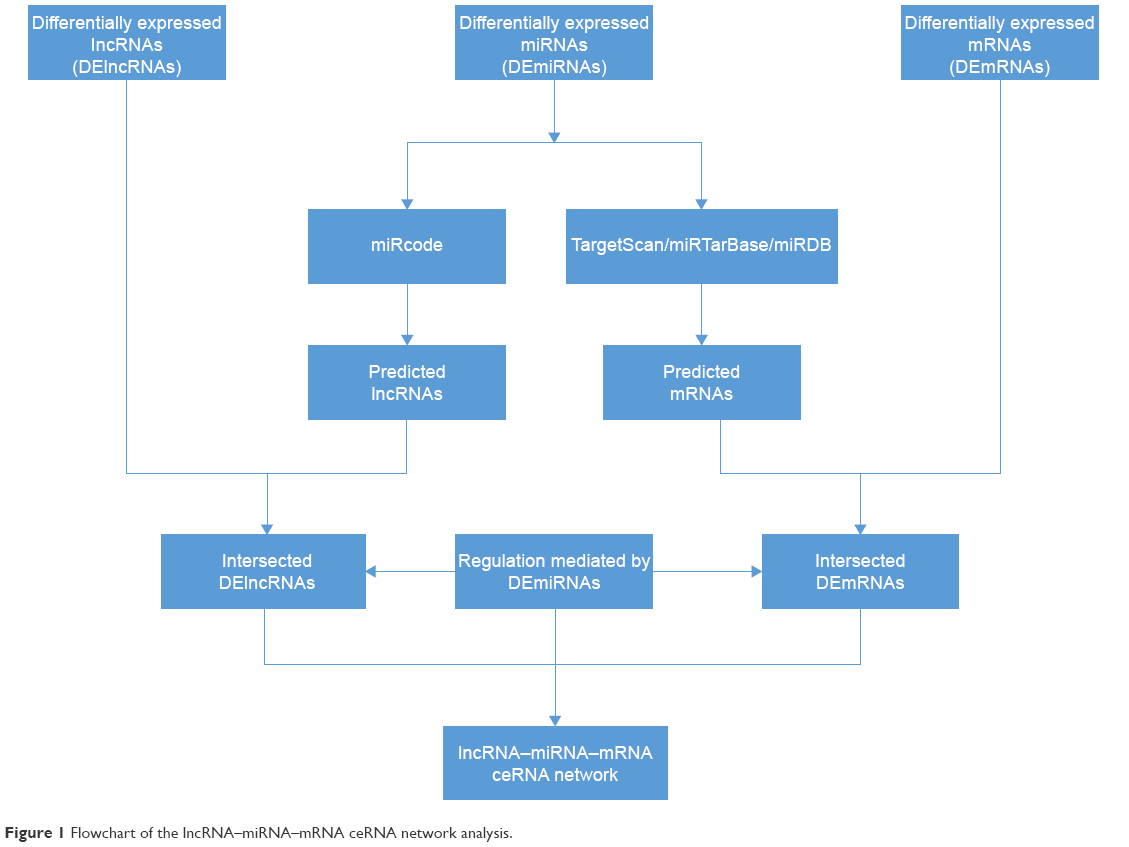 | Figure 1 Flowchart of the lncRNA–miRNA–mRNA ceRNA network analysis. |
Survival analysis
For each of the DEmRNAs, DElncRNAs, and DEmiRNAs in the ceRNA network, the CRC patients were classified into either a high expression group or a low expression group using the median expression value of the specific RNA as the cutoff value. The differences in patients’ survival time between the high expression group and the low expression group were then evaluated by Kaplan–Meier survival curve and log-rank test analysis to find the mRNAs, lncRNAs, and miRNAs that were significantly associated with the survival of CRC patients. P<0.05 was set as the threshold for statistical significance.
The associations between key lncRNAs and clinical features
Based on the bioinformatics analysis and the ceRNA network, key lncRNAs were screened out. The lncRNAs were then analyzed to determine whether they were differentially expressed between different clinical feature categories, including gender (male vs female), T stage (T3 + T4 vs Tis + T1 + T2), N stage (N1 + N2 vs N0), M stage (M1 vs M0), and pathological stage (stage III + IV vs stage I + II). Differentially expressed key lncRNAs with |log2FC|>1 and FDR<0.05 were considered significantly associated with the relevant clinical feature.
Functional enrichment analysis
Functional enrichment analysis was performed for the DEmRNAs in the ceRNA network to reveal the functional implications of these mRNAs in the tumorigenesis of CRC. Gene Ontology (GO) functional enrichment analysis was conducted using the Database for Annotation, Visualization and Integrated Discovery (DAVID, Version 6.8) online tool.30 Kyoto Encyclopedia of Genes and Genomes (KEGG) pathway enrichment analysis was carried out using the KEGG Orthology-Based Annotation System (KOBAS).31 P<0.05 was set as the statistical significance threshold criterion for both GO and KEGG enrichment analysis.
Results
Cancer-specific mRNAs, lncRNAs, and miRNAs in CRC
According to the cutoff threshold, a total of 1,767 DEmRNAs (including 854 upregulated and 913 downregulated) were screened out between CRC tissues and normal tissues. The expressions of 608 DElncRNAs (including 370 upregulated and 238 downregulated) and 283 DEmiRNAs (including 201 upregulated and 82 downregulated) were altered significantly in CRC tissues compared with normal tissues. Unsupervised hierarchical clustering analysis was performed for the top 100 upregulated and top 100 downregulated mRNAs and lncRNAs (owing to the large amount of DEmRNAs and DElncRNAs), respectively, and all the DEmiRNAs. The heatmaps showed that the CRC samples could be clearly distinguished from the normal samples with respect to the expression of these differentially expressed RNAs (Figure 2A–C).
 | Figure 2 Heatmaps based on the differentially expressed RNAs in CRC and normal tissues. |
DElncRNA–DEmiRNA interactions predicted by miRcode
The lncRNAs that are targeted by miRNAs were predicted by miRcode. Only interactions between DElncRNAs and DEmiRNAs were selected for ceRNA network construction. As a result, 479 interactions between 67 DElncRNAs (including KCNQ1OT1, ADAMTS9-AS2, and AGAP11) and 32 DEmiRNAs (including hsa-mir-106a, hsa-mir-141, and hsa-mir-143) were identified for further analysis.
Prediction of DEmRNAs targeted by DEmiRNAs
The 32 DEmiRNAs recognized in the above step were mapped into TargetScan, miRTarBase, and miRDB databases to search for their target mRNAs. A total of 1,416 mRNAs were found to be targeted by these DEmiRNAs in all three databases. These candidate mRNAs were then intersected with the DEmRNAs, and 52 of the 1,416 mRNAs were identified as the DEmRNAs targeted by the DEmiRNAs. Among the 32 candidate DEmiRNAs, only 25 were found to interact with these 52 DEmRNAs, the remaining seven DEmiRNAs without specific DEmRNA targets were excluded from further analysis. To highlight the ceRNA features of the network, only DEmiRNAs interacting with both DEmRNAs and DElncRNAs were introduced into the ceRNA network. Finally, 25 DEmiRNAs, 52 DEmRNAs, and 64 DElncRNAs were selected for ceRNA network construction.
The ceRNA network in CRC
Based on the above data, an lncRNA–miRNA–mRNA ceRNA network consisting of 141 molecules and 450 interactions (382 DEmiRNA–DElncRNA interactions and 68 DEmiRNA–DEmRNA interactions) was constructed. The top 11 DElncRNAs targeted by most DEmiRNAs are shown in Table 2. All the 64 DElncRNAs in the ceRNA network with their name, Ensembl ID, log2FC, and FDR are listed in Table S1. All the 25 DEmiRNAs with their target DEmRNAs in the ceRNA network are shown in Table 3. The network was visualized with Cytoscape and is displayed in Figure 3. According to the ceRNA network, there is a possibility of indirect interactions between DElncRNAs and DEmRNAs. To confirm our finding, linear regression analysis was performed. The results suggested a good positive correlation between ceRNA expression levels (Figures 4A–I and 5A–H). For example, mediated by hsa-mir-106a, LINC00461 interacted with CADM2, CFL2, and FAM129A while mediated by hsa-mir-424, LINC00461 interacted with TMEM100 and TPM2 (Figure 4A, E, D, F, and H). Mediated by hsa-mir-152, LINC00484 interacted with BMP3 and KLF4 while mediated by hsa-mir-141, LINC00484 interacted with PHLPP2 (Figure 5 A, D, and C).
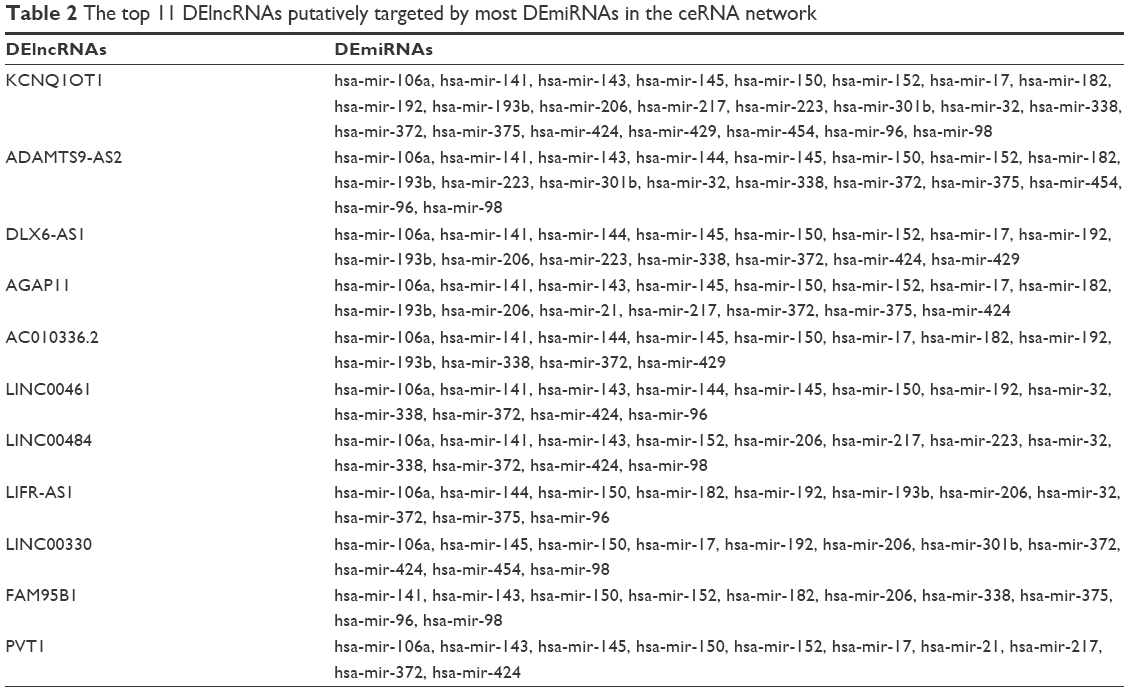 | Table 2 The top 11 DElncRNAs putatively targeted by most DEmiRNAs in the ceRNA network |
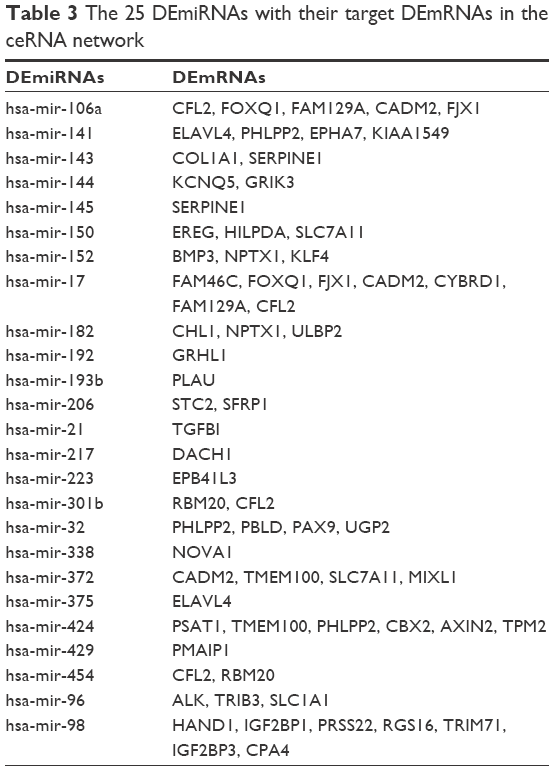 | Table 3 The 25 DEmiRNAs with their target DEmRNAs in the ceRNA network |
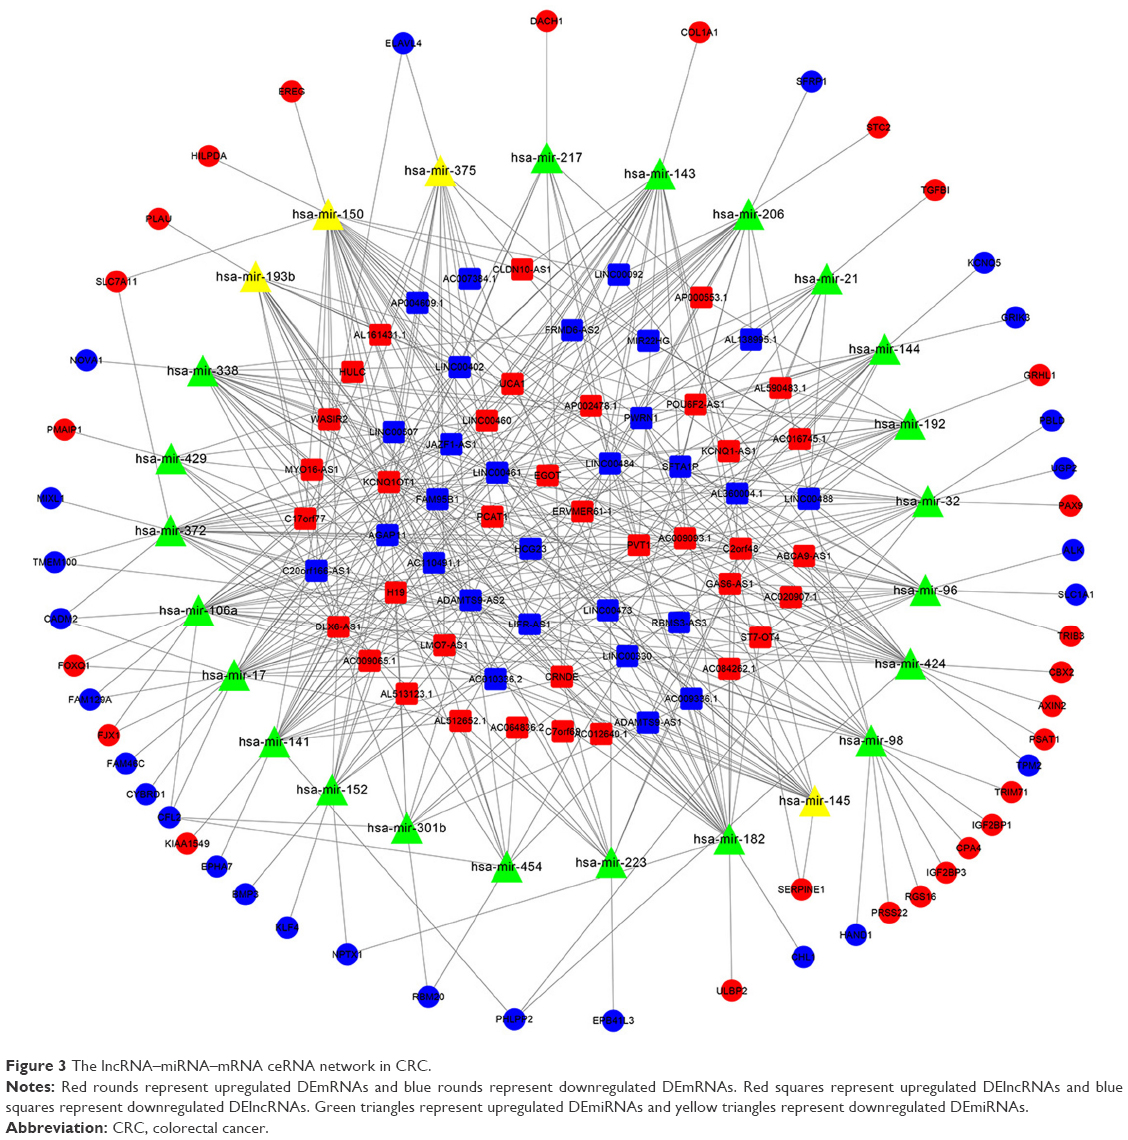 | Figure 3 The lncRNA–miRNA–mRNA ceRNA network in CRC. |
 | Figure 4 Linear regression of ceRNA expression levels for LINC00461. |
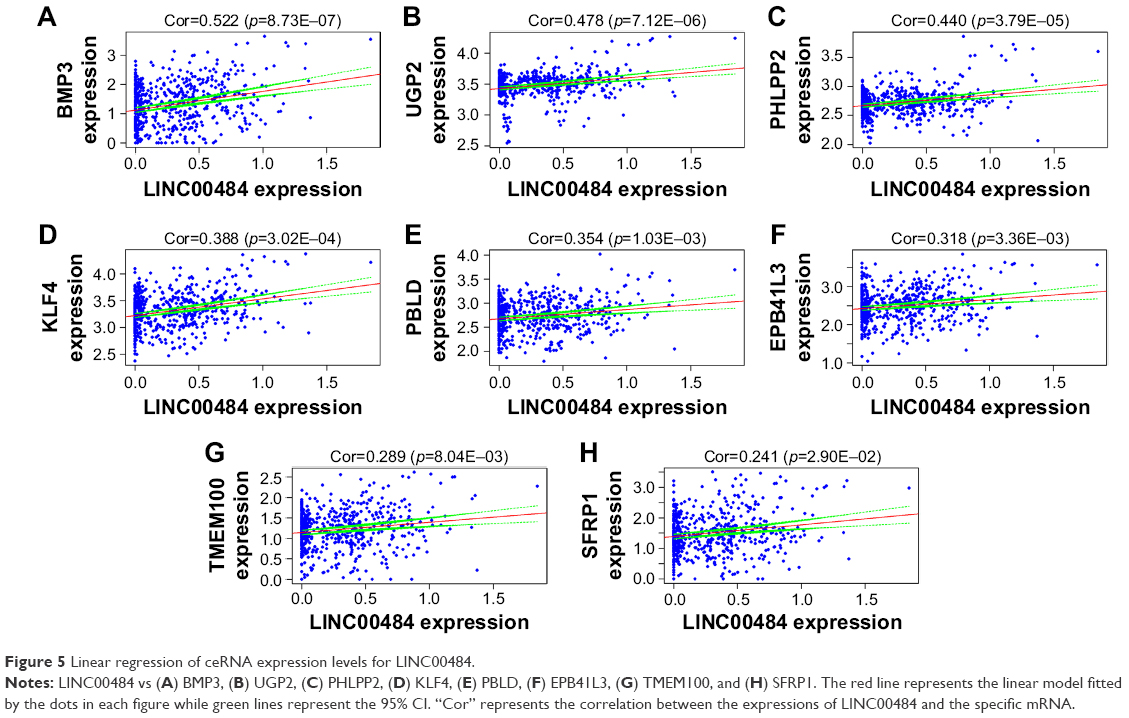 | Figure 5 Linear regression of ceRNA expression levels for LINC00484. |
Important RNAs associated with the prognosis of CRC patients
Kaplan–Meier survival curve and log-rank test analysis were performed for each of the DElncRNAs, DEmiRNAs, and DEmRNAs in the ceRNA network to find the RNAs significantly associated with the survival of CRC patients. According to the results, two DElncRNAs (AP004609.1 and C2orf48), five DEmiRNAs (hsa-mir-96, hsa-mir-144, hsa-mir-145, hsa-mir-193b, and hsa-mir-375), and six DEmRNAs (FAM46C, FJX1, HAND1, SERPINE1, TPM2, and ULBP2) were identified as prognosis-related RNAs (p<0.05, Figures 6A and B, 7A–E, and 8A–F). Among these, hsa-mir-144, and hsa-mir-375 (DEmiRNA) and FAM46C (DEmRNA) appeared to be protective, as patients with higher expression levels of these RNAs tended to have longer overall survival, compared with those with lower expression levels of these RNAs (Figures 7B and E, and 8A). The remaining two DElncRNAs, three DEmiRNAs, and five DEmRNAs were considered risky, as their high expression was associated with shorter overall survival of CRC patients.
 | Figure 6 Kaplan–Meier survival curves for the two DElncRNAs significantly associated with overall survival of CRC patients. |
 | Figure 7 Kaplan–Meier survival curves for the five DEmiRNAs significantly associated with overall survival of CRC patients. |
 | Figure 8 Kaplan–Meier survival curves for the six DEmRNAs significantly associated with overall survival of CRC patients. |
Key lncRNAs relevant to clinical features
The 64 DElncRNAs from the ceRNA network were further analyzed to find their associations with clinical features. The lncRNA expression profiles of CRC patients were compared between different genders, T, N, and M (tumor, node, and metastasis) stages, and pathological stages. Four key DElncRNAs were found to be significantly differentially expressed in clinical feature comparisons. AC110491.1 was significantly altered between genders (male vs female). H19 and HULC were not only differentially expressed in advanced-stage patients (stage III + IV) compared with earlier-stage patients (stage I + II), but also appeared to be associated with N stage (N1 + N2 vs N0) and M stage (M1 vs M0). As well as H19 and HULC, CLDN10-AS1 was also indicated to be an M stage-associated DElncRNA. The key DElncRNAs relevant to clinical features are summarized in Table 4.
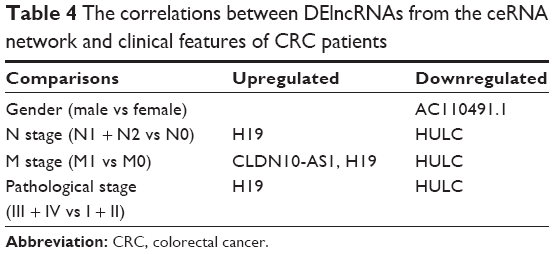 | Table 4 The correlations between DElncRNAs from the ceRNA network and clinical features of CRC patients |
Functional enrichment analysis
Functional enrichment analysis revealed that a total of 28 GO terms, including 20 BP terms, 4 cellular component terms, and 4 molecular function terms were enriched by the DEmRNAs in the ceRNA network. Some of the GO terms were concerned with regulation of transcription, such as GO:0045892~negative regulation of transcription, DNA-templated and GO:0001190~transcriptional activator activity, RNA polymerase II transcription factor binding (Table 5).
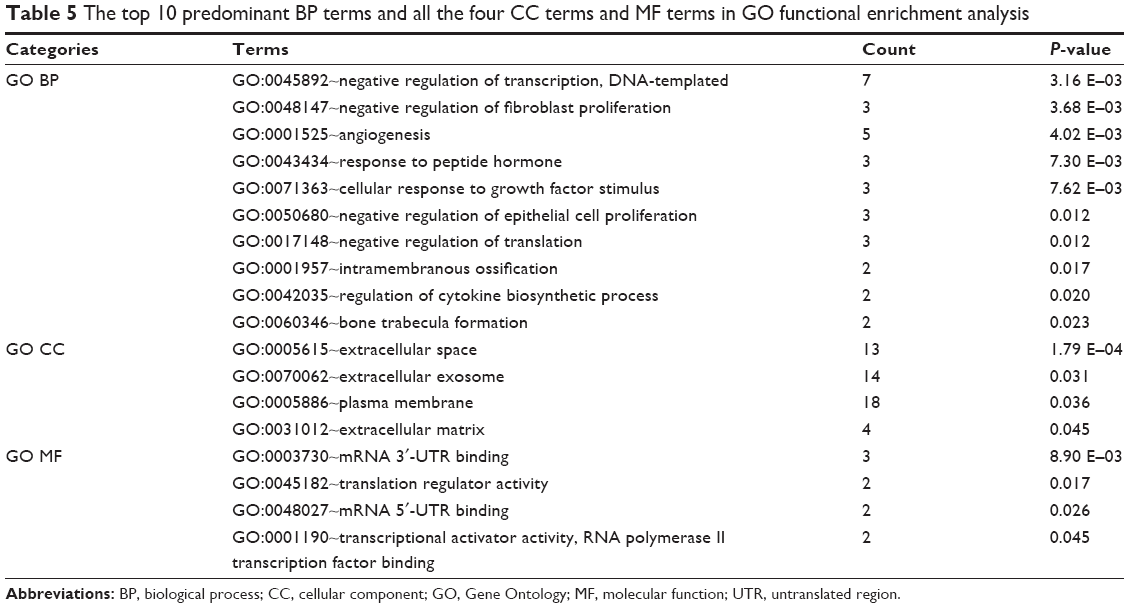 | Table 5 The top 10 predominant BP terms and all the four CC terms and MF terms in GO functional enrichment analysis |
The KEGG pathway enrichment analysis was also performed for the DEmRNAs. Ten KEGG pathways were found to be significantly enriched by the DEmRNAs in the ceRNA network, among which hsa04115: p53 signaling pathway, hsa05206: MicroRNAs in cancer, hsa04310: Wnt signaling pathway, and hsa04390: Hippo signaling pathway were closely associated with the pathogenesis of cancer (Table 6).
 | Table 6 KEGG pathways enriched by the DEmRNAs in the ceRNA network |
Discussion
CRC is one of the most common malignancies worldwide, ranking the third in men and the second in women.32 Despite numerous studies endeavoring to reveal the mechanisms of CRC, the exact pathogenesis has remained to be elucidated. In recent years, a novel hypothesis has been proposed that different RNA transcripts could interact with each other through shared MREs.11 This is called “the ceRNA hypothesis” and presents a new pattern of gene expression regulation that could be used to further understand the mechanisms of various diseases including cancer.
In the present study, we identified DElncRNAs, DEmiRNAs, and DEmRNAs between CRC tissues and normal tissues, using a large cohort from the TCGA database. Then, an lncRNA–miRNA–mRNA ceRNA network was constructed, which provided an integrated view of the ceRNA regulatory crosstalk among these CRC-specific RNA transcripts. The DElncRNAs in the ceRNA network were analyzed for their associations with the survival and clinical features of CRC patients. Functional enrichment analysis further revealed the BPs and pathways associated with the DEmRNAs involved in the development of CRC.
Dysregulated lncRNAs have been observed in various cancers, and some of them have been demonstrated to be associated with patient survival.33–36 For instance, decreased expression of the lncRNA MLLT4 antisense RNA 1 indicates poor prognosis in gastric cancer patients, whereas overexpression of the lncRNA linc-UBC1 is associated with poor prognosis in CRC.34,35 In the present study, two DElncRNAs from the ceRNA network, namely AP004609.1 and C2orf48, were found to be significantly associated with the survival of patients with CRC. Both of them could be considered life threatening, as patients with high expression levels of these two lncRNAs tended to have shorter survival times than patients with low expression. Although little is known about the functions of these two DElncRNAs, our results indicate the prognostic potential of the lncRNAs in survival prediction and provide new directions for further investigation of the two lncRNAs involved in CRC.
With respect to the associations between DElncRNAs and clinical features, we found that four DElncRNAs were related to clinical features, including gender, N stage, M stage, and tumor pathological stage. Among the four DElncRNAs, H19, a widely studied lncRNA, has been suggested as an indicator of tumor progression in multiple types of cancers, including CRC.37–40 H19 has been reported to indicate poor prognosis and promote tumor growth in CRC.39 Overexpression of H19 is associated with decreased overall survival rates in CRC patients, as well as increased viability and migration in colon cancer cells.40 In our study, the expression of H19 was significantly upregulated in advanced tumor stages (stages N1/N2, M1, and stage III/IV) compared with earlier tumor stages (stages N0, M0, and stage I/II). The findings of our study were consistent with previous reports and further confirmed the important function of H19 in the progression of CRC.
MiRNAs, the hub elements of the ceRNA network, exhibited key roles in the crosstalk among different RNA transcripts. Mediated by hsa-mir-424, LINC00461 interacted with TMEM100 and TPM2 while LINC00484 interacted with TMEM100 and PHLPP2 in the present CRC-specific ceRNA network. Mediated by hsa-mir-141, LINC00461 interacted with ELAVL4 while LINC00484 interacted with PHLPP2. Both hsa-mir-424 and hsa-mir-141 were demonstrated to be involved in the pathogenesis of CRC.41,42 We also found five miRNAs to be significantly associated with the prognosis in CRC. High expression of hsa-mir-96, hsa-mir-145, and hsa-mir-193b indicated an unfavorable clinical outcome, while upregulation of hsa-mir-144 and hsa-mir-375 suggested longer survival times of patients with CRC. All the key DEmiRNAs show promising potential as biomarkers for survival prediction in CRC.
MRNAs comprise another important part of the ceRNA network, through being directly targeted by miRNAs or having indirect interactions with lncRNAs mediated by miRNAs. Similar to lncRNAs and miRNAs, some mRNAs were also found to be associated with the survival of CRC patients, such as the protective mRNA FAM46C, and the risky mRNAs including FJX1, HAND1, SERPINE1, TPM2, and ULBP2. Furthermore, functional enrichment analysis revealed that DEmRNAs were enriched in some BPs and pathways related to transcription regulation and cancer, such as negative regulation of transcription, the p53 signaling pathway, and the Wnt signaling pathway.43,44 The close correlation between the enriched pathways and the ceRNA network demonstrates the credibility of our results.
Conclusion
The present study identified CRC-specific lncRNAs, miRNAs, and mRNAs using a large cohort from the TCGA database. We successfully constructed an lncRNA-associated ceRNA network, which provided insight into the newly proposed crosstalk among different types of RNA transcripts. Key lncRNAs were analyzed to determine significant associations with overall survival and clinical features of CRC patients. Hub miRNAs also showed promising potential as prognostic biomarkers in CRC. Our study provides better understanding of the ceRNA regulatory mechanism and helps to elucidate the pathogenesis involved in the tumorigenesis and progression of CRC.
Disclosure
The authors report no conflicts of interest in this work.
References
Song E, editor. Advances in experimental medicine and biology. The Long and Short Non-Coding RNAs in Cancer Biology. Singapore: Springer; 2016. | ||
Bartel DP. MicroRNAs: genomics, biogenesis, mechanism, and function. Cell. 2004;116(2):281–297. | ||
Bartel DP. MicroRNAs: target recognition and regulatory functions. Cell. 2009;136(2):215–233. | ||
Cai Y, Yu X, Hu S, Yu J. A brief review on the mechanisms of miRNA regulation. Genomics Proteomics Bioinformatics. 2009;7(4):147–154. | ||
Thomas M, Lieberman J, Lal A. Desperately seeking microRNA targets. Nat Struct Mol Biol. 2010;17(10):1169–1174. | ||
Wu S, Huang S, Ding J, et al. Multiple microRNAs modulate p21Cip1/Waf1 expression by directly targeting its 3′ untranslated region. Oncogene. 2010;29(15):2302–2308. | ||
Singh A, Sen D. MicroRNAs in Parkinson’s disease. Exp Brain Res. 2017;235(8):2359–2374. | ||
Banerjee J, Nema V, Dhas Y, Mishra N. Role of MicroRNAs in type 2 diabetes and associated vascular complications. Biochimie. 2017;139:9–19. | ||
Barwari T, Joshi A, Mayr M. MicroRNAs in cardiovascular disease. J Am Coll Cardiol. 2016;68(23):2577–2584. | ||
Abba ML, Patil N, Leupold JH, et al. MicroRNAs as novel targets and tools in cancer therapy. Cancer Lett. 2017;387:84–94. | ||
Salmena L, Poliseno L, Tay Y, Kats L, Pandolfi PP. A ceRNA hypothesis: the Rosetta Stone of a hidden RNA language? Cell. 2011;146(3):353–358. | ||
Kornienko AE, Guenzl PM, Barlow DP, Pauler FM. Gene regulation by the act of long non-coding RNA transcription. BMC Biol. 2013;11:59. | ||
Shi X, Sun M, Liu H, Yao Y, Song Y. Long non-coding RNAs: a new frontier in the study of human diseases. Cancer Lett. 2013;339(2):159–166. | ||
Mercer TR, Mattick JS. Structure and function of long noncoding RNAs in epigenetic regulation. Nat Struct Mol Biol. 2013;20(3):300–307. | ||
Chen D, Sun Q, Zhang L, et al. The lncRNA HOXA11-AS functions as a competing endogenous RNA to regulate PADI2 expression by sponging miR-125a-5p in liver metastasis of colorectal cancer. Oncotarget. 2017;8(41):70642–70652. | ||
Lv M, Zhong Z, Huang M, Tian Q, Jiang R, Chen J. lncRNA H19 regulates epithelial-mesenchymal transition and metastasis of bladder cancer by miR-29b-3p as competing endogenous RNA. Biochim Biophys Acta. 2017;1864(10):1887–1899. | ||
Chen Z, Liu H, Yang H, Gao Y, Zhang G, Hu J. The long noncoding RNA, TINCR, functions as a competing endogenous RNA to regulate PDK1 expression by sponging miR-375 in gastric cancer. Onco Targets Ther. 2017;10:3353–3362. | ||
Cui M, Wang J, Li Q, Zhang J, Jia J, Zhan X. Long non-coding RNA HOXA11-AS functions as a competing endogenous RNA to regulate ROCK1 expression by sponging miR-124-3p in osteosarcoma. Biomed Pharmacother. 2017;92:437–444. | ||
Sui J, Xu SY, Han J, et al. Integrated analysis of competing endogenous RNA network revealing lncRNAs as potential prognostic biomarkers in human lung squamous cell carcinoma. Oncotarget. 2017;8(39):65997–66018. | ||
Huang C, Yuan N, Wu L, et al. An integrated analysis for long noncoding RNAs and microRNAs with the mediated competing endogenous RNA network in papillary renal cell carcinoma. Onco Targets Ther. 2017;10:4037–4050. | ||
Zhang J, Fan D, Jian Z, Chen GG, Lai PB. Cancer specific long noncoding RNAs show differential expression patterns and competing endogenous RNA potential in hepatocellular carcinoma. PLoS One. 2015;10(10):e0141042. | ||
Xia T, Liao Q, Jiang X, et al. Long noncoding RNA associated-competing endogenous RNAs in gastric cancer. Sci Rep. 2014;4:6088. | ||
Robinson MD, McCarthy DJ, Smyth GK. edgeR: a Bioconductor package for differential expression analysis of digital gene expression data. Bioinformatics. 2010;26(1):139–140. | ||
Kolde R [webpage on the Internet]. Pheatmap: Pretty heatmaps. R package version 1.0.8: 2015. Available from: https://cran.r-project.org/web/packages/pheatmap/index.html. Accessed May 14, 2016. | ||
Jeggari A, Marks DS, Larsson E. miRcode: a map of putative microRNA target sites in the long non-coding transcriptome. Bioinformatics. 2012;28(15):2062–2063. | ||
Agarwal V, Bell GW, Nam JW, Bartel DP. Predicting effective microRNA target sites in mammalian mRNAs. eLife. 2015;4:e05005. | ||
Chou CH, Chang NW, Shrestha S, et al. miRTarBase 2016: updates to the experimentally validated miRNA-target interactions database. Nucleic Acids Res. 2016;44(D1):D239–D247. | ||
Wong N, Wang X. miRDB: an online resource for microRNA target prediction and functional annotations. Nucleic Acids Res. 2015;43(Database issue):D146–D152. | ||
Shannon P, Markiel A, Ozier O, et al. Cytoscape: a software environment for integrated models of biomolecular interaction networks. Genome Res. 2003;13(11):2498–2504. | ||
Dennis G Jr, Sherman BT, Hosack DA, et al. DAVID: database for annotation, visualization, and integrated discovery. Genome Biol. 2003;4(5):3. | ||
Wu J, Mao X, Cai T, Luo J, Wei L. KOBAS server: a web-based platform for automated annotation and pathway identification. Nucleic Acids Res. 2006;34(Web Server issue):W720–W724. | ||
Ferlay J, Soerjomataram I, Dikshit R, et al. Cancer incidence and mortality worldwide: sources, methods and major patterns in GLOBOCAN 2012. Int J Cancer. 2015;136(5):E359–E386. | ||
Sun Y, Zhou Y, Bai Y, et al. A long non-coding RNA HOTTIP expression is associated with disease progression and predicts outcome in small cell lung cancer patients. Mol Cancer. 2017;16(1):162. | ||
Lai Y, Xu P, Liu J, et al. Decreased expression of the long non-coding RNA MLLT4 antisense RNA 1 is a potential biomarker and an indicator of a poor prognosis for gastric cancer. Oncol Lett. 2017;14(3):2629–2634. | ||
Gao X, Wen J, Gao P, Zhang G, Zhang G. Overexpression of the long non-coding RNA, linc-UBC1, is associated with poor prognosis and facilitates cell proliferation, migration, and invasion in colorectal cancer. Onco Targets Ther. 2017;10:1017–1026. | ||
Zhang JH, Li AY, Wei N. Downregulation of long non-coding RNA LINC01133 is predictive of poor prognosis in colorectal cancer patients. Eur Rev Med Pharmacol Sci. 2017;21(9):2103–2107. | ||
Liu N, Zhou Q, Qi YH, Wang H, Yang L, Fan QY. Effects of long non-coding RNA H19 and microRNA let7a expression on thyroid cancer prognosis. Exp Mol Pathol. 2017;103(1):71–77. | ||
Chen JS, Wang YF, Zhang XQ, et al. H19 serves as a diagnostic biomarker and up-regulation of H19 expression contributes to poor prognosis in patients with gastric cancer. Neoplasma. 2016;63(2):223–230. | ||
Han D, Gao X, Wang M, et al. Long noncoding RNA H19 indicates a poor prognosis of colorectal cancer and promotes tumor growth by recruiting and binding to eIF4A3. Oncotarget. 2016;7(16):22159–22173. | ||
Chen SW, Zhu J, Ma J, et al. Overexpression of long non-coding RNA H19 is associated with unfavorable prognosis in patients with colorectal cancer and increased proliferation and migration in colon cancer cells. Oncol Lett. 2017;14(2):2446–2452. | ||
Torres S, Garcia-Palmero I, Bartolomé RA, et al. Combined miRNA profiling and proteomics demonstrates that different miRNAs target a common set of proteins to promote colorectal cancer metastasis. J Pathol. 2017;242(1):39–51. | ||
Wu PP, Zhu HY, Sun XF, Chen LX, Zhou Q, Chen J. MicroRNA-141 regulates the tumour suppressor DLC1 in colorectal cancer. Neoplasma. 2015;62(5):705–712. | ||
Stegh AH. Targeting the p53 signaling pathway in cancer therapy – the promises, challenges and perils. Expert Opin Ther Targets. 2012;16(1):67–83. | ||
Duchartre Y, Kim YM, Kahn M. The Wnt signaling pathway in cancer. Crit Rev Oncol Hematol. 2016;99:141–149. |
Supplementary material
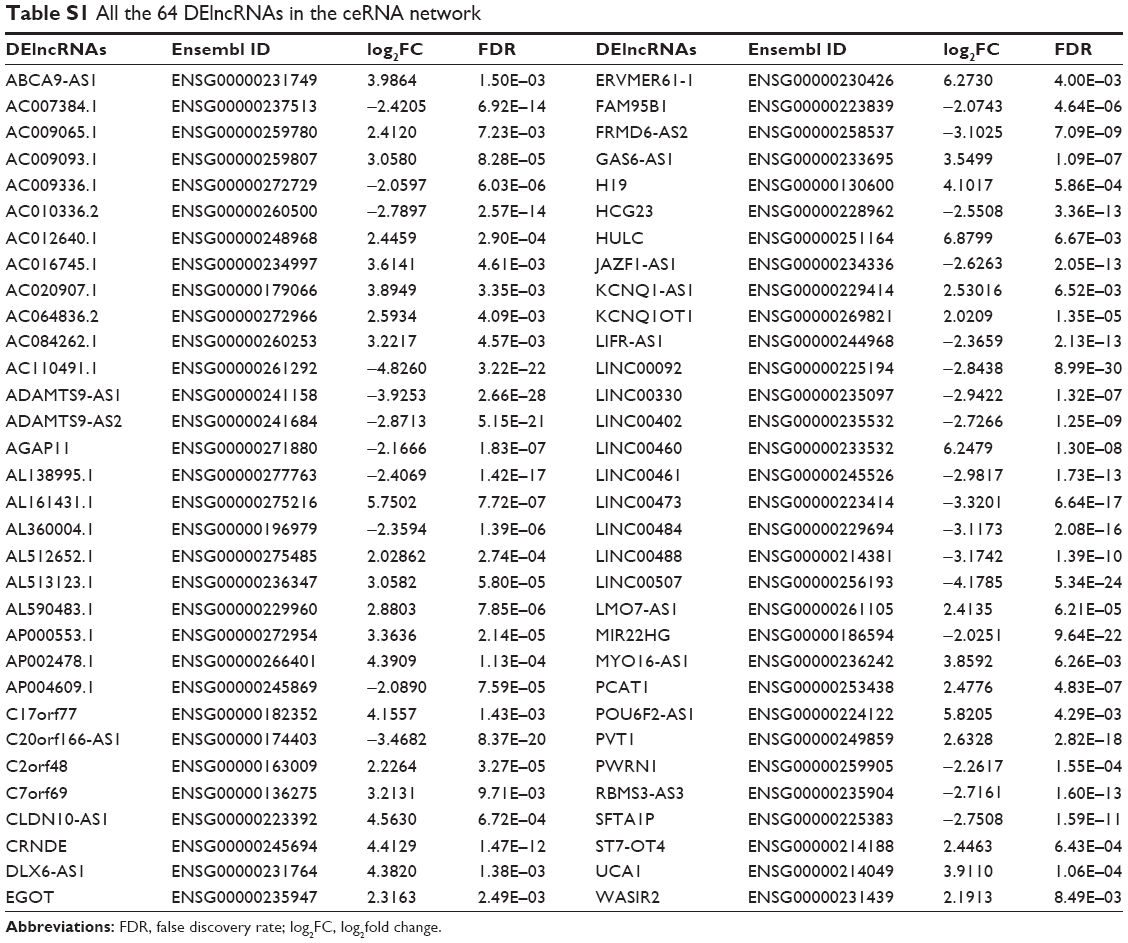 | Table S1 All the 64 DElncRNAs in the ceRNA network |
 © 2018 The Author(s). This work is published and licensed by Dove Medical Press Limited. The
full terms of this license are available at https://www.dovepress.com/terms
and incorporate the Creative Commons Attribution
- Non Commercial (unported, 3.0) License.
By accessing the work you hereby accept the Terms. Non-commercial uses of the work are permitted
without any further permission from Dove Medical Press Limited, provided the work is properly
attributed. For permission for commercial use of this work, please see paragraphs 4.2 and 5 of our Terms.
© 2018 The Author(s). This work is published and licensed by Dove Medical Press Limited. The
full terms of this license are available at https://www.dovepress.com/terms
and incorporate the Creative Commons Attribution
- Non Commercial (unported, 3.0) License.
By accessing the work you hereby accept the Terms. Non-commercial uses of the work are permitted
without any further permission from Dove Medical Press Limited, provided the work is properly
attributed. For permission for commercial use of this work, please see paragraphs 4.2 and 5 of our Terms.