Back to Journals » International Journal of General Medicine » Volume 14
Comprehensive Analysis and Identification of an Immune-Related Gene Signature with Prognostic Value for Prostate Cancer
Received 22 May 2021
Accepted for publication 14 June 2021
Published 28 June 2021 Volume 2021:14 Pages 2931—2942
DOI https://doi.org/10.2147/IJGM.S321319
Checked for plagiarism Yes
Review by Single anonymous peer review
Peer reviewer comments 2
Editor who approved publication: Dr Scott Fraser
Yongrui Zhang, Yaowen Fu
Department of Urology, The First Hospital of Jilin University, Changchun, 130021, Jilin, People’s Republic of China
Correspondence: Yaowen Fu
Department of Urology, The First Hospital of Jilin University, Changchun, 130021, Jilin, People’s Republic of China
Tel +8613756661667
Email [email protected]
Background: The tumor microenvironment (TME) has recently been proven to play a crucial role in the development and prognosis of tumors. However, the current knowledge on the potential of the TME in prostate cancer (PCa) remains scarce.
Purpose: This study aims to elucidate the value of TME-related genes for PCa prognosis by integrative bioinformatics analysis.
Materials and Methods: We downloaded the immune and stromal scores of PCa samples via the ESTIMATE and correlated these scores to clinicopathological characteristics and recurrence-free survival (RFS) of patients. Based on these scores, the TME-related differentially expressed genes were identified for functional enrichment analysis. Cox regression analyses were performed to identify prognostic genes and establish a predictive risk model. Moreover, gene set enrichment analysis (GSEA) was performed to evaluate the relationship between risk score and immune pathway.
Results: The stromal and immune scores were associated with clinicopathological characteristics and RFS in PCa patients. In total, 238 intersecting differentially expressed genes were identified. Functional enrichment analysis further revealed that these genes dramatically participated in the immune-related pathways. The immune-related risk model was built with C-type lectin domain containing 7A (CLEC7A) and collagen type XI alpha 1 chain (COL11A1) using Cox regression analyses. Kaplan–Meier survival analysis showed that the expression levels of CLEC7A and COL11A1 were significantly associated with the RFS. Further, the RFS time in high-risk group was significantly shorter than that in low-risk group. The areas under the curve for the risk model in predicting 3- and 5-year RFS rates were 0.694 and 0.731, respectively. GSEA suggested that immunosuppression existed in high-risk PCa patients.
Conclusion: CLEC7A and COL11A1 were selected to build a predictive risk model, which may help clinicians to assess the prognosis of PCa patients and select appropriate targets for immunotherapy.
Keywords: prostate cancer, tumor microenvironment, immune score, stromal score, recurrence-free survival, prognosis
Introduction
Prostate cancer (PCa) is the second most frequent malignancy and the fifth leading cause of cancer death in men, with almost 1.4 million new cases and 375,304 deaths annually worldwide in 2020.1 With the popularization of prostate-specific antigen screening, the rate of detection and diagnosis of PCa has substantially increased in the past 20 years. According to the clinical tumor stage, serum prostate-specific antigen level, and Gleason score, the risk stratification of PCa is classified as low-, intermediate-, and high-risk categories, which can be used to guide treatment and determine prognosis.2–4 Current treatments for PCa include conservative treatment, surgery, endocrine therapy, radiotherapy, and chemotherapy.5 Despite improvements in clinical treatment strategies, the prognosis for PCa remains very poor. Approximately 25% of the patients with PCa suffer from biochemical recurrence within 5 years after radical prostatectomy.6 Moreover, up to one-third of patients with localized tumors eventually fail on local treatment and progress to advanced or metastatic PCa within 10 years.7 At present, there are few methods to evaluate and predict the prognosis of PCa. Therefore, the primary focus of the research strategy is on the urgent need to determine a non-invasive and effective method for predicting the prognosis of such patients.
Previous research has shown that T cells are the dominant lymphocytes in the normal prostate gland, whose function and CD4/CD8 location distribution are strictly regulated, and no significant difference is found in the immunosurveillance level of the prostate according to patient race, age, and anatomic zone.8 The infiltration of cytotoxic lymphocytes into the tumor microenvironment (TME) plays an important role in anti-tumor immunity. However, genome-wide studies have disclosed that PCa undergoes molecular alterations in cells of the TME throughout disease onset and progression.9,10 Expression of negative regulatory molecules on the surface of tumor-infiltrating lymphocytes contributes to ineffective immune responses and the immunosuppressed phenotype. Thus, it is still necessary to define molecular regulators of the PCa microenvironment for facilitating the development of personalized targeted therapies.
The TME is a complex mixture that is composed of infiltrating immune cells, cancer-associated fibroblasts (CAFs), endothelial cells, and signaling molecules and extracellular matrix proteins.11 Thereinto, CAFs are a key component of the TME with diverse functions, including crosstalk with infiltrating leukocytes, and matrix deposition and remodelling. Research has shown that CAFs are more genetically stable and less likely to acquire therapy resistance than tumor cells.12 For this reason, precision strategies have been developed and are in progress to target CAFs.13–15
To evaluate the infiltration degree of stromal and immune cells, ESTIMATE algorithm has been developed to calculate tumor purity for giving an overall view of TME.16 Using this algorithm, stromal and immune scores of solid tumors can be generated based on single sample gene set enrichment analysis (GSEA). Several studies have shown that immune and stromal scores can predict the prognosis of a variety of cancers, including lung adenocarcinoma,17 clear cell renal cell carcinoma,18 and bladder cancer.19 However, Zhao et al20 found that the immune and stromal scores were not significantly associated with overall survival of PCa patients.
In this study, we downloaded the immune and stromal scores of PCa samples from The Cancer Genome Atlas (TCGA) database from the online tool ESTIMATE and correlated these scores to clinicopathological characteristics and recurrence-free survival (RFS) of PCa patients. Based on these scores, the TME-related differentially expressed genes (DEGs) were identified and selected to perform functional enrichment analysis. Then Cox regression analyses were performed to identify TME-related prognostic genes and establish a predictive risk model. Moreover, we also evaluated the relationship between risk score and immune pathway.
Materials and Methods
Data Collection and Analysis
TCGA level 3 gene expression data of PCa samples were downloaded from the Genomic Data Commons (https://portal.gdc.cancer.gov/). The clinical data was extracted from the UCSC Xena project (https://xena.ucsc.edu). The inclusion criteria were as follows: (i) prostate adenocarcinoma diagnosed by pathologic histology, (ii) available survival information, and (iii) available expression data. The immune and stromal scores of PCa samples were downloaded from the online tool ESTIMATE (https://bioinformatics.mdanderson.org/estimate/). Subsequently, the best cutoff values were generated using X-tile plots21 and used to divide the PCa samples into high and low score groups. The Log rank test was used to identify the relationship between immune/stromal scores and RFS of patients. A p-value of less than 0.05 was considered to indicate statistical significance. The survival curves were visualized using GraphPad Prism 8 (GraphPad Software Inc., United States). Estimate the Proportion of Immune and Cancer cells (EPIC) database was employed to assess the difference in immune cell infiltration between high and low score groups.
Identification of Differentially Expressed Genes
Differential expression analysis was performed using the R v 3.6.1 software with “limma” package. Genes with a fold-change greater than 2 and a false discovery rate (FDR) below 0.05 were considered significantly differentially expressed. Volcano plots of DEGs were generated using the R software with “ggplot2” package. Furthermore, a list of immune-related genes was downloaded from the Immunology Database and Analysis Portal (ImmPort, https://www.immport.org/). The online Venn diagram tool (https://bioinfogp.cnb.csic.es/tools/venny/) was used to identify the intersection of genes among immune DEGs, stromal DEGs, and immune-related genes. These intersecting genes were selected for further analysis.
Enrichment Analysis of Intersecting Genes
Enrichment analyses of Gene Ontology (GO) and Kyoto Encyclopedia of Genes and Genomes (KEGG) for intersecting genes were performed using the R software with “clusterProfiler” package. A p-value <0.05 was considered statistically significant.
Establishment of a Predictive Risk Model
Further, we established a predictive risk model and identified the TME-related gene signature for predicting the prognosis of PCa patients. Firstly, using the “survival” R package, we evaluated the associations between the expression of selected genes and RFS of patients by univariate Cox regression analysis. The significant genes with P < 0.05 were identified for further analysis. Least Absolute Shrinkage and Selector Operation (LASSO) analysis can not only reduce the estimation variance but also provide an explicable final model.22 Then, we performed the LASSO analysis to identify the independent prognostic genes. Finally, we established a predictive risk model using multivariate Cox regression analysis. The risk score of each patient was generated using the following formula:

In the formula above, “Exp” represents the expression level of gene and “β” is the regression coefficient resulted from the multivariate Cox regression analysis.
Assessment of the Risk Model and Survival Analysis
Next, a time-dependent receiver operating characteristic (ROC) curve with the area under the curve (AUC) values was visualized to evaluate the sensitivity and specificity of the model using the “timeROC” package. Kaplan–Meier survival analyses were performed to explore the associations of risk score and independent prognostic genes with RFS of patients. Survival curves were compared with the use of the Log rank test with a two-sided significance level of 5%.
Relationship Between Risk Score and Immune Pathway
GSEA was performed to evaluate the relationship between risk score and immune pathway using the GSEA software (version 4.0.3).23 The number of permutation was set at 1000. The significant level of the gene sets was set at the absolute normalized enrichment score (NES) >1 and nominal p-value <0.05.
Results
Immune and Stromal Scores Correlate with Clinicopathological Characteristics and Prognosis of PCa Patients
According to the included criteria, 485 patients with PCa were selected in this study. The immune and stromal scores of these corresponding samples were downloaded from the online tool ESTIMATE. Thereinto, immune score represents the infiltration of immune cells in tumor tissue, and stromal score captures the presence of stroma in tumor tissue. They are calculated using the ESTIMATE algorithm based on the expression matrix of each sample. Statistical analyses were performed with the use of GraphPad Prism 8 and revealed that high immune scores correlated with later T stages (P = 0.007) and lymphatic metastasis (P = 0.043), while there was no significant relationship between immune scores and age (P = 0.055) and Gleason scores (P = 0.176) (Figure 1A–D). However, high stromal scores correlated with an upper age (P = 0.023), later T stages (P = 4.72e-05), and higher Gleason scores (P = 0.002), while there was no significant relationship between stromal scores and M stage (P = 0.567) (Figure 1E–H).
 |
Figure 1 Associations of immune and stromal scores with prostate cancer clinicopathological characteristics. (A–D) Distributions of immune scores among different ages, tumor stages, lymphatic metastases, and Gleason scores. (E–H) Distributions of stromal scores among different ages, tumor stages, lymphatic metastases, and Gleason scores. |
To explore whether the immune and stromal scores can predict the prognosis of PCa patients, we evaluated the relationship of these scores and RFS. Based on the best cutoff value, PCa patients were divided into two groups: high score group and low score group. Specifically, 169 patients with higher immune scores and 316 patients with lower immune scores were separated by the best cutoff value of −578.3. Similarly, 298 patients with higher stromal scores and 187 patients with lower stromal scores were separated by the best cutoff value of −820.1. Kaplan–Meier survival analyses revealed that the high immune and stromal scores were strongly associated with poor RFS of patients (P = 0.003) (Figure 2A and B).
 |
Figure 2 Kaplan–Meier survival curves of PCa patients and relative proportions of tumor-infiltrating cells. (A and B) Kaplan–Meier curves of RFS for patients with low vs high immune and stromal scores. (C and D) Relative proportions of tumor-infiltrating cells in the low vs high immune and stromal score groups. *P < 0.05, ***P < 0.001, ****P < 0.0001. Abbreviations: PCa, prostate cancer; RFS, recurrence-free survival; ns, no significance. |
To further elucidate the reasons for the poor RFS of patients with higher scores, we evaluated the proportions of infiltrating immune cells in the TME of each sample using the EPIC database.24 Consequently, the proportions of B cells, CAFs, CD4+ T cells, endothelial cells, and macrophages were dramatically higher in the high immune score group than that in the low immune score group (P < 0.001), while the proportions of CD8+ T cells were dramatically lower (P < 0.001) (Figure 2C). Likewise, the proportions of B cells, CAFs, CD4+ T cells, endothelial cells, and macrophages were dramatically higher in the high stromal score group than those in the low stromal score group (P < 0.05) (Figure 2D). These results indicated that the increase of suppressive immune cells and the decrease of killer immune cells might contribute to the poor RFS of patients with PCa.
Identification of Differentially Expressed Genes
To identify the TME-related DEGs, we downloaded level 3 RNA sequencing data of 485 PCa samples from the TCGA database. Using the R software with “limma” package, we identified 994 immune DEGs and 1470 stromal DEGs, respectively. The volcano plots in Figure 3A showed that 878 genes were upregulated and 116 genes were downregulated in the high immune score group compared with the low score groups (fold change >2, FDR < 0.05). In the comparison based on stromal scores, 1361 genes were upregulated and 109 genes were downregulated in the high score group (fold change >2, FDR < 0.05) (Figure 3B). Subsequently, we identified 238 intersecting genes among immune DEGs, stromal DEGs, and immune-related genes obtained from the ImmPort database (Figure 3C). The 238 intersecting genes showed in the Venn diagrams were selected for further analysis.
 |
Figure 3 Identification of differentially expressed genes. (A) Volcano plot of DEGs based on immune score in PCa samples. (B) Volcano plot of DEGs based on stromal score in PCa samples. (C) Venn diagrams showing the overlapping genes among immune DEGs, stromal DEGs, and immune-related genes. Abbreviations: PCa, prostate cancer; DEGs, differentially expressed genes. |
Functional Enrichment Analyses of Intersecting Genes
Next, we performed enrichment analyses to excavate the functional properties of the 238 differential TME-related genes. GO and KEGG terms were determined using the “clusterProfiler” package (P < 0.05). The results showed the top 10 GO terms (Figure 4A) and the top 10 KEGG pathway terms (Figure 4B). Go enrichment analysis showed that these TME-related genes were mainly involved in immune responses, especially immune cell activation and proliferation. Moreover, KEGG analysis revealed that these TME-related genes were obviously involved in immune-related pathways, such as cytokine–cytokine receptor interaction and chemokine signaling pathways.
 |
Figure 4 Enrichment analysis of microenvironment-related differentially expressed genes. (A) The top 10 of biological processes GO terms. (B) The top 10 enriched KEGG pathways. Abbreviations: GO, Gene Ontology; KEGG, Kyoto Encyclopedia of Genes and Genomes. |
Identification of a Prognostic Gene Signature and Survival Analysis
To further identify a prognostic gene signature associated with TME, we firstly performed the univariate Cox regression analysis. The result revealed that 94 differential TME-related genes were significantly associated with RFS of PCa patients (P < 0.05) (Supplementary Table 1). The selected 94 significant genes were subsequently utilized for the multiple LASSO regression analysis (Figure 5A). As shown in Figure 5B, we obtained two key genes, namely, C-type lectin domain containing 7A (CLEC7A) and collagen type XI alpha 1 chain (COL11A1). Table 1 listed the representative GO and KEGG categories in which CLEC7A and COL11A1 were involved. Moreover, Kaplan–Meier analysis revealed that the high expression levels of CLEC7A (P = 2.64e-05) and COL11A1 (P = 1.53e-05) were negatively correlated with RFS (Figure 5C and D), indicating that PCa patients with strong CLEC7A or COL11A1 expression have a higher risk for disease recurrence.
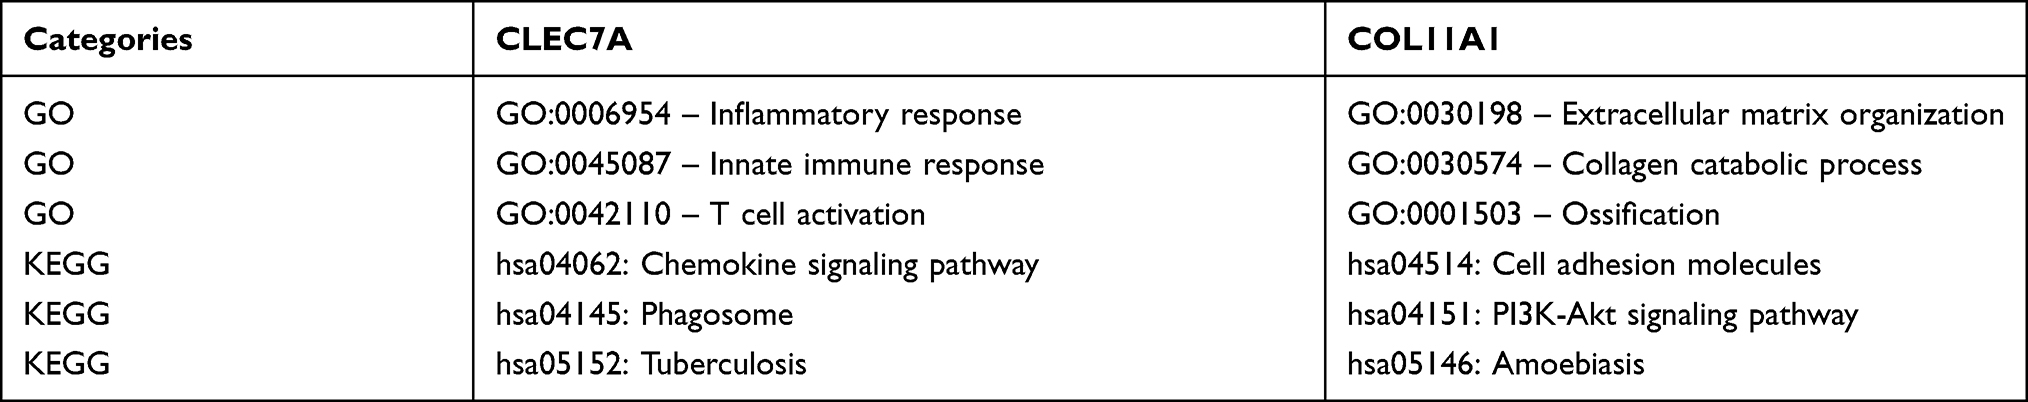 |
Table 1 Representative GO and KEGG Categories in Which CLEC7A and COL11A1 Were Involved |
 |
Figure 5 Identification of a prognostic gene signature and survival analysis. (A) LASSO coefficient profiles of the 45 significant genes from the result of the univariate regression. (B) Feature selection for prognostic biomarkers using the LASSO method. (C) Kaplan–Meier curves of RFS for patients grouped by expression levels of CLEC7A. (D) Kaplan–Meier curves of RFS for patients grouped by expression levels of COL11A1. Abbreviations: LASSO, Least Absolute Shrinkage and Selector Operation; RFS, recurrence-free survival; CLEC7A, C-type lectin domain containing 7A; COL11A1, collagen type XI alpha 1 chain. |
Establishment and Assessment of the Predictive Risk Model
The predictive risk model was built with the two key genes. Based on the regression coefficients, the risk scores were generated according to the following formula: (0.415 * CLEC7A expression level) + (0.173 * COL11A1 expression level) (Supplementary Table 2). The score of 1.3 was used as the best cutoff to divide patients into high-risk group (n = 171) and low-risk group (n = 314) (Figure 6A). Compared with the low-risk group, the number of PCa recurrence was higher in the high-risk group (Figure 6B). Moreover, a high-risk score was significantly associated with lower RFS (P = 5.47e-09) (Figure 6C), indicating that the risk score could serve as a good predictive tool. The ROC curve analysis showed that the AUC of the predictive risk model for RFS was 0.694 and 0.731 for the third and fifth years, respectively, indicating that the risk model had medium performance (Figure 6D).
 |
Figure 6 Establishment and assessment of the predictive risk model. (A) Distributions of risk score. (B) The RFS time of patients in high- and low-risk groups. (C) Kaplan–Meier curves of RFS for patients with low vs high risk scores. (D) ROC curves of the risk model for predicting 3- and 5-year survival rates. Abbreviations: RFS, recurrence-free survival; R, recurrence; RF, recurrence-free; ROC, receiver operating characteristic. |
The Risk Score Predicts the Involvement of Immune Pathways
Further, we performed GSEA to elucidate the reasons for the poor RFS of patients with higher risk scores. The results showed that the pathways significantly enriched in the high-risk group involved immune response, immune system process, negative regulation of immune effector process, and negative regulation of immune system process (P < 0.05) (Figure 7A–D). These results confirmed the close relationship of the risk signature with the immune microenvironment.
 |
Figure 7 GSEA of the risk score in PCa. The horizontal axis represents genes of the immune response (A), immune system process (B), negative regulation of immune effector process (C), and negative regulation of immune system process (D) gene sets, ranked by decreasing risk score. The vertical axis represents enrichment score. Abbreviations: GSEA, gene set enrichment analysis; PCa, prostate cancer; ES, enrichment score; NES, normalized enrichment score. |
Discussion
TME plays an important role in tumorigenesis, development, and response to therapies, especially immunotherapy. Based on genetic abnormalities, tumor cells can interact with their microenvironment to secrete high levels of immunosuppressive cytokines, which inhibit the proliferation and function of effector T cell.25 The immune microenvironment and TME-related genes have reportedly been involved in tumor progression and prognosis and are being pursued as potential therapeutic targets.26–28 However, research on the impact of tumor immune microenvironment on the prognosis of PCa is still scarce. Therefore, it is necessary to study further.
In this study, we identified a novel TME-related gene signature for predicting the prognosis of PCa via a systematic bioinformatics analysis. Firstly, we obtained the immune and stromal scores of PCa samples from the ESTIMATE tool and analyzed correlations between these scores and clinicopathological characteristics and RFS of these patients. Our results revealed that the stromal and immune scores were markedly associated with age, tumor stage, lymphatic metastasis, and Gleason score. Both immune and stromal scores of later tumor stage group were significantly higher compared to earlier stage group, which is consistent with the result from a previous study.20 In addition, Kaplan–Meier analysis revealed that higher immune and stromal scores were strongly associated with poorer RFS of PCa patients. These findings indicated that the TME composition was a critical factor which affects the clinical outcomes of PCa patients.
Tumor-infiltrating cells have been proved to have a crucial function in cancers and be associated with the development and prognosis of PCa. Compared to the normal prostate tissue, higher B cell infiltration was found in the PCa regions, suggesting that B cells can facilitate the development of PCa and serve as a therapeutic target.29 As an important part of TME, CAFs provide cancer cells with a suitable microenvironment to promote tumor growth and metastasis.30 Moreover, the alteration of gene expression in CAFs can be regarded as prognostic factors.30,31 Similarly, increased infiltrations of regulatory T cells and M2 macrophages in PCa tissue are also associated with a poor prognosis.32,33 In this study, we analyzed the proportions of infiltrating cells in the TME of high and low score groups to further elucidate the reasons for the poor RFS of patients with higher scores. Our results showed that the relative abundances of B cells, CAFs, CD4+ T cells, macrophages, and endothelial cells were significantly higher in both high immune and stromal score groups than that in the low score groups (P < 0.05), whereas the fraction of CD8+ T cells was significantly lower in the high immune score group (P < 0.0001). These results indicated that infiltrating cells in TME played an important role in the recurrence of PCa.
Next, we identified TME-related DEGs and performed enrichment analysis. A total of 238 intersecting genes were obtained for further analysis. The GO enrichment analysis showed that these TME-related genes were mainly involved in immune responses, especially immune cell activation and proliferation. Previous research has shown that cytokines are a family of low molecular weight proteins involved in a variety of immunobiological processes, including host defense, immune response, and inflammation response. Cytokines elicit their effects by binding to receptors on target cells.34 Cytokine and chemokines affect tumorigenesis by directly regulating the biological function of tumor cells, stromal cells, and immune cells, as well as inducing neovascularization in the cancer microenvironment.35,36 In this study, KEGG analysis revealed that 238 TME-related genes were obviously involved in immune-related pathways, such as cytokine–cytokine receptor interaction and chemokine signaling pathways. These results indicated that the TME-related genes were involved in the proliferation and progression of PCa by affecting the immune microenvironment.
Given the preciseness and accessibility of LASSO regression, we performed the LASSO regression analysis to screen covariates. Based on univariate analysis and regression coefficient, we identified two prognostic TME-related genes, namely, CLEC7A and COL11A1. Further, survival analysis indicated that high levels of CLEC7A and COL11A1 expression were strongly associated with reductions in RFS of PCa patients. Functional enrichment analysis revealed that CLEC7A and COL11A1 dramatically participated in the immune-related and cytoskeleton-related pathways.
CLEC7A, also known as dectin-1, is one of the best characterized C-type lectin receptors involved in various pathophysiological processes, including infection, allergy, regulation of inflammation, cancer, and other diseases.37 Dectin-1 exerts dual functions in cancer, acting both as a tumor promoter and as a tumor suppressor. For example, dectin-1 activation on macrophages by ligating the lectin galectin-9 facilitates pancreatic carcinoma progression and peritumoral immune tolerance.38 In contrast, dectin-1-mediated recognition of sialic acid-specific glycan structure on tumor cells can effectively lead to activation of macrophage tumoricidal response.39 Dectin-1 can also direct dendritic cells to prime antitumor Th9 cells.40 However, because the role of dectin-1/CLEC7A in PCa has not been reported in previous studies, little is known about their contribution to the development of PCa. So, more in-depth researches are still needed to explore the role of dectin-1/CLEC7A in PCa.
COL11A1, a minor fibrillary subtype of the collagen family, plays a vital role in growth, metastasis, and chemotherapy resistance of tumors.41,42 It has been demonstrated that over-expressed COL11A1 was associated with poor prognosis in various cancers, including esophageal squamous cell carcinoma,43 pancreatic cancer,44 ovarian cancer,45 and breast cancer.46 Nonetheless, like CLEC7A, the role of COL11A1 in PCa has not been reported, so the role of COL11A1 in prostate cancer is unknown. Our findings indicated that a high level of COL11A1 expression was strongly associated with a reduction in RFS of PCa patients, and COL11A1 might serve as a potential prognostic marker and therapeutic target for PCa.
Subsequently, we constructed a predictive risk model with the two key genes, which revealed a great capacity for predicting RFS. Patients with PCa were stratified to two distinct groups based on the best cutoff risk score. Compared with the low-risk group (n = 314), the number of PCa recurrence was higher in the high-risk group (n = 171). Specifically, recurrence occurred in 26.9% (46/171) of patients with high-risk scores, while only 8.6% (27/314) of patients experienced recurrence in the low-risk group. In addition, a high-risk score was significantly associated with lower RFS. Therefore, we suggested that PCa patients in the high-risk group should receive more attention and more frequent follow-up after therapy.
Finally, GSEA was performed and confirmed the close relationship between the risk scores and immune pathways. As it turns out, the pathways significantly enriched in the high-risk group involved immune response, immune system process, negative regulation of immune effector process, and negative regulation of immune system process, suggesting that immunosuppression exists in high-risk PCa patients, and is associated with poor outcome.
Conclusion
Based on immune and stromal scores that were significantly correlated with outcomes, a list of TME-related DEGs were identified and assessed via comprehensive bioinformatics analysis. Then two such genes (CLEC7A and COL11A1) were selected to build a predictive risk model using Cox regression analyses. Moreover, a high-risk score was significantly associated with lower RFS. GSEA suggested that immunosuppression existed in high-risk PCa patients, confirming the close relationship of the risk signature with the immune microenvironment. Therefore, the immune-related gene signature could help clinicians to assess the prognosis of PCa patients and select appropriate targets for immunotherapy.
Author Contributions
All authors made a significant contribution to the work reported, whether that is in the conception, study design, execution, acquisition of data, analysis and interpretation, or in all these areas: took part in drafting, revising or critically reviewing the article; gave final approval of the version to be published; have agreed on the journal to which the article has been submitted; and agreed to be accountable for all aspects of the work.
Funding
There is no funding to report.
Disclosure
The authors declare that they have no competing interests.
References
1. Sung H, Ferlay J, Siegel RL, et al. Global cancer statistics 2020: GLOBOCAN estimates of incidence and mortality worldwide for 36 cancers in 185 countries. CA Cancer J Clin. 2021;71(3):209–249. doi:10.3322/caac.21660
2. Herden J, Heidenreich A, Weissbach L. Risk stratification: a tool to predict the course of active surveillance for localized prostate cancer? BJU Int. 2017;120(2):212–218. doi:10.1111/bju.13715
3. Caster JM, Falchook AD, Hendrix LH, Chen RC. Risk of pathologic upgrading or locally advanced disease in early prostate cancer patients based on Biopsy Gleason Score and PSA: a Population-Based Study of Modern Patients. Int J Radiat Oncol Biol Phys. 2015;92(2):244–251. doi:10.1016/j.ijrobp.2015.01.051
4. Dimakakos A, Armakolas A, Koutsilieris M. Novel tools for prostate cancer prognosis, diagnosis, and follow-up. Biomed Res Int. 2014;2014:890697. doi:10.1155/2014/890697
5. Tosoian JJ, Gorin MA, Ross AE, Pienta KJ, Tran PT, Schaeffer EM. Oligometastatic prostate cancer: definitions, clinical outcomes, and treatment considerations. Nat Rev Urol. 2017;14(1):15–25. doi:10.1038/nrurol.2016.175
6. Cho IC, Kwon WA, Kim JE, et al. Prostate volume has prognostic value only in pathologic T2 radical prostatectomy specimens. J Korean Med Sci. 2011;26(6):807–813. doi:10.3346/jkms.2011.26.6.807
7. Westdorp H, Skold AE, Snijer BA, et al. Immunotherapy for prostate cancer: lessons from responses to tumor-associated antigens. Front Immunol. 2014;5:191. doi:10.3389/fimmu.2014.00191
8. Bostwick DG, de la Roza G, Dundore P, Corica FA, Iczkowski KA. Intraepithelial and stromal lymphocytes in the normal human prostate. Prostate. 2003;55(3):187–193. doi:10.1002/pros.10224
9. Russo JW, Balk SP. Initiation and evolution of early onset prostate cancer. Cancer Cell. 2018;34(6):874–876. doi:10.1016/j.ccell.2018.11.010
10. Tyekucheva S, Bowden M, Bango C, et al. Stromal and epithelial transcriptional map of initiation progression and metastatic potential of human prostate cancer. Nat Commun. 2017;8(1):420. doi:10.1038/s41467-017-00460-4
11. Hanahan D, Coussens LM. Accessories to the crime: functions of cells recruited to the tumor microenvironment. Cancer Cell. 2012;21(3):309–322. doi:10.1016/j.ccr.2012.02.022
12. Sahai E, Astsaturov I, Cukierman E, et al. A framework for advancing our understanding of cancer-associated fibroblasts. Nat Rev Cancer. 2020;20(3):174–186. doi:10.1038/s41568-019-0238-1
13. Kim MG, Shon Y, Kim J, Oh YK. Selective activation of anticancer chemotherapy by cancer-associated fibroblasts in the tumor microenvironment. J Natl Cancer Inst. 2017;109(1):djw186. doi:10.1093/jnci/djw186
14. Loktev A, Lindner T, Mier W, et al. A tumor-imaging method targeting cancer-associated fibroblasts. J Nucl Med. 2018;59(9):1423–1429. doi:10.2967/jnumed.118.210435
15. Di Donato M, Zamagni A, Galasso G, et al. The androgen receptor/filamin A complex as a target in prostate cancer microenvironment. Cell Death Dis. 2021;12(1):127. doi:10.1038/s41419-021-03402-7
16. Yoshihara K, Shahmoradgoli M, Martinez E, et al. Inferring tumour purity and stromal and immune cell admixture from expression data. Nat Commun. 2013;4:2612. doi:10.1038/ncomms3612
17. Sun S, Guo W, Wang Z, et al. Development and validation of an immune-related prognostic signature in lung adenocarcinoma. Cancer Med. 2020;9(16):5960–5975. doi:10.1002/cam4.3240
18. Du GW, Yan X, Chen Z, et al. Identification of transforming growth factor beta induced (TGFBI) as an immune-related prognostic factor in clear cell renal cell carcinoma (ccRCC). Aging (Albany N Y). 2020;12(9):8484–8505.
19. Li F, Guo H, Wang Y, Liu B, Zhou H. Profiles of tumor-infiltrating immune cells and prognostic genes associated with the microenvironment of bladder cancer. Int Immunopharmacol. 2020;85:106641. doi:10.1016/j.intimp.2020.106641
20. Zhao X, Hu D, Li J, Zhao G, Tang W, Cheng H. Database mining of genes of prognostic value for the prostate adenocarcinoma microenvironment using the cancer gene atlas. Biomed Res Int. 2020;2020:5019793.
21. Camp RL, Dolled-Filhart M, Rimm DL. X-tile: a new bioinformatics tool for biomarker assessment and outcome based cut-point optimization. Clin Cancer Res. 2004;10(21):7252–7259. doi:10.1158/1078-0432.CCR-04-0713
22. Yuan Y, Xu Y, Xu J, Ball RL, Liang H. Predicting the lethal phenotype of the knockout mouse by integrating comprehensive genomic data. Bioinformatics. 2012;28(9):1246–1252. doi:10.1093/bioinformatics/bts120
23. Mootha VK, Lindgren CM, Eriksson KF, et al. PGC-1alpha-responsive genes involved in oxidative phosphorylation are coordinately downregulated in human diabetes. Nat Genet. 2003;34(3):267–273. doi:10.1038/ng1180
24. Racle J, de Jonge K, Baumgaertner P, Speiser DE, Gfeller D. Simultaneous enumeration of cancer and immune cell types from bulk tumor gene expression data. Elife. 2017;6. doi:10.7554/eLife.26476
25. Chen J, Guo XZ, Li HY, Zhao JJ, Xu WD. Dendritic cells engineered to secrete anti-DcR3 antibody augment cytotoxic T lymphocyte response against pancreatic cancer in vitro. World J Gastroenterol. 2017;23(5):817–829. doi:10.3748/wjg.v23.i5.817
26. Sun T, Patil R, Galstyan A, et al. Blockade of a Laminin-411-Notch Axis with CRISPR/Cas9 or a nanobioconjugate inhibits glioblastoma growth through tumor-microenvironment cross-talk. Cancer Res. 2019;79(6):1239–1251. doi:10.1158/0008-5472.CAN-18-2725
27. Ren B, Cui M, Yang G, et al. Tumor microenvironment participates in metastasis of pancreatic cancer. Mol Cancer. 2018;17(1). doi:10.1186/s12943-018-0858-1
28. Zhang G, Lu J, Yang M, Wang Y, Liu H, Xu C. Elevated GALNT10 expression identifies immunosuppressive microenvironment and dismal prognosis of patients with high grade serous ovarian cancer. Cancer Immunol Immunother. 2020;69(2):175–187. doi:10.1007/s00262-019-02454-1
29. Woo JR, Liss MA, Muldong MT, et al. Tumor infiltrating B-cells are increased in prostate cancer tissue. J Transl Med. 2014;12:30. doi:10.1186/1479-5876-12-30
30. Shen T, Li Y, Zhu S, et al. YAP1 plays a key role of the conversion of normal fibroblasts into cancer-associated fibroblasts that contribute to prostate cancer progression. J Exp Clin Cancer Res. 2020;39(1):36. doi:10.1186/s13046-020-1542-z
31. Pertega-Gomes N, Vizcaino JR, Attig J, Jurmeister S, Lopes C, Baltazar F. A lactate shuttle system between tumour and stromal cells is associated with poor prognosis in prostate cancer. BMC Cancer. 2014;14:352. doi:10.1186/1471-2407-14-352
32. Watanabe M, Kanao K, Suzuki S, et al. Increased infiltration of CCR4-positive regulatory T cells in prostate cancer tissue is associated with a poor prognosis. Prostate. 2019;79(14):1658–1665. doi:10.1002/pros.23890
33. Erlandsson A, Carlsson J, Lundholm M, et al. M2 macrophages and regulatory T cells in lethal prostate cancer. Prostate. 2019;79(4):363–369. doi:10.1002/pros.23742
34. Adekoya TO, Richardson RM. Cytokines and chemokines as mediators of prostate cancer metastasis. Int J Mol Sci. 2020;21(12):4449. doi:10.3390/ijms21124449
35. Dranoff G. Cytokines in cancer pathogenesis and cancer therapy. Nat Rev Cancer. 2004;4(1):11–22. doi:10.1038/nrc1252
36. Nagarsheth N, Wicha MS, Zou W. Chemokines in the cancer microenvironment and their relevance in cancer immunotherapy. Nat Rev Immunol. 2017;17(9):559–572. doi:10.1038/nri.2017.49
37. Tone K, Stappers MHT, Willment JA, Brown GD. C-type lectin receptors of the Dectin-1 cluster: physiological roles and involvement in disease. Eur J Immunol. 2019;49(12):2127–2133. doi:10.1002/eji.201847536
38. Daley D, Mani VR, Mohan N, et al. Dectin 1 activation on macrophages by galectin 9 promotes pancreatic carcinoma and peritumoral immune tolerance. Nat Med. 2017;23(5):556–567. doi:10.1038/nm.4314
39. Alaeddine M, Prat M, Poinsot V, et al. IL13-mediated Dectin-1 and mannose receptor overexpression promotes macrophage antitumor activities through recognition of sialylated tumor cells. Cancer Immunol Res. 2019;7(2):321–334. doi:10.1158/2326-6066.CIR-18-0213
40. Zhao Y, Chu X, Chen J, et al. Dectin-1-activated dendritic cells trigger potent antitumour immunity through the induction of Th9 cells. Nat Commun. 2016;7:12368. doi:10.1038/ncomms12368
41. Shen L, Yang M, Lin Q, Zhang Z, Zhu B, Miao C. COL11A1 is overexpressed in recurrent non-small cell lung cancer and promotes cell proliferation, migration, invasion and drug resistance. Oncol Rep. 2016;36(2):877–885. doi:10.3892/or.2016.4869
42. Fischer H, Stenling R, Rubio C, Lindblom A. Colorectal carcinogenesis is associated with stromal expression of COL11A1 and COL5A2. Carcinogenesis. 2001;22(6):875–878. doi:10.1093/carcin/22.6.875
43. Zhang B, Zhang C, Yang X, et al. Cytoplasmic collagen XIalphaI as a prognostic biomarker in esophageal squamous cell carcinoma. Cancer Biol Ther. 2018;19(5):364–372. doi:10.1080/15384047.2018.1423915
44. Sun D, Jin H, Zhang J, Tan X. Integrated whole genome microarray analysis and immunohistochemical assay identifies COL11A1, GJB2 and CTRL as predictive biomarkers for pancreatic cancer. Cancer Cell Int. 2018;18:174. doi:10.1186/s12935-018-0669-x
45. Wu YH, Chang TH, Huang YF, Huang HD, Chou CY. COL11A1 promotes tumor progression and predicts poor clinical outcome in ovarian cancer. Oncogene. 2014;33(26):3432–3440. doi:10.1038/onc.2013.307
46. Toss MS, Miligy IM, Gorringe KL, et al. Collagen (XI) alpha-1 chain is an independent prognostic factor in breast ductal carcinoma in situ. Mod Pathol. 2019;32(10):1460–1472. doi:10.1038/s41379-019-0286-9
 © 2021 The Author(s). This work is published and licensed by Dove Medical Press Limited. The
full terms of this license are available at https://www.dovepress.com/terms
and incorporate the Creative Commons Attribution
- Non Commercial (unported, 3.0) License.
By accessing the work you hereby accept the Terms. Non-commercial uses of the work are permitted
without any further permission from Dove Medical Press Limited, provided the work is properly
attributed. For permission for commercial use of this work, please see paragraphs 4.2 and 5 of our Terms.
© 2021 The Author(s). This work is published and licensed by Dove Medical Press Limited. The
full terms of this license are available at https://www.dovepress.com/terms
and incorporate the Creative Commons Attribution
- Non Commercial (unported, 3.0) License.
By accessing the work you hereby accept the Terms. Non-commercial uses of the work are permitted
without any further permission from Dove Medical Press Limited, provided the work is properly
attributed. For permission for commercial use of this work, please see paragraphs 4.2 and 5 of our Terms.