Back to Journals » Journal of Inflammation Research » Volume 15
Complement Terminal Pathway Activation is Associated with Organ Failure in Sepsis Patients
Authors Ahmad FM ![]() , A Al-Binni M, Bani Hani A
, A Al-Binni M, Bani Hani A ![]() , Abu Abeeleh M, Abu-Humaidan AHA
, Abu Abeeleh M, Abu-Humaidan AHA
Received 13 October 2021
Accepted for publication 9 December 2021
Published 8 January 2022 Volume 2022:15 Pages 153—162
DOI https://doi.org/10.2147/JIR.S344282
Checked for plagiarism Yes
Review by Single anonymous peer review
Peer reviewer comments 2
Editor who approved publication: Professor Ning Quan
Fatima M Ahmad,1,2 Maysaa’ A Al-Binni,2 Amjad Bani Hani,3 Mahmoud Abu Abeeleh,3 Anas HA Abu-Humaidan1
1Department of Pathology, Microbiology and Forensic Medicine, School of Medicine, The University of Jordan, Amman, Jordan; 2Department of the Clinical Laboratory Sciences, School of Science, The University of Jordan, Amman, Jordan; 3Department of General Surgery, School of Medicine, The University of Jordan, Amman, Jordan
Correspondence: Anas HA Abu-Humaidan Tel +962779227922
Email [email protected]
Background: Complement plays a pivotal role in the immune response to infection. Several studies demonstrated complement activation in sepsis, yet little is known of the relationship of complement terminal pathway activation and the clinical characteristics of sepsis patients. Therefore, we investigated serum C5, soluble C5b-9 (sC5b-9), and soluble CD59 (sCD59) and their relation to organ failure in sepsis patients in the intensive care unit (ICU).
Methods: In this prospective cohort study, all available patients admitted to the adult ICUs between June 2020 and January 2021 were included. Patients were divided into sepsis and non-sepsis groups according to the Sepsis-3 criteria, serum samples from both groups were investigated for the levels of C5, sC5b-9, and sCD59 using commercial sandwich ELISA kits.
Results: We analyzed 79 serum samples, 36 were from sepsis patients. We found that sepsis patients had significantly lower C5 (83.6± 28.4 vs 104.4± 32.0 μg/mL, p = 0.004) and higher sCD59 (380.7± 170.5 vs 288.9± 92.5 ng/mL, p = 0.016). sC5b-9, although higher in sepsis patients, did not reach statistical significance (1.5± 0.8 μg/mL vs 1.3± 0.7 μg/mL, p = 0.293). Sepsis patients who died during their ICU stay had significantly higher sCD59 compared to those who survived (437.0 ± 176.7 vs 267.8 ± 79.7 ng/mL, p = 0.003, respectively). Additionally, C5 and sCD59 both correlated to SOFA score in the sepsis group (rs = − 0.44, P = 0.007 and = 0.43, P = 0.009, respectively), and a similar correlation was not found in the non-sepsis group.
Discussion: In sepsis patients, levels of C5 and sCD59, but not sC5b-9, correlated to the severity of organ damage measured by SOFA. A similar correlation was not found in non-sepsis patients. This indicated that organ damage associated with sepsis led to a more pronounced terminal pathway activation than in non-sepsis patients, it also indicated the potential of using C5 and sCD59 to reflect sepsis severity.
Keywords: C5, C5b-9, CD59, Sequential Organ Failure Assessment, intensive care unit
Graphical Abstract:

Introduction
Sepsis remains a major health problem in ICU patients worldwide due to its high morbidity and mortality. Although sepsis is a multifaceted problem, the immune response to infection is essential in the development of sepsis and the associated organ failure. The Third International Consensus Definitions for Sepsis and Septic Shock (Sepsis-3) defined sepsis as life-threatening organ dysfunction caused by a dysregulated host response to infection.1 Given the importance of the immune response in sepsis, a better understanding of the immune pathways involved in sepsis development can uncover novel biomarkers and checkpoint inhibitors.
The complement system is an essential part of innate immunity, complement activation aims to clear invading pathogens as well as damaged host tissue, but complement over activation is implicated in a variety of pathological conditions including sepsis.2,3 Activation of the three major pathways of complement, including the classical,4 lectin,5 and alternative6 pathways can take place in sepsis.3,7 Moreover, some studies reported a correlation between levels of complement activation fragments such as C3b and C5a to sepsis severity.6,8 Complement activation can culminate in activation of the terminal pathway, through cleavage of C5 to form C5a, a potent anaphylatoxin, and C5b, which initiates formation of the pore forming complex C5b-9 on cellular membranes.9,10 Soluble C5b-9 (sC5b-9) can be found in serum and is commonly considered non-lytic, however, it is hypothesized to increase capillary permeability and contribute to the development of septic shock.11,12
Activation and progression of complement pathways are strictly controlled by multiple regulators.13,14 A main regulator of complement terminal pathway is CD59, which is a glycophosphoinositol (GPI)-anchored inhibitor of C5b-9 formation.13,15 Because of its relatively loose attachment by a GPI-anchor, CD59 can be released in vesicles or enzymatically from the cell surface into the circulation to form soluble CD59 (sCD59).16 Since CD59 can be found on the membrane of several cell types including hematopoietic and epithelial cells, it is hypothesized that tissue damage can be associated with the release of sCD59, yet the exact mechanisms and disease states associated with its release are still under investigation.
Complement proteins, regulators, and activation fragments can serve as potential biomarkers17 or drug targets18 in sepsis, therefore, translational studies that link predefined clinical criteria to measured complement parameters are needed. The Sequential Organ Failure Assessment (SOFA) score, was first developed in 1996 for the clinical assessment of sepsis patients.2 The score is now widely used to evaluate acute morbidity and predict outcome of critical illness among ICU patients in general.19,20 SOFA score can also be used alongside biomarkers to enhance the prediction of patient outcome.21
Our study focused on activation of complement terminal pathway in sepsis by measuring serum C5, sC5b-9, and sCD59. We defined sepsis according to Sepsis-3 and compared the levels of these proteins in sepsis and non-sepsis patients in the ICU, either within 48 hours of admission or afterwards. We also performed correlation analysis of the terminal pathway parameters measured and the SOFA score of sepsis and non-sepsis patients.
Materials and Methods
Study Design and Population
This was a prospective cohort study conducted at adult ICUs of Jordan University Hospital (JUH), which is an academic tertiary hospital in the capital Amman. The hospital has 3 adult ICUs: surgical (SICU), medical (MICU), and anaesthesia ICU (AICU), with a total of 32 ICU beds. We followed 194 admissions to the ICUs over a period of 6 months (from July 15, 2020, through January 15, 2021) until ICU discharge or death (see graphical abstract).
Inclusion criterion was age at ICU admission ≥18 years. While exclusion criteria were 1) having used complement inhibition therapy within the last 3 months and 2) documented complement deficiency. The diagnosis of sepsis was based on Sepsis-3 criteria, proposed in 2016 by the “Third International Consensus Definitions for Sepsis and Septic Shock”.1 As there was no point of care test for lactate, we did not assign a subset of septic shock patients according to Sepsis-3 criteria. The time point day 0 represent the first 24 hours since ICU admission, while day 1 is 24–48 hours since ICU admission, and so on.
Among 194 ICU admissions, there were 45 sepsis patients. We aimed to analyse samples that represent various SOFA scores and time points in both sepsis and non-sepsis patients, so we first stratified the available samples into sepsis and non-sepsis groups, then sub-stratified those groups into 4 SOFA score arrays which correspond to varying degrees of organ dysfunction: SOFA score less than 3, more than or equal to 3 and less than 7, more than or equal to 7 and less than 11, more than or equal to 11. Further sub-stratification was done according to time of sample collection, either within the first 48 hours of admission to the ICU or afterwards. We then randomly selected 79 samples from the above stratification in equal numbers depending on sample availability.
Sample Collection
Blood samples were collected either within 48 hours of admission (45 samples, median day 1), or at various time point after that (34 samples, median day 6) (see graphical abstract). Samples were collected in plain blood collection tubes with a gel separator, then immediately preserved at 4°C and allowed to clot for a maximum of 2 hours. Samples were then transported on ice for further processing. Serum was collected by centrifugation of clotted blood tubes for 15 minutes at 1500 × g and 4°C. Serum was directly aliquoted into sterile EP tubes and stored immediately at −80°C until analysis. The selected serum samples were thawed on ice on the day of the experiments. Repeat freeze–thaw cycles were avoided to prevent protein degradation.
C5, sC5b-9, and sCD59 Quantification in Serum
Commercial quantitative sandwich ELISA kits for the measurement of C5, sC5b-9, and sCD59 (Novus biologicals, Colorado, USA) were used according to manufacturer’s instructions. Briefly, all reagents and standard solutions were prepared and brought to room temperature (25°C) prior to the analysis. Standards and samples were diluted in diluent according to literature and manufacturer recommendation, then were added to a microwell plate precoated with polyclonal antibodies specific for the desired complement component and incubated according to manufacturer recommendation, free components were washed away afterwards.
A biotinylated detection antibody specific for the desired complement component and Avidin-Horseradish Peroxidase (HRP) conjugate were added successively to each well and incubated. Then, free components were washed and the substrate solution was added to each well leading to color production. The enzyme-substrate reaction was terminated by the addition of stop solution. The optical density (OD) was measured at 450nm wavelength using Synergy™ HTX Multi-Mode Microplate Reader and Gen5TM software (BioTek instruments, Vermont, USA), the value of each sample is calculated by comparing the OD of the samples to the standard curve values using GraphPad prism 8.0 for windows (GraphPad Software, California, USA). The standard curve range for each complement component was 0.313–20 ng/mL for C5 and 31.25–2000 ng/mL for sC5b-9 and sCD59, dilution of serum samples for measurement of each component were done accordingly.
Ethical Approval
The study protocol was approved by the Institutional Review Board (IRB) at JUH (Ref. No. 189/2020). In addition, the work was conducted according to the principles of Good Clinical Practice (GCP) that has its origin in the Declaration of Helsinki (64th World Medical Association General Assembly, Fortaleza, Brazil, October 2013). All collected data were treated with confidentiality.
Participation in the study was voluntary. A signed informed consent was obtained from all conscious patients who agreed to participate after an explanation of the study objectives. Assessment of the level of consciousness involved checking orientation: participants who were able to promptly and spontaneously state their name, location, and date or time were said to be conscious.19 For patients who were unconscious or unable to consent at the time of admission, assent was obtained from first-degree relatives. However, consent was re-sought from those who survived once they regained consciousness or improved clinically to a stage where they can consent.
Data Collection
For each patient, data were categorized into demographic, clinical, and laboratory variables. Demographic variables included age, sex, height, weight. Clinical variables included vital signs and clinical criteria required for SOFA scoring. Laboratory variables include hemoglobin (HB), packed cell volume (PCV), total WBC count, neutrophils, lymphocytes, platelets count, creatinine, random blood sugar (RBS), and electrolytes (Na, K, and CL). The above-mentioned data can be found in Supplementary Table 1.
Data Analysis
Data generated was organized in Microsoft Excel, and statistical analysis was carried out using IBM Statistical Package for the Social Sciences (SPSS) for windows version 25.0 (IBM Corp., Armonk, N.Y., USA) and GraphPad prism 8.0 for windows (GraphPad Software, California, USA) for analysis.
All results are presented as count or percent or both (n, (%)) for categorical variables and (mean ± SD) for continuous variables. To compare differences between sepsis and non-sepsis groups, as well as ICU survivors and non-survivors, Shapiro–Wilk test was first used to test the distribution of data, subsequently, the Mann–Whitney U-test was used. The nonparametric Spearman correlation coefficient was used to denote the magnitude and direction of correlation between different variables. All statistical tests were two-tailed and a probability value (p) less than 0.05 was considered significant.
Results
Terminal Pathway Activation in Sepsis Patients
To assess activation of the terminal pathway in sepsis and non-sepsis patients, we measured C5, sC5b-9 and sCD59 levels in all 79 serum samples collected from ICU patients (as described in materials and methods). Depending on their diagnosis at the time of sample collection, patients were divided into sepsis (n = 36) and non-sepsis (n = 43) groups, SOFA scores of sepsis and non-sepsis patients are found in Figure 1A. The demographic, clinical, and routine laboratory data for patients on the same day of serum sample collection are found in Supplementary Table 1.
We found that serum of sepsis patients had significantly lower C5 compared to non-sepsis patients (83.6 ± 28.4 vs 104.4 ± 32.0 µg/mL, p = 0.004) (Figure 1B), indicating consumption of C5 in sepsis patients. While we found higher mean sC5b-9 in sepsis patients, it was not statistically significant (1.5 ± 0.8 µg/mL vs 1.3 ± 0.7 µg/mL, p = 0.293) (Figure 1C). On the other hand, the serum levels of the terminal pathway regulator sCD59 was significantly higher in sepsis patients (380.7 ± 170.5 vs 288.9± 92.5 ng/mL, p = 0.016) (Figure 1D). The increased consumption of C5 and elevation of sCD59 both indicated activation of the terminal pathway in sepsis patients.
We also assessed the ratios of sC5b-9 to C5 (sC5b-9/C5), and sCD59 to C5 (sCD59/C5) which we hypothesized would reflect activation of the terminal pathway better than either component alone, since the ratio is expected to normalize the variability in sC5b-9 and sCD59 levels caused by variation in C5 levels in different patients. Both sC5b-9/C5 and sCD59/C5 were significantly higher in sepsis patients than non-sepsis patients ((2.1 ± 1.6)*10−2 vs (1.4 ± 1.1)*10−2, p = 0.009) and ((5.5 ± 3.7)*10−3 vs (3.0 ± 1.4)*10−3, p ≤ 0.001), respectively (Figure 1E and F).
Terminal Pathway Activation at Different Time Points of the ICU Stay
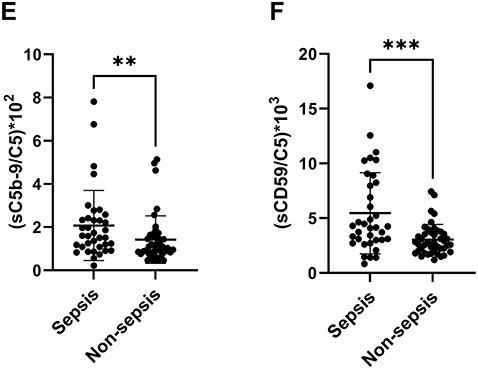
To evaluate whether terminal pathway activation occurs early in sepsis, we investigated serum samples collected from patients within 48 hours of ICU admission (n = 45, median day 1). Sepsis patients (n = 22) had significantly higher SOFA score (Figure 2A) and lower C5 than non-sepsis patients (Figure 2B), but no significant differences were found in sC5b-9 and sCD59 at this time point (Figure 2C and D). Indicating that C5 consumption happened early in sepsis. When we examined samples which were collected after the first 48 hours of ICU admission (n = 34, median day 6), sepsis patients (n = 14) had significantly higher SOFA score (Figure 2E) but did not have significantly different C5 or sC5b-9 levels than non-sepsis patients (Figure 2F and G), while sCD59 was significantly higher in sepsis patients (Figure 2H). This indicated that an increase in sCD59 happened later in sepsis.
Terminal Pathway Activation and ICU Mortality in Sepsis Patients
To determine if terminal pathway activation is associated with mortality in sepsis patients, we compared parameters of terminal pathway activation described above in sepsis patients who were discharged alive from the ICU (n = 12), and those who died during their ICU stay (n = 24). While SOFA score was higher in sepsis patients who died during their ICU stay (Figure 3A), among the terminal pathway parameters studied, no significant differences were found in C5 (82.2 ± 30.1 vs 86.3 ± 25.5, p = 0.567, respectively) and sC5b-9 (1.5 ± 0.8 vs 1.5 ± 0.7, p = 0.602, respectively) (Figure 3B and C). While sCD59 was significantly higher in sepsis patients who died during their ICU stay compared to those who survived (437.0 ± 176.7 vs 267.8 ± 79.7, p = 0.003, respectively) (Figure 3D).
In the non-sepsis group on the other hand, SOFA score was also higher in patients who died during their ICU stay (Figure 3E), but we found no significant differences between survivors (n = 34) and non-survivors (n = 8) in any of the terminal pathway parameters measured (Figure 3F–H). Notably, when comparing sepsis and non-sepsis patients who died during their ICU stay (n = 24 vs n = 8, respectively), there was no significant difference in SOFA score in both groups (Figure 3I), nor in C5 or sC5b-9 (Figure 3J and K), but we found significantly higher sCD59 (437.0 ± 176.7 vs 273.1 ± 89.1, p = 0.012, respectively) (Figure 3L).
Terminal Pathway Activation and SOFA Score
To further describe the relationship between terminal pathway activation and the clinical picture observed, we assessed the correlation of C5, sC5b-9, sCD59 to SOFA score in sepsis and non-sepsis patients. Using Spearman correlation coefficient (rs), we found that C5 had a moderate negative correlation to SOFA score (rs = −0.44, P = 0.007), while sCD59 had a moderate positive correlation to SOFA score (rs = 0.43, P = 0.009). sC5b-9 on the other hand showed a weaker and statistically non-significant correlation (rs = 0.25, P = 0.149) (Table 1). In the non-sepsis group, there was no significant correlation between any parameter measured and SOFA score, additionally, we assessed whether there is a significant difference in correlation between the sepsis and non-sepsis groups (Table 1).
 |
Table 1 Assessing the Correlation of Terminal Pathway Parameters to SOFA Score |
We also examined whether terminal pathway activation products are associated to each other as is expected when terminal pathway is activated, we found that C5 and sCD59 indeed were negatively and significantly correlated in sepsis patients (rs = −0.45, P = 0.005), but not C5b-9 with either C5 or sCD59 (Table 1). In non-sepsis patients, we found no significant correlation between any of the terminal pathway parameters (Table 1).
Finally, we assessed whether terminal pathway activation is associated with a change in systemic markers of inflammation found in routine blood tests, such as C-reactive protein (CRP) and WBC count including neutrophils and lymphocytes, as well as neutrophil to lymphocyte ratio (N/L). A correlation matrix of terminal pathway parameters, laboratory results, and SOFA score can be found in Supplementary Figure 1. The correlation matrix showed that C5 and sCD59 had the highest correlation to SOFA score when compared to any of the above markers of inflammation.
Discussion
The pathophysiology of sepsis is complex as it involves disturbances in several immune, metabolic, and coagulation pathways.20 The immune system plays an essential role in the development and progression of sepsis, hence a better understanding of the immune disturbances during sepsis can yield novel therapeutic targets and biomarkers.21 Our study investigated terminal pathway activation and its relation to organ failure in sepsis patients in the ICU. We used the Sepsis-3 definition in sorting patients into sepsis and non-sepsis groups.1 We also used SOFA score as an indicator of organ failure given its wide use and success in predicting patients’ outcome in the ICU.22
Terminal pathway activation is thought to augment the immune response in sepsis, often in a deleterious manner.23 Previous studies have shown a decrease in the level of C5 in sepsis patients and in animal models.6,23 Our study confirmed the consumption of C5 in sepsis patients,6 we also found that C5 consumption occurred early in sepsis, since it was significantly lower in sepsis patients than non-sepsis patients in the first 48 hours of ICU admission. Additionally, we found a negative correlation between C5 levels and SOFA score in sepsis patients, which was not the case in the non-sepsis group. This could indicate that terminal pathway activation is more pronounced in organ failure associated with sepsis, and thus this subset of patients could benefit more from therapies targeting C5,24 especially early in the course of disease.
In addition to C5 consumption in sepsis patients, we found an increase in sC5b-9, although the increase was not statistically significant. While some studies report a significant increase in sC5b-9 in sepsis,6,25 one study found no correlation of sC5b-9 to disease severity in critically ill patients,26 this could be due to differences in the population studied, sample size, sample type, and methods used to assess terminal pathway activation. Still, the correlation of sC5b-9 to SOFA score was not significant, neither was the correlation of sC5b-9 to C5 or sCD59, unlike the significant correlation between C5 and sCD59. This data indicated that sC5b-9 levels did not reflect terminal pathway activation in sepsis, while C5 and sCD59 levels did reflect terminal pathway activation. However, the ratio of sC5b-9/C5 was significantly increased in sepsis patients, indicating that using a ratio when assessing complement activation could lead to better estimation of complement activity as proposed previously.17
The findings regarding sCD59 are the most important in this study since little is known regarding sCD59 in sepsis patients. We found that sepsis patients had significantly higher sCD59, especially after the first 48 hours of ICU admission, which could be due to the cellular damage at the site of infection leading to release of sCD59 from the cell membrane into circulation. The level of sCD59 correlated to C5 levels indicating that there is an association between terminal pathway activation and release of the terminal pathway regulator sCD59, but whether sCD59 release is a byproduct of cellular damage or is directly linked to terminal pathway activation at the site of infection remains to be identified and merits further investigation. Nevertheless, the importance of this phenomenon is highlighted by the findings in sepsis non-survivors, who had higher levels of sCD59 compared to sepsis survivors and to non-sepsis non-survivors, those two findings indicate that an increase in sCD59 is related to lethal organ failure due to infection rather than other causes. The significant correlation of sCD59 to organ failure as measured by the SOFA score in sepsis patients only, further emphasize that sCD59 release was specific to organ damage associated with infection.
CD59 is a GPI-anchored protein that can be detected in serum due to release from the cell membrane either by enzymatic proteolytic or lipolytic cleavage, or as part of released exosomes.27,28 One study on acute pancreatitis patients showed an elevation in plasma sCD59 that was predictive of disease severity,29 probably in a similar mechanism to what we saw in sepsis patients, given the similarities between sepsis and acute pancreatitis in the immune response and accompanying organ damage.30 Another study found an increase in sCD59 in acute myocardial infarction patients,31 but in this study the levels of sCD59 correlated to the increase in sC5b-9 unlike what we found in our study, this could be due to disparities in the mechanisms leading to release of sCD59 into circulation.
This study had some limitations, most notable is the small sample size, for example, we were not able to solidly conclude whether sC5b-9 release was increased in sepsis or not, nor to conclude if sCD59 was associated with lethal organ damage in sepsis patients only, both findings are of importance and require further studies with larger sample sizes. A second limitation was investigating two time points only, more time points could provide the actual trend of complement levels. Still, this study replicated findings of C5 consumption in sepsis using the most recent definition of sepsis and was the first to investigate the correlation of C5, sC5b-9, and sCD59 to a widely used clinical scale such as SOFA, thereby providing preliminary data for future studies that will investigate the use of complement inhibitors or immune modulators in sepsis. Finally, since complement levels and functional activity can vary by race,32 this study provided preliminary data on the levels of complement terminal pathway parameters in the Jordanian population, for which no previous data exists.
In conclusion, our study emphasized the important role terminal pathway activation plays in sepsis development and the accompanying organ damage. We found that C5 is decreased within 48 hours of sepsis, while sCD59 is increased in sepsis at a later stage probably following cellular damage. Both C5 and sCD59 significantly correlated to SOFA score in sepsis patients. Interestingly, sCD59 was significantly higher in sepsis patients who died during their ICU stay than those who were discharged alive. Further studies are needed to elucidate the mechanism leading to sCD59 release to the circulation in sepsis, whether sCD59 has any immunological role, and finally the feasibility of using sCD59 as a biomarker for organ damage in sepsis.
Figure 1 Continued. Figure 1 Terminal pathway activation in sepsis patients. 79 serum samples were collected from ICU patients at various time points of their ICU stay, patients were divided into sepsis (n = 36) and non-sepsis (n = 43) groups according to their diagnosis at the time of sample collection. (A) SOFA scores of sepsis and non-sepsis patients at the time of sample collection. (B) C5, (C) sC5b-9, and (D) sCD59 levels in sepsis and non-sepsis patients. (E) the ratio of sC5b-9/C5 and (F) sCD59/C5 were calculated from each sample to minimize variation due to C5 levels. Each circle in the scatter plots represents one patient. Bold horizontal lines represent the mean of each group, while whiskers represent the standard deviation. ns P > 0.05, *P ≤ 0.05, **P ≤ 0.01, ***P ≤ 0.001, ****P ≤ 0.0001.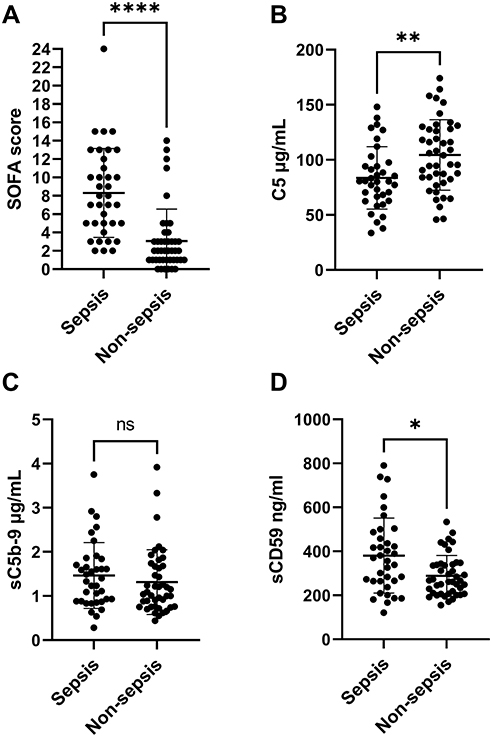
 |
Figure 2 Terminal pathway activation at different time points of the ICU stay. (A–D) represent SOFA scores, C5, sC5b-9, and sCD59 levels respectively, in sepsis (n = 22) and non-sepsis (n = 23) patients within the first 48 hours of ICU admission (median day 1). While (E–H) represent SOFA scores, C5, sC5b-9, and sCD59 levels in sepsis (n = 14) and non-sepsis (n = 20) patients after the first 48 hours of ICU admission (median day 6). Each circle in the scatter plots represents one patient. Bold horizontal lines represent the mean of each group, while whiskers represent the standard deviation. ns P > 0.05, *P ≤ 0.05, ***P ≤ 0.001, ****P ≤ 0.0001. |
 |
Figure 3 Terminal pathway activation and ICU mortality. (A–D) represent SOFA scores, C5, sC5b-9, and sCD59 levels respectively, in sepsis patients who died during their ICU stay (n = 24) and those who were discharged alive (n =12). While (E–H) represent SOFA scores, C5, sC5b-9, and sCD59 levels respectively, in non-sepsis patients who died during their ICU stay (n = 8) or those who were discharged alive (n = 34). (I–L) represent SOFA scores, C5, sC5b-9, and sCD59 levels respectively, in patients who died during their ICU stay and were either from the sepsis group (n=24) or from the non-sepsis group (n = 8). Each circle in the scatter plots represents one patient. Bold horizontal lines represent the mean of each group, while whiskers represent the standard deviation. ns P > 0.05, *P ≤ 0.05, **P ≤ 0.01, ***P ≤ 0.001. |
Acknowledgments
We are grateful for the help provided by the medical and nursing teams at JUH ICUs.
Funding
This work was supported by the Deanship of Academic Research at the University of Jordan, grant numbers (576/2020/19) and (99/2021/19), granted on 8 July 2020 and 20 January 2021, respectively. The Deanship of Academic Research at the University of Jordan as the funding body, had no role in study design, data collection and analysis, decision to publish, or preparation of the manuscript.
Disclosure
The authors declare no competing interests.
References
1. Singer M, Deutschman CS, Seymour CW, et al. The third international consensus definitions for sepsis and septic shock (Sepsis-3). JAMA. 2016;315(8):801–810.
2. Charchaflieh J, Rushbrook J, Worah S, Zhang M. Activated complement factors as disease markers for sepsis. Dis Markers.2015;2015:407324.
3. Markiewski MM, DeAngelis RA, Lambris JD. Complexity of complement activation in sepsis. J Cell Mol Med. 2008;12(6A(6a):2245–2254. doi:10.1111/j.1582-4934.2008.00504.x
4. Li H, Chen J, Hu Y, Cai X, Zhang P. et al. Elevated serum C1q levelsin children with sepsis. Front Ped. 2021;9(324):619899.
5. De Pascale G, Cutuli SL, Pennisi MA, et al. The role of mannose-binding lectin in severe sepsis and septic shock. Mediators Inflamm. 2013;2013:625803. doi:10.1155/2013/625803
6. Lin RY, Astiz ME, Saxon JC, et al. Alterations in C3, C4, factor B, and related metabolites in septic shock. Clin Immunol Immunopathol. 1993;69(2):136–142. doi:10.1006/clin.1993.1161
7. Charchaflieh J, Wei J, Labaze G, et al. The role of complement system in septic shock. Clin Dev Immunol. 2012;2012:407324. doi:10.1155/2012/407324
8. Nakae H, Endo S, Inada K, et al. Chronological changes in the complement system in sepsis. Surg Today. 1996;26(4):225–229. doi:10.1007/BF00311579
9. Ward PA. The dark side of C5a in sepsis. Nat Rev Immunol. 2004;4(2):133–142. doi:10.1038/nri1269
10. Tegla CA, Cudrici C, Patel S, et al. Membrane attack by complement: the assembly and biology of terminal complement complexes. Immunol Res. 2011;51(1):45–60. doi:10.1007/s12026-011-8239-5
11. Dobrina A, Pausa M, Fischetti F, et al. Cytolytically inactive terminal complement complex causes transendothelial migration of polymorphonuclear leukocytes in vitro and in vivo. Blood. 2002;99(1):185–192. doi:10.1182/blood.V99.1.185
12. Schuerholz T, Leuwer M, Cobas-Meyer M, et al. Terminal complement complex in septic shock with capillary leakage: marker of complement activation? Eur J Anaesthesiol. 2005;22(7):541–547. doi:10.1017/S0265021505000931
13. Zipfel PF, Skerka CJNRI. Complement regulators and inhibitory proteins. Nat Rev Immunol. 2009;9(10):729–740. doi:10.1038/nri2620
14. Liszewski MK, Atkinson JPJ; The American Society of Hematology Education Program Book. Too much of a good thing at the site of tissue injury: the instructive example of the complement system predisposing to thrombotic microangiopathy. Hematol Am Soc Hematol Educ Prog Book. 2011;2011(1):9–14. doi:10.1182/asheducation-2011.1.9
15. Meri S, Morgan BP, Davies A, et al. Human protectin (CD59), an 18,000-20,000 MW complement lysis restricting factor, inhibits C5b-8 catalysed insertion of C9 into lipid bilayers. Immunology. 1990;71(1):1.
16. Meri S, Lehto T, Sutton CW, et al. Structural composition and functional characterization of soluble CD59: heterogeneity of the oligosaccharide and glycophosphoinositol (GPI) anchor revealed by laser-desorption mass spectrometric analysis. Biochem J. 1996;316(3):923–935. doi:10.1042/bj3160923
17. Ekdahl KN, Persson B, Mohlin C, et al. Interpretation of serological complement biomarkers in disease. Front Immunol. 2018;9:2237. doi:10.3389/fimmu.2018.02237
18. Mollnes TE, Huber-Lang M. Complement in sepsis—when science meets clinics. FEBS Lett. 2020;594(16):2621–2632. doi:10.1002/1873-3468.13881
19. Peate I, Wild K. Nursing Practice: Knowledge and Care. John Wiley & Sons; 2018.
20. Jarczak D, Kluge S, Nierhaus A. Sepsis—pathophysiology and therapeutic concepts. Front Med. 2021;8(609). doi:10.3389/fmed.2021.628302
21. Ward PA, Guo R-F, Riedemann NC. Manipulation of the complement system for benefit in sepsis. Crit Care Res Pract. 2012;2012:427607. doi:10.1155/2012/427607
22. Vincent JL, de Mendonca A, Cantraine F, et al. Use of the SOFA score to assess the incidence of organ dysfunction/failure in intensive care units: results of a multicenter, prospective study. Working group on “sepsis-related problems” of the European Society of Intensive Care Medicine. Crit Care Med. 1998;26(11):1793–1800. doi:10.1097/00003246-199811000-00016
23. Keshari RS, Silasi R, Popescu NI, et al. Inhibition of complement C5 protects against organ failure and reduces mortality in a baboon model of Escherichia coli sepsis. Proc Natl Acad Sci U S A. 2017;114(31):E6390–E6399. doi:10.1073/pnas.1706818114
24. Guo RF, Ward PA. C5a, a therapeutic target in sepsis. Recent Pat Antiinfect Drug Discov. 2006;1(1):57–65. doi:10.2174/157489106775244091
25. Abe T, Kubo K, Izumoto S, et al. Complement activation in human sepsis is related to sepsis-induced disseminated intravascular coagulation. Shock. 2020;54(2):198–204. doi:10.1097/SHK.0000000000001504
26. Parsons PE, Giclas PC. The Terminal Complement Complex (sC5b-9) is not specifically associated with the development of the adult respiratory distress syndrome. Am Rev Respir Dis. 1990;141(1):98–103. doi:10.1164/ajrccm/141.1.98
27. Müller GA. The release of glycosylphosphatidylinositol-anchored proteins from the cell surface. Arch Biochem Biophys. 2018;656:1–18. doi:10.1016/j.abb.2018.08.009
28. Murao A, Brenner M, Aziz M, et al. Exosomes in Sepsis. Front Immunol. 2020;11:2140. doi:10.3389/fimmu.2020.02140
29. Lindström O, Jarva H, Meri S, et al. Elevated levels of the complement regulator protein CD59 in severe acute pancreatitis. Scand J Gastroenterol. 2008;43(3):350–355. doi:10.1080/00365520701763209
30. Bhatia M, Wong FL, Cao Y, et al. Pathophysiology of acute pancreatitis. Pancreatology. 2005;5(2):132–144. doi:10.1159/000085265
31. Väkevä A, Lehto T, Takala A, et al. Detection of a soluble form of the complement membrane attack complex inhibitor CD59 in plasma after acute myocardial infarction. Scand J Immunol. 2000;52(4):411–414. doi:10.1046/j.1365-3083.2000.00783.x
32. Ohtani K. Complement-related proteins and their measurements: the current status of clinical investigation. Nephron. 2020;144(suppl 1):7–12. doi:10.1159/000512494
 © 2022 The Author(s). This work is published and licensed by Dove Medical Press Limited. The
full terms of this license are available at https://www.dovepress.com/terms
and incorporate the Creative Commons Attribution
- Non Commercial (unported, 3.0) License.
By accessing the work you hereby accept the Terms. Non-commercial uses of the work are permitted
without any further permission from Dove Medical Press Limited, provided the work is properly
attributed. For permission for commercial use of this work, please see paragraphs 4.2 and 5 of our Terms.
© 2022 The Author(s). This work is published and licensed by Dove Medical Press Limited. The
full terms of this license are available at https://www.dovepress.com/terms
and incorporate the Creative Commons Attribution
- Non Commercial (unported, 3.0) License.
By accessing the work you hereby accept the Terms. Non-commercial uses of the work are permitted
without any further permission from Dove Medical Press Limited, provided the work is properly
attributed. For permission for commercial use of this work, please see paragraphs 4.2 and 5 of our Terms.