Back to Journals » Diabetes, Metabolic Syndrome and Obesity » Volume 19
Competing Risks Analysis for Neutrophil to Lymphocyte Ratio as a Predictor of Diabetic Nephropathy Incidence
Authors Song X, Dong W ![]() , Fu Y, Wang J, Wang J
, Fu Y, Wang J, Wang J
Received 20 October 2025
Accepted for publication 16 January 2026
Published 18 February 2026 Volume 2026:19 570594
DOI https://doi.org/10.2147/DMSO.S570594
Checked for plagiarism Yes
Review by Single anonymous peer review
Peer reviewer comments 5
Editor who approved publication: Dr Rebecca Baqiyyah Conway
Xiaoyi Song,1,2,* Wenrui Dong,1,2,* Yuhao Fu,1,3 Jiaqiang Wang,1 Jiajia Wang1,4
1Department of Laboratory Medicine, Sichuan Provincial People’s Hospital, University of Electronic Science and Technology of China, Chengdu, People’s Republic of China; 2School of Medicine, University of Electronic Science and Technology of China, Chengdu, People’s Republic of China; 3School of Medicine, Chengdu University of Traditional Chinese Medicine, Chengdu, People’s Republic of China; 4Department of Laboratory Medicine, Sichuan Provincial People’s Hospital Chuandong Hospital & Dazhou First People’s Hospital, Dazhou, People’s Republic of China
*These authors contributed equally to this work
Correspondence: Jiajia Wang, Department of Laboratory Medicine, Sichuan Provincial People’s Hospital, No. 32, West Section 2, 1st Ring Road, Chengdu, Sichuan, 610072, People’s Republic of China, Tel +86-28-87394446, Email [email protected]
Purpose: Diabetic nephropathy (DN) is a serious complication of diabetes mellitus. A high level of neutrophil-lymphocyte ratio (NLR) is an indicator of abnormal immune system activity which may serve as an effective potential inflammatory marker for identifying the risk of DN. This study aimed to investigate the relationship between neutrophil-lymphocyte ratio (NLR) and the incidence of DN in type 2 diabetes mellitus (T2DM) patients.
Patients and Methods: DN incidence was defined as the time from baseline diabetes diagnosis to first DN occurrence (KDIGO CKD criteria). NLR’s effect and interactions were evaluated using covariate-adjusted competing risks regression (death as competing event). The optimal NLR cut-point for DN prediction was determined by ROC analysis. The Fine and Gray subdistribution hazard model assessed NLR’s effect on DN incidence, with subdistribution hazard ratios (sHR) validated via bootstrap sampling. The final sample consisted of the records of 220 individuals (median age 64 years (IQR: 55– 72)) with T2DM with complete covariates information which were available for incidence analysis with NLR.
Results: Among 220 T2DM patients with complete covariates, 133 (60.45%) developed DN at 6 years, 20 (9.10%) were lost to competing events, and 67 remained DN-free. Median NLR was 2.4 (IQR: 1.8– 3.3), positively correlating with urinary albumin-to-creatinine ratio and negatively with the estimated glomerular filtration rate (eGFR) (p< 0.01). ROC analysis demonstrated diagnostic value for DN (AUC=0.772; 95% CI: 0.708, 0.836; p< 0.01), with optimal cut-off at 3.02. NLR showed associations with DN in cause-specific (CSH=1.66; 95% CI: 1.13, 2.52) and FGR models (sHR=2.26; 95% CI: 1.72, 2.92). Bootstrap validation yielded consistent results (sHR= 2.36; 95% CI: 1.76, 3.02). Notably, NLR better predicts DN risk in older adults (> 65 years) and those with well-controlled HbA1c (≤ 7.5%).
Conclusion: NLR shows promise for predicting DN incidence in Chinese patients, especially those > 65 years or with good glycemic control.
Keywords: diabetic nephropathy, neutrophil-lymphocyte ratio, competing risks, subdistribution hazard ratio, cause-specific hazard ratio
Introduction
Diabetes mellitus (DM) is a chronic metabolic disorder of global concern, with its rising prevalence contributing to an increased burden of diabetic nephropathy (DN), the major microvascular complication of DM.1,2 DN affects approximately 30–40% of patients with T2DM, representing the leading cause of End-Stage Kidney Disease globally. Even in its early stages, DN heightens susceptibility to cardiovascular morbidity and infections,3,4 highlighting the urgent need for early detection and intervention. Unlike T1DM, where renal injury is primarily driven by hyperglycemia, T2DM-associated nephropathy is a heterogeneous condition often compounded by metabolic syndrome, hypertension, and chronic low-grade inflammation.3 Established risk factors for DN include chronic inflammation, obesity, hypertension, smoking, and sex differences,5,6 with systemic inflammation and oxidative stress playing central roles in disease progression.7–9
Given its modifiable nature, systemic inflammation presents a promising target for DN prevention. Elevated levels of pro-inflammatory enzymes, cytokines, and dysregulated signaling pathways have been epidemiologically associated with DN onset and progression.5,10–12 However, the precise mechanistic role of inflammation in DN risk remains incompletely understood. While inflammatory biomarkers hold potential for risk stratification, their clinical utility has been limited by high costs and technical challenges. In contrast, the neutrophil-to-lymphocyte ratio (NLR), a cost-effective and routinely measured hematologic parameter, serves as a practical surrogate for systemic inflammation in DM.13 In T2DM, hyperglycemia abnormally activates neutrophils, causing them to release ROS, inflammatory cytokines, and enzymes that damage renal structures. Neutrophils also form NETs, which worsen endothelial injury and microthrombosis. At the same time, reduced lymphocyte-mediated regulation leads to excessive inflammation. While some lymphocytes (Th1/Th17) are pro-inflammatory, the lymphopenia in NLR generally reflects a decrease in the protective and regulatory capacity (specifically Tregs) and an increase in systemic stress-induced apoptosis.14 An elevated NLR reflects immune dysregulation and may serve as an effective tool for stratifying DN risk.13,15,16
Recent systematic reviews and meta-analyses have substantiated the potential of NLR as a biomarker for diabetic complications. A 2025 meta-analysis by Leucuța et al17 involving over 13,000 patients demonstrated that elevated NLR is significantly associated with higher odds of DN (OR = 1.84). However, current evidence linking NLR to DN primarily stems from cross-sectional studies, suggesting its diagnostic rather than prognostic utility. While some longitudinal observations have indicated that NLR tracks with worsening renal function, these studies often utilized standard survival models that treat death as a censoring event.18 To our knowledge, no longitudinal studies have examined the association between NLR and DN incidence within a competing risks framework, nor have temporal interactions between NLR and established risk factors (HbA1c, UACR, eGFR, and age) been thoroughly investigated. This gap in research underscores the need for prospective studies to evaluate NLR’s true predictive capacity for DN development while accounting for the competing risk of mortality.
Our study aims to address this by assessing whether NLR, as an accessible and inexpensive biomarker, can enhance early DN risk prediction, potentially informing clinical strategies for timely intervention and improved patient outcomes. By exploring dynamic interactions between NLR and metabolic parameters over time, this research may provide novel insights into the inflammatory mechanisms driving DN progression.
Patients and Methods
Study Design
To determine the efficacy of NLR in predicting DN onset, a retrospective analysis was done using medical records from Sichuan Province People’s Hospital patients—all clinically diagnosed with T2DM—including 268 T2DM patients with their relevant clinical covariates incorporated. The final analytical cohort was refined to 220 patients to ensure data quality, as we excluded 48 individuals who lacked complete data for all necessary covariates. DN incidence was the interval from baseline T2DM diagnosis to first confirmed DN (per KDIGO CKD guidelines),19 identified via two positive lab results (≥90 days apart) or an administrative code, with low eGFR (< 60 mL/min/1.73 m2) or albuminuria (UACR≥ 30 mg/g) as positive criteria for T2DM patients; study duration spanned from baseline T2DM diagnosis to last follow-up, follow-up end, or death, and a competing-risks survival model (adjusted for other risk factors) was used to evaluate NLR’s impact on DN incidence, additionally, individuals with baseline NLR > 30 were excluded to avoid extraneous effects on NLR measurements. The study protocol was approved by Sichuan Province People’s Hospital’s Ethics Committee, and all participants provided written informed consent prior to enrollment.
Clinical Covariates
We collected overnight fasting blood samples (requiring at least 8 hours of fasting) between 6:00 and 9:00 a.m., then refrigerated them right away before sending to a central laboratory for testing within two hours. For each patient, we assessed at least two consecutive blood tests and calculated their results using a weighted average, we also checked the consistency of recorded parameters to rule out any irregular values. To calculate NLR, we pulled neutrophil and lymphocyte counts from each patient’s haematology records, then computed this ratio as the absolute neutrophil count divided by the absolute lymphocyte count. We pulled the clinical variables used as covariates from haematology, demography, and biochemistry records through electronic linkage—specifically age at T2DM diagnosis, sex, HbA1c, fasting glucose, urine albumin, triglycerides, spot urine creatinine levels, eGFR, high-density lipoprotein cholesterol (HDL-c), and non-high-density lipoprotein cholesterol (non-HDL-c). Information regarding specific antidiabetic regimens (oral hypoglycemic agents or insulin) was recorded; however, due to the high heterogeneity of treatment modifications over the 6-year follow-up, baseline metabolic control (HbA1c) was used as the primary indicator of metabolic status. We did not impute any covariate values in this analysis. We summarized all baseline biochemical parameters as median values from the first 1–3 readings per participant (depending on which set of readings was most complete) that we collected within 12 months before or after their diabetes diagnosis. We excluded any NLR readings taken after a diagnosis of malignancy (or the related treatment for it), infectious diseases, acute coronary artery disease, haematologic disorders, or diseases that impact urinary protein excretion. If we took multiple NLR readings within a 28-day window, we only included the first one from that period in the analysis.
Statistical Analysis
Competing risks are events getting in the way of observing the main event we care about, and they break the assumption of regular survival analysis. The competing event was defined as all-cause mortality occurring before the diagnosis of Diabetic Nephropathy. Since death precludes the occurrence of DN, these events were treated as competing risks rather than simple censorship to avoid overestimating the cumulative incidence of DN.20,21 Take DN as an example: an individual with diabetes who presents elevated levels of risk factors such as HbA1c will exhibit an increased likelihood of developing DN.22 To address this competing risk scenario, two widely adopted approaches, cause-specific hazard (CSH) and the Fine and Gray subdistribution hazard model (FGR) are employed to model the influence of covariates on the time-based outcome.23–25 The CSH model estimates the direct effect of covariates on DN incidence by treating competing events as censored observations. In contrast, the FGR model retains individuals with competing events in the risk set, assigning weights based on their event times and censoring distribution.26,27
For univariate analysis, continuous variables were presented as mean± SD, while discrete variables were reported as frequencies (percentages). To evaluate the independent prognostic value of NLR, multivariate models were constructed. In these models, potential confounders including age, HbA1c, eGFR, UACR, and lipid levels were entered as continuous variables to minimize residual confounding and preserve information. Sex was included as a binary categorical variable. Hazard ratios for continuous variables with wide ranges (eGFR, UACR) were reported per 10-unit increase for clinical interpretability. The primary predictor NLR was evaluated both as a continuous and a categorical variable—first in quartiles for a sensitivity analysis to assess the robustness of our results, and subsequently as a binary variable based on an optimal cut-point derived from receiver operating characteristic (ROC) curve analysis for predicting DN.28 Additionally, NLR was utilized as a categorical variable in both FGR and CSH models, integrated into backward stepwise competing risk models using the aforementioned cut-off. The CSH model estimates the direct effect of covariates on the hazard of DN in event-free subjects, treating competing events as censored observations. In contrast, the FGR model, which retains subjects experiencing competing events in the risk set with inverse probability weighting, is more suited for absolute risk prediction as it quantifies effects on the cumulative incidence function.29 1000 times bootstrap sampling was applied to test the sHR of the model.
A follow-up duration of six years was stipulated for all endpoints. Potential effect modification was tested by incorporating product interaction terms between NLR and key clinical variables (age, HbA1c, UACR, eGFR). The estimated cumulative incidence of DN derived from the FGR model was utilized to visualize the joint risk associated with varying NLR levels across different strata of the interacting covariates. A two-sided p-value < 0.05 defined statistical significance. All statistical analyses were performed with R (version4.4.2) software and associated packages.30
Results
Selection of Study Participants
The cohort derivation process is detailed in Supplementary Figure S1. Briefly, from an initial pool of 369 individuals with diabetes, 101 participants were excluded (51 individuals had no T2DM diagnosis date, and 50 participants had a date mismatch). Among these individuals, 268 in total had both their diabetes diagnosis dates and censoring time information-which includes the date they left the data catchment area, death, event date or end of the follow-up period (Supplementary Figure S2). The final analytical cohort comprised 220 individuals with T2DM who had complete data for all covariates, including NLR, and were thus eligible for incidence analysis (Supplementary Figure S3).
Association of NLR with Baseline Covariates and DN Prediction
The median follow-up time for the cohort of 220 participants was 1.38 years, within a maximum follow-up of 6 years. Over this period, the cumulative incidence of DN was 60.45% (n=133), while competing events occurred in 9.10% (n=20) of the cohort, resulting in a combined event rate of 69.55%. The demographic and clinical characteristics of the participants are provided in Table 1. The overall median NLR was 2.4 (IQR: 1.8–3.3). Notably, patients who progressed to DN had a significantly higher median NLR at diabetes diagnosis (2.7; IQR: 2.0–4.1) than those who remained event-free (2.5; IQR: 1.7–3.8; p < 0.01) (Supplementary Table S1). The Pearson correlation of NLR with other clinical covariates at baseline was shown in Figure 1a. Consistent with these findings, the FGR model, which formally accounted for competing risks, estimated the 6-year cumulative incidence of DN and competing events at 60.45% and 9.10%, respectively.
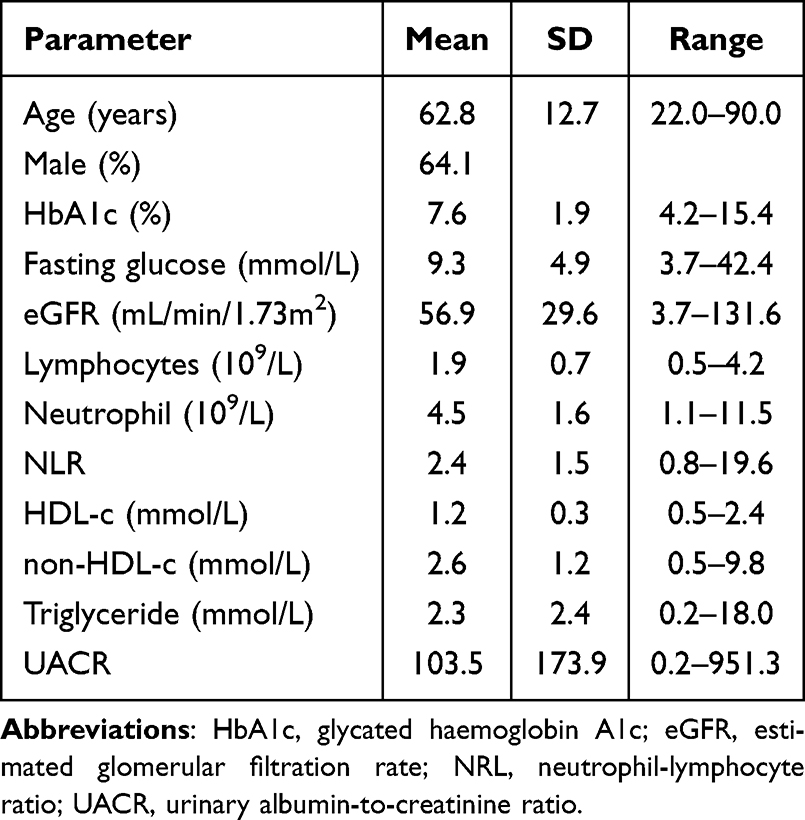 |
Table 1 Demographic and Clinical Characteristics of Participants at Baseline (n = 220) |
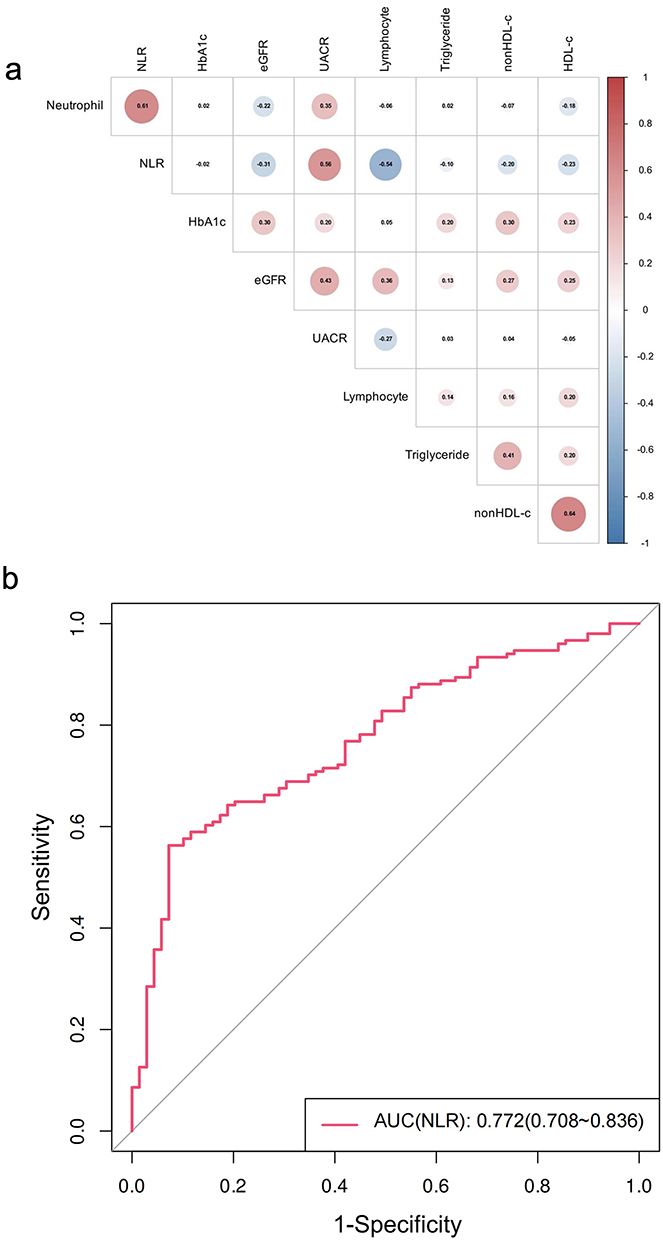 |
Figure 1 Association of NLR with baseline covariates and DN prediction. (a) Correlation heatmap of NLR with clinical/demographic factors. (b) ROC curve evaluating NLR’s discriminative ability for DN. |
The optimal NLR cut-off value for predicting the incidence of kidney disease was determined through the ROC curve, which is 3.016 (Figure 1b). The AUC value of the time-dependent ROC curve increased over time (Supplementary Figure S4). NLR above 3.016 was coded as high and risks were estimated based on this cut-off.
Estimates from the Competing Risk Models of Incident DN
We looked at the quartile-specific risk of DN connected to higher NLR levels using the CSH model. Q1 means the first quartile, while Q4 refered to the highest quartile. If we check the unadjusted cumulative incidence plot in Figure 2a, we will see DN incidence hazard rises as NLR quartiles increase—Q3 and Q4 come with much greater risk than Q1. We then adjusted the crude effects of these quartiles for all covariates, along with interaction terms between NLR quartiles and factors like age, HbA1c, UACR, and eGFR. We could clearly see a dose-response relationship: each step up in NLR quartile was linked to a greater hazard for DN incidence. When we looked at people in the higher NLR quartile, their CSH was 1.63 (95% CI: 0.94, 3.19, p<0.01) versus the reference group—which was the lowest quartile (Figure 2b). The interaction terms between NLR quartiles and UACR, HbA1c, age, as well as UACR remained significant in both models. Plots showing event-free survival (EFS) and cumulative incidence function (CIF) for covariates can be found in Supplementary Figures S5 and S6. Overall, 88 individuals (44%) had high NLR levels (>3.016). Table 2 presents the multivariate analysis results for the CSH and FGR models, focusing on 6-year DN incidence. Both models showed that people with higher NLR levels have an increased risk of DN. The estimated hazard ratio for the CSH model came to 1.66 (95% CI: 1.13, 2.52, p<0.001), and the FGR model’s sHR was 2.26 (95% CI: 1.72, 2.92, p<0.001). We turned to bootstrap sampling (Supplementary Figure S7) to check the model’s sub-distribution hazard ratio (sHR), and the outcome here was an sHR of 2.36 (95% CI: 1.76, 3.02).
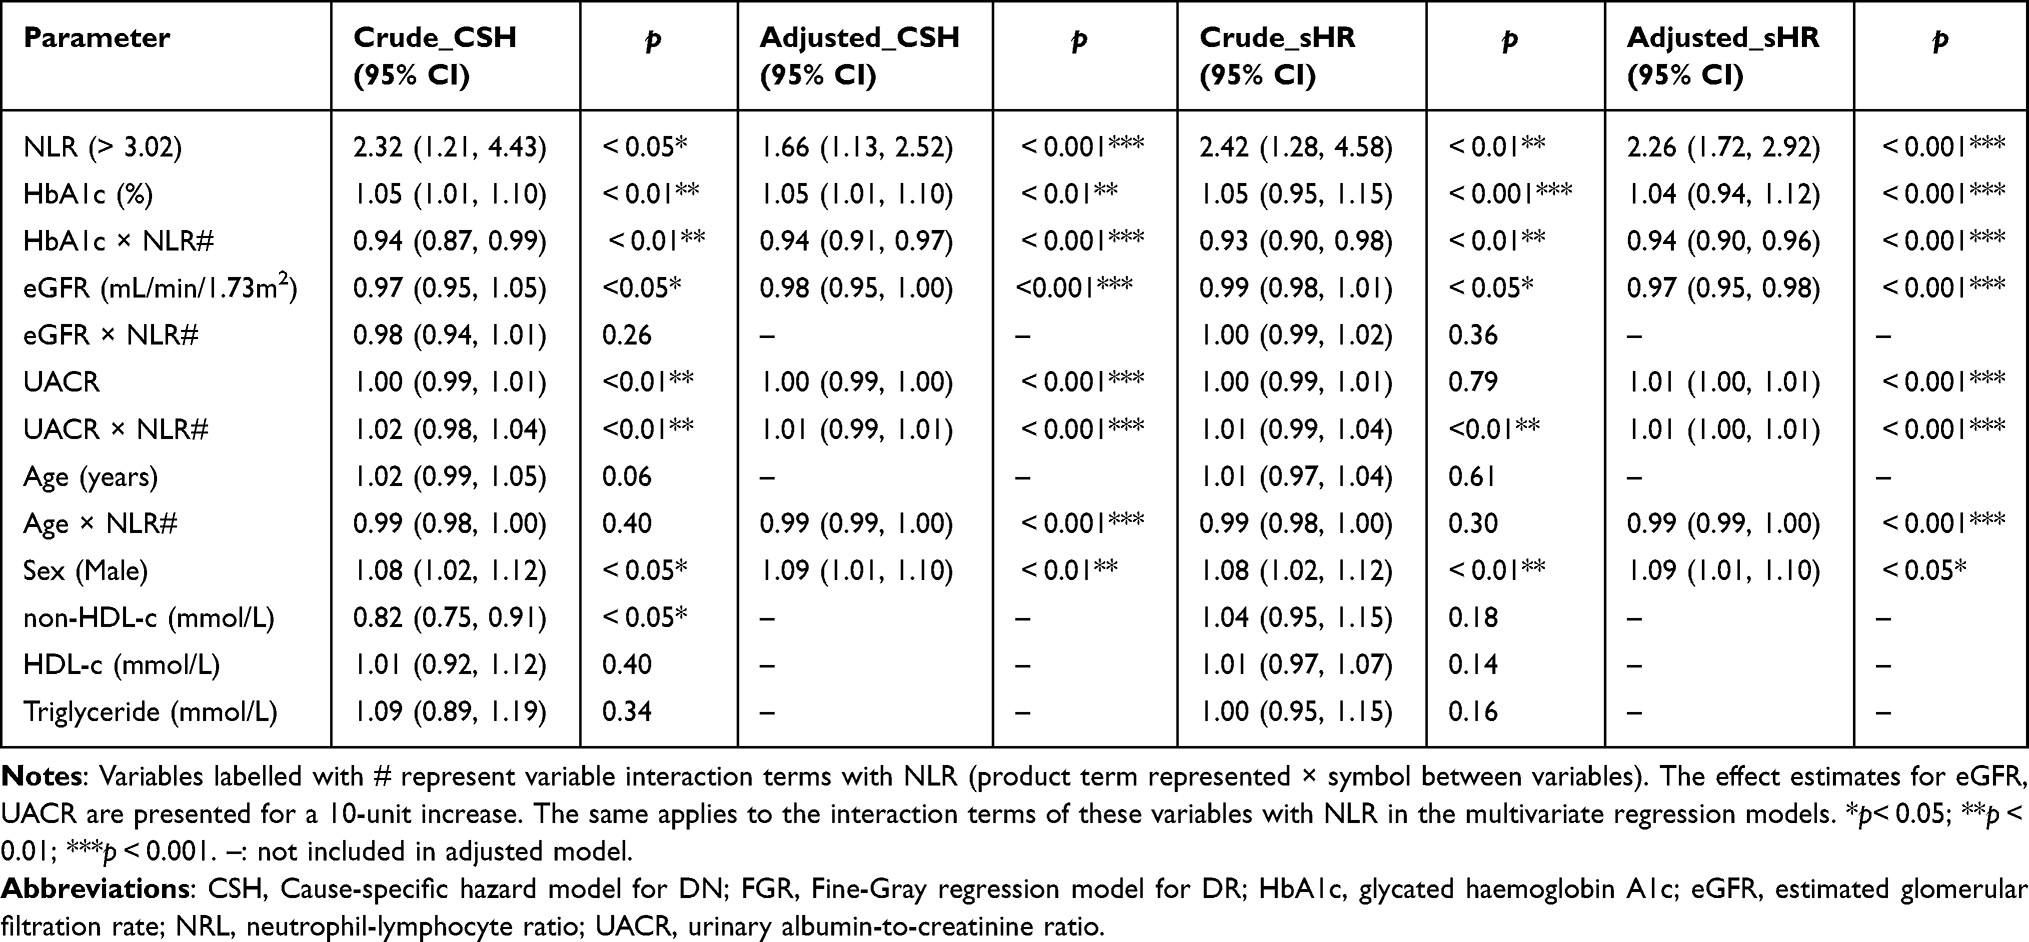 |
Table 2 Evaluation of DN Incidence Over a 6-year Period Using the CSH Regression and FGR Models (n=220) |
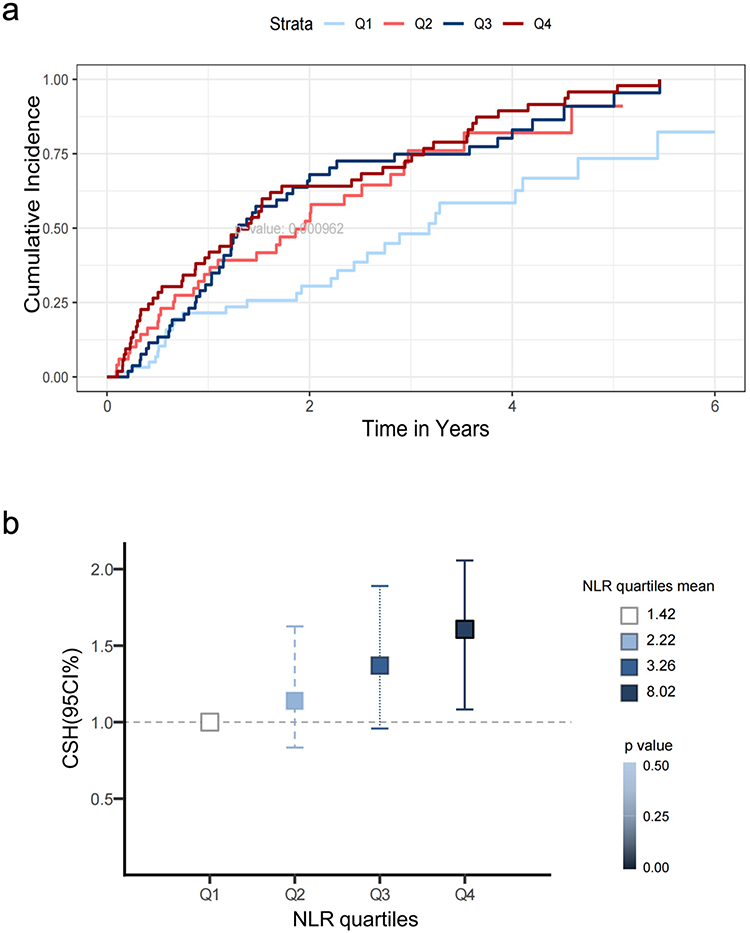 |
Figure 2 Risk of DN stratified by NLR quartiles. (a) Unadjusted 6-year cumulative incidence of DN across NLR quartiles (Q1-Q4). (b) Adjusted hazard ratios (HRs) for DN from the CSH model, with Q1 as reference. The model was adjusted for age, sex, HbA1c, eGFR, UACR, HDL-c, non-HDL-c, triglycerides, and interaction terms between NLR quartiles and age/eGFR/UACR/HbA1c. Quartile cutoffs: Q1 (1.42), Q2 (2.22), Q3 (3.26), Q4 (8.02). Error bars represent 95% confidence intervals. Q1 is the reference category,Q2: HR=1.12; Q3: HR=1.35; Q4: HR=1.63. |
Subgroup Analysis and Effect Modification
We found the interaction terms between NLR and HbA1c, UACR, eGFR, or age to be significant in both models. What this told us was that there was clear proof HbA1c, UACR, eGFR, and age can change how NLR affect predicted DN risk. To make this easier for readers to follow, we added extra details on how NLR predicts DN risk across different strata of HbA1c, UACR, eGFR, and age rather than only offering a simple average CSH or sHR point estimate (Figure 3). Information on UACR and eGFR can be found in Supplementary Figure S8. If we dig a bit deeper into the results, Figure 3 shows that for age groups, the third quartile (with an average age of 69.56) and fourth quartile (average age 79.68) were more sensitive to DN risk than the first quartile (average age 48.23) and second quartile (average age 62.14). We also observed that subjects with a specific NLR level, along with HbA1c levels in the first, second, or third quartile, had a higher chance of getting DN compared to those in the fourth quartile.
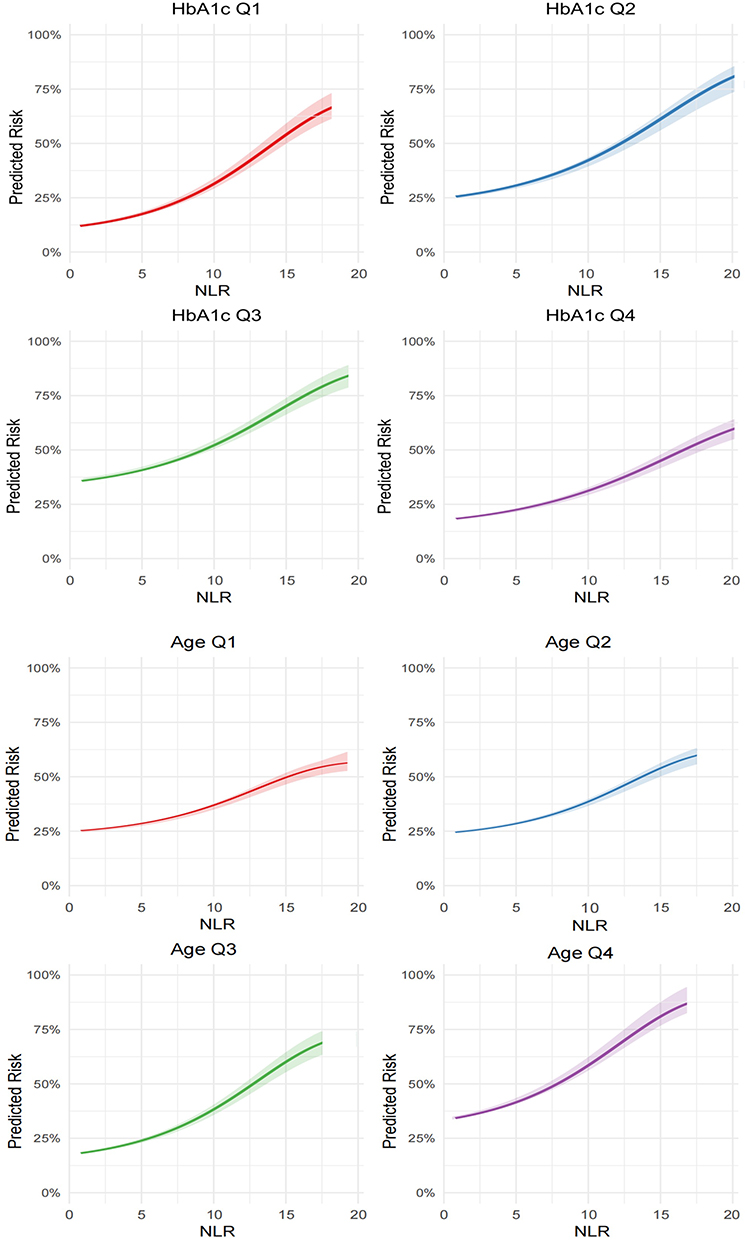 |
Figure 3 Predicted risk of DN by NLR, stratified by HbA1c and age quartiles. Risk estimates were derived from a covariate-adjusted Fine-Gray regression (FGR) model, with the highest quartile (Q4) representing elevated HbA1c or older age. Individual predicted risks were computed and plotted against NLR values for each HbA1c and age quartile. The curves illustrate the model-predicted increase in DN risk per unit rise in NLR, with slope steepness reflecting risk acceleration. |
Discussion
While numerous studies have established a correlation between elevated NLR and Diabetic Nephropathy, the majority have relied on cross-sectional designs or standard Cox proportional hazards models.18,21,31 Our study diverges from these by implementing a Competing Risks Framework. In populations with Type 2 Diabetes, mortality is a significant competing event that precludes the occurrence of DN. Standard survival analyses often treat death as a censoring event, which introduces bias and overestimates the absolute risk of nephropathy. By utilizing the FGR and CSH model, we have established a significant correlation between NLR levels at the time of diabetes diagnosis and the risk of developing nephropathy over a 6-year timeframe. The findings highlight NLR’s potential as an inflammatory biomarker in longitudinal risk assessment. Given that NLR is a predictor of overall vascular morbidity and mortality, and considering nephropathy as a “survivor” phenotype, we employed both standard and “competing risk” methodologies to verify that this correlation is not confounded by the overall effects on mortality. Both models offer critical insights into causality and predictive outcomes and hence were reported in this study.
The central finding of this study is the robust association between elevated NLR (>3.02) and increased DN incidence over a 6-year follow-up period. This threshold aligns with previous findings, such as those by Chittawar et al (cutoff 2.0) and Khandare et al (cutoff NLR 2.83).18 The adjusted subdistribution hazard ratio (sHR=2.26) and cause-specific hazard ratio (CSH=1.66) highlight NLR’s independent predictive value even after accounting for competing mortality and traditional risk factors such as HbA1c, age, UACR. This extends prior cross-sectional studies,16 which primarily focused on NLR’s diagnostic utility, by demonstrating its prognostic significance in a longitudinal cohort.
Due to the small sample size, bootstrap sampling was applied to test the sub-distribution hazard ratio (sHR) of the model. The results showed that the sHR was 2.36, indicating that the original effect size was robust. Notably, the interaction analyses revealed that NLR’s predictive capacity is modulated by HbA1c and renal dysfunction markers (UACR, eGFR), with stronger associations observed in older patients (>65 years) and those with well-controlled HbA1c (<7.5%). In addition, the ROC curve showed that these NLR had diagnostic value for DN. At an NLR >3.02, it should be considered that patients with T2DM may develop DN. These findings align with emerging evidence that inflammation-driven pathways are particularly detrimental in early-stage DN, where timely intervention could mitigate progression.32–34 By employing Fine-Gray competing risk models, this study avoids overestimating DN incidence-a common pitfall in conventional survival analyses when competing events are frequent.29
Cumulative evidence has indicated that chronic inflammation exerts a pivotal role in DN and that inflammatory indicators could aid in the disease’s diagnosis and prognostic evaluation31,35 Elevated NLR signifies a pathological imbalance: a dominance of destructive innate immunity (neutrophil-mediated oxidative injury) coupled with a failure of adaptive anti-inflammatory regulation (lymphocyte depletion), creating a perfect storm for rapid renal decline.36 Neutrophils exacerbate renal injury by releasing reactive oxygen species (ROS) and pro-inflammatory cytokines, triggering endothelial dysfunction, podocyte injury, and thickening of the glomerular basement membrane, directly accelerating renal fibrosis. Conversely, the lymphocyte component of the NLR reflects the body’s physiological stress and regulatory capacity.Oxidative stress induced by hyperglycemia triggers mitochondrial apoptosis in lymphocytes, leading to lymphopenia. Furthermore, DN progression is associated with a specific depletion of Tregs, which are essential for suppressing excessive immune responses.37,38 Our findings further indicate that NLR positively correlates with UACR and inversely correlates with eGFR, suggesting inflammation-driven proteinuria and renal dysfunction. Elevated UACR reflects damage to the glomerular filtration barrier and is an early marker of DN, consistent with previous research.39
The positive correlation between NLR and UACR indicates that inflammation accelerates kidney damage. A decline in eGFR reflects the progressive loss of renal function. The negative correlation between NLR and eGFR is due to the mechanism that chronic inflammation speeds up renal fibrosis and reduces the kidney’s repair ability. The interaction between HbA1c and NLR (sHR=1.04) implies hyperglycemia amplifies inflammatory renal damage, consistent with mechanisms involving advanced glycation end-products (AGEs) and pro-inflammatory pathway activation.40 These mechanisms collectively position NLR as a integrative marker of inflammatory burden and metabolic dysregulation in DN.
The associations between inflammatory markers and DN have been examined in several prior research. In a study conducted by Li et al, NLR levels were shown to exhibit a positive correlation with UACR levels and DN prevalence among diabetic patients in the US.41 Among the Japanese diabetic population, albuminuria prevalence was found to rise in tandem with elevated NLR levels.16 In an investigation of diabetic individuals in Syria, NLR has been identified as a significant risk factor for albuminuria prediction.42 Furthermore, the predictive utility of NLR for early-stage DN were validated by prospective investigations.43,44 Our study align with previous researches, indicates that NLR is a valid and potent predictor for early-phase progression.
Notably, in addition to the influence exerted by the NLR, the observed increasing levels of non-HDL-c demonstrated a potential protective effect against DN within the CSH model, yet this effect failed to achieve statistical significance when analyzed using the FGR model, thus highlighting the imperative need for validation through larger scale datasets. Our findings align with those revealed by Lou et al, indicating that lipids may play a minor role in the incidence of DN.45
It is crucial to benchmark the predictive performance of NLR against established and novel renal biomarkers. While UACR and eGFR remain the gold standards for diagnosing established nephropathy—often demonstrating higher diagnostic sensitivity for structural damage—they may not fully capture the early systemic inflammatory drive that precedes microvascular injury. Our findings indicate that NLR provides complementary prognostic information distinct from these hemodynamic markers. In terms of discriminative ability, our model’s performance aligns with or exceeds that of other hematological indices; for instance, recent meta-analyses have shown NLR to possess a higher area under the curve (AUC) for predicting diabetic kidney disease compared to the Platelet-Lymphocyte Ratio (PLR) or neutrophil count alone. Furthermore, unlike emerging biomarkers such as Kidney Injury Molecule-1 (KIM-1) or Neutrophil Gelatinase-Associated Lipocalin (NGAL)—which require expensive, specialized assays—NLR is derived from the routine complete blood count (CBC). As a standard and economical biomarker obtained from complete blood counts, the NLR provides practical benefits for clinical application. Its diagnostic efficacy for DN (AUC=0.772) exceeds that of conventional indicators such as high-sensitivity c-reactive protein (hs-CRP; AUC≈0.65), validating its utility in the early detection of DN. For medical professionals, incorporating NLR into established risk assessment tools like the KDIGO CKD risk categories could improve the identification of individuals at high risk. An increasing number of studies have shown that anti- inflammatory therapy will play an important role in the management of DN in the future. In the future, it is necessary to further explore the potential of NLR in guiding anti- inflammatory therapy for DN.46 For those at high risk (NLR >3.02, age >65 years, and HbA1c<7.5%), more frequent renal monitoring, including quarterly urine UACR and estimated glomerular filtration rate (eGFR) measurements, alongside early anti-inflammatory treatments such as Sodium-Glucose Cotransporter 2 (SGLT2) inhibitors or Glucagon-Like Peptide-1 (GLP-1) receptor agonists, may help to slow the progression of DN.47,48
While this study offers novel insights there are several limitations that need to be recognized. The single-center retrospective design and limited sample size may introduce selection bias. To validate these findings across diverse populations, it is essential to conduct larger-scale multi-center cohort studies. While NLR captures the cellular inflammatory response (neutrophil-mediated damage versus lymphocyte regulation), markers such as C-Reactive Protein (CRP) and Interleukin-6 (IL-6) reflect the humoral inflammatory cascade. A multi-marker approach combining NLR with CRP and IL-6 would theoretically enhance predictive accuracy by capturing distinct axes of the immune response. Although our retrospective design limited our ability to include routine cytokine data, future prospective studies should integrate these humoral markers with NLR to construct a comprehensive immuno-metabolic risk score In addition, the median follow-up duration of 1.38 years limits the assessment of long-term predictive validity. Finally, unmeasured confounding factors such as Body Mass Index (BMI), Systolic Blood Pressure (SBP), Diastolic Blood Pressure (DBP) may influence the observed associations. Future multi-center prospective cohorts should integrate multiomics approaches, such as single-cell sequencing, to clarify the role of NLR in renal inflammation and develop comprehensive risk models that combine NLR, HbA1c, and other risk factors. Another notable analytical avenue could involve joint modelling centered on the association between DN and NLR longitudinal values. We propose validating our findings across multiple ethnicities by employing a considerably larger sample size—this secures adequate statistical power to detect biologically relevant interaction effects.
In summary, this study establishes NLR as an independent predictor of DN incidence in T2DM patients, particularly in older individuals and those with controlled glycemia. By employing competing risk methodologies, we circumvent biases inherent to traditional survival analyses and provide a robust framework for DN risk assessment. These findings underscore the importance of systemic inflammation in DN pathogenesis and advocate for NLR’s integration into routine clinical practice to enable early, personalized interventions. Future research should focus on validating these results in larger cohorts and exploring NLR’s therapeutic implications.
Data Sharing Statement
The data that support the findings of this study are available within the article and its Supplementary Materials. Additional raw data are available from the corresponding author Jiajia Wang upon reasonable request.
Ethics Approval and Consent to Participate
This study was approved by the local ethical committee of Sichuan Provincial People’s Hospital (approval number: 2022-176). The study was conducted in accordance with the Declaration of Helsinki.
Acknowledgments
The authors thank all patients for participating in this study. The authors also thank Tongdan Zou providing extensive language revision to the manuscript.
Author Contributions
All authors have made substantial contributions to the work and approved the final version to be published. All authors have agreed on the journal to which the article has been submitted and agree to be accountable for all aspects of the work. The individual contributions are as follows, using the CRediT taxonomy: Xiaoyi Song: Conceptualization, Methodology, Writing – Original Draft, Visualization, Writing – Review & Editing. Wenrui Dong: Writing – Original Draft, Visualization, Writing – Review & Editing. Yuhao Fu: Writing – Original Draft, Formal analysis, Visualization, Writing – Review & Editing. Jiaqiang Wang: Resources, Data Curation, Writing – Original Draft. Jiajia Wang: Conceptualization, Methodology, Funding Acquisition,Writing – Review & Editing.
Funding
This study was supported by grants from the National Natural Science Foundation of China (No. 82102470), Sichuan Provincial Research Project Plan, China (No. S23025), Dazhou Science and Technology Program Project (No. 24YYJC0015), Chengdu Science and Technology Program Project (No. 2024-YF05-01751-SN).
Disclosure
The authors report no conflicts of interest in this work.
References
1. Alicic RZ, Rooney MT, Tuttle KR. Diabetic kidney disease: challenges, progress, and possibilities. Clin J Am Soc Nephrol. 2017;12(12):2032–13. doi:10.2215/CJN.11491116
2. Gupta S, Dominguez M, Golestaneh L. Diabetic kidney disease: an update. Med Clin North Am. 2023;107(4):689–705. doi:10.1016/j.mcna.2023.03.004
3. Di Marco M, Scilletta S, Miano N, et al. Cardiovascular risk and renal injury profile in subjects with type 2 diabetes and non-albuminuric diabetic kidney disease. Cardiovasc Diabetol. 2023;22(1):344. doi:10.1186/s12933-023-02065-2
4. Confederat LG, Condurache MI, Alexa RE, Dragostin OM. Particularities of urinary tract infections in diabetic patients: a concise review. Medicina. 2023;59(10):1747. doi:10.3390/medicina59101747
5. Tuttle KR, Agarwal R, Alpers CE, et al. Molecular mechanisms and therapeutic targets for diabetic kidney disease. Kidney Int. 2022;102(2):248–260. doi:10.1016/j.kint.2022.05.012
6. Chen J, Liu Q, He J, Li Y. Immune responses in diabetic nephropathy: pathogenic mechanisms and therapeutic target. Front Immunol. 2022;13:958790. doi:10.3389/fimmu.2022.958790
7. Yaribeygi H, Atkin SL, Sahebkar A. Interleukin-18 and diabetic nephropathy:A review. J Cell Physiol. 2019;234(5):5674–5682. doi:10.1002/jcp.27427
8. Tziomalos K, Athyros VG. Diabetic nephropathy: new risk factors and improvements in diagnosis. Rev Diabet Stud. 2015;12(1–2):110–118. doi:10.1900/RDS.2015.12.110
9. Matoba K, Takeda Y, Nagai Y, Kawanami D, Utsunomiya K, Nishimura R. Unraveling the role of inflammation in the pathogenesis of diabetic kidney disease. Int J Mol Sci. 2019;20(14):3393. doi:10.3390/ijms20143393
10. Brennan E, Kantharidis P, Cooper ME, Godson C. Pro-resolving lipid mediators: regulators of inflammation, metabolism and kidney function. Nat Rev Nephrol. 2021;17(11):725–739. doi:10.1038/s41581-021-00454-y
11. Cebeci E, Cakan C, Gursu M, et al. The main determinants of serum resistin level in type 2 diabetic patients are renal function and inflammation not presence of microvascular complication, obesity and insulin resistance. Exp Clin Endocrinol Diabetes. 2019;127(4):189–194. doi:10.1055/s-0043-121262
12. Jung SW, Moon JY. The role of inflammation in diabetic kidney disease. Korean J Intern Med. 2021;36(4):753–766. doi:10.3904/kjim.2021.174
13. Bilgin S, Aktas G, Zahid Kocak M, et al. Association between novel inflammatory markers derived from hemogram indices and metabolic parameters in type 2 diabetic men. Aging Male. 2020;23(5):923–927. doi:10.1080/13685538.2019.1632283
14. Wada J, Makino H. Innate immunity in diabetes and diabetic nephropathy. Nat Rev Nephrol. 2016;12(1):13–26. doi:10.1038/nrneph.2015.175
15. Dawood AF, Maarouf A, Alzamil NM, et al. Metformin is associated with the inhibition of renal artery AT1R/ET-1/iNOS axis in a rat model of diabetic nephropathy with suppression of inflammation and oxidative stress and kidney injury. Biomedicines. 2022;10(7):1644. doi:10.3390/biomedicines10071644
16. Kawamoto R, Ninomiya D, Kikuchi A, et al. Association of neutrophil-to-lymphocyte ratio with early renal dysfunction and albuminuria among diabetic patients. Int Urol Nephrol. 2019;51(3):483–490. doi:10.1007/s11255-018-02065-2
17. Leucuța DC, Fumeaux PA, Almășan O, Popa ȘL, Ismaiel A. Inflammatory markers as predictors of diabetic nephropathy in type 2 diabetes mellitus: a systematic review and meta-analysis. Medicina. 2025;61(2):216. doi:10.3390/medicina61020216
18. Khandare SA, Chittawar S, Nahar N, Dubey TN, Qureshi Z. Study of neutrophil-lymphocyte ratio as novel marker for diabetic nephropathy in type 2 diabetes. Indian J Endocrinol Metab. 2017;21(3):387–392. doi:10.4103/ijem.IJEM_476_16
19. Kidney Disease: Improving Global Outcomes (KDIGO) CKD Work Group. KDIGO 2024 clinical practice guideline for the evaluation and management of chronic kidney disease. Kidney Int. 2024;105(4S):S117–S314. doi:10.1016/j.kint.2023.10.018
20. Dignam JJ, Zhang Q, Kocherginsky M. The use and interpretation of competing risks regression models. Clin Cancer Res. 2012;18(8):2301–2308. doi:10.1158/1078-0432.CCR-11-2097
21. Gurmu MZ, Genet S, Gizaw ST, Feyisa TO, Gnanasekaran N. Neutrophil-lymphocyte ratio as an inflammatory biomarker of diabetic nephropathy among type 2 diabetes mellitus patients: a comparative cross-sectional study. SAGE Open Med. 2022;10:20503121221140231. doi:10.1177/20503121221140231
22. Jiang Y, Fine JP, Mottl AK. Competing risk of death with end-stage renal disease in diabetic kidney disease. Adv Chronic Kidney Dis. 2018;25(2):133–140. doi:10.1053/j.ackd.2018.01.008
23. Rajendrakumar AL, Hapca SM, Nair ATN, et al. Competing risks analysis for neutrophil to lymphocyte ratio as a predictor of diabetic retinopathy incidence in the Scottish population. BMC Med. 2023;21(1):304. doi:10.1186/s12916-023-02976-7
24. Austin PC, Fine JP. Practical recommendations for reporting Fine-Gray model analyses for competing risk data. Stat Med. 2017;36(27):4391–4400. doi:10.1002/sim.7501
25. Austin PC, Steyerberg EW, Putter H. Fine-Gray subdistribution hazard models to simultaneously estimate the absolute risk of different event types: cumulative total failure probability may exceed 1. Stat Med. 2021;40(19):4200–4212. doi:10.1002/sim.9023
26. Austin PC, Latouche A, Fine JP. A review of the use of time-varying covariates in the Fine-Gray subdistribution hazard competing risk regression model. Stat Med. 2020;39(2):103–113. doi:10.1002/sim.8399
27. Ohneberg K, Schumacher M, Beyersmann J. Modelling two cause-specific hazards of competing risks in one cumulative proportional odds model? Stat Med. 2017;36(27):4353–4363. doi:10.1002/sim.7437
28. Mandrekar JN. Receiver operating characteristic curve in diagnostic test assessment. J Thorac Oncol. 2010;5(9):1315–1316. doi:10.1097/JTO.0b013e3181ec173d
29. Putter H, Schumacher M, van Houwelingen HC. On the relation between the cause-specific hazard and the subdistribution rate for competing risks data: the Fine-Gray model revisited. Biom J. 2020;62(3):790–807. doi:10.1002/bimj.201800274
30. Perperoglou A, Sauerbrei W, Abrahamowicz M, Schmid M. A review of spline function procedures in R. BMC Med Res Methodol. 2019;19(1):46. doi:10.1186/s12874-019-0666-3
31. Zhang J, Zhang R, Wang Y, et al. Effects of neutrophil-lymphocyte ratio on renal function and histologic lesions in patients with diabetic nephropathy. Nephrology. 2019;24(11):1115–1121. doi:10.1111/nep.13517
32. Ferrucci L, Fabbri E. Inflammageing: chronic inflammation in ageing, cardiovascular disease, and frailty. Nat Rev Cardiol. 2018;15(9):505–522. doi:10.1038/s41569-018-0064-2
33. Tutan D, Doğan M. Evaluation of neutrophil/lymphocyte ratio, low-density lipoprotein/albumin ratio, and red cell distribution width/albumin ratio in the estimation of proteinuria in uncontrolled diabetic patients. Cureus. 2023;15(8):e44497. doi:10.7759/cureus.44497
34. Azab B, Daoud J, Naeem FB, et al. Neutrophil-to-lymphocyte ratio as a predictor of worsening renal function in diabetic patients (3-year follow-up study). Ren Fail. 2012;34(5):571–576. doi:10.3109/0886022X.2012.668741
35. Lin K, Lan Y, Wang A, Yan Y, Ge J. The association between a novel inflammatory biomarker, systemic inflammatory response index and the risk of diabetic cardiovascular complications. Nutr Metab Cardiovasc Dis. 2023;33(7):1389–1397. doi:10.1016/j.numecd.2023.03.013
36. Navarro JF, Mora C. Diabetes, inflammation, proinflammatory cytokines, and diabetic nephropathy. Sci World J. 2006;6:908–917. doi:10.1100/tsw.2006.179
37. Milas O, Gadalean F, Vlad A, et al. Pro-inflammatory cytokines are associated with podocyte damage and proximal tubular dysfunction in the early stage of diabetic kidney disease in type 2 diabetes mellitus patients. J Diabetes Complications. 2020;34(2):107479. doi:10.1016/j.jdiacomp.2019.107479
38. Liew PX, Kubes P. The Neutrophil’s role during health and disease. Physiol Rev. 2019;99(2):1223–1248. doi:10.1152/physrev.00012.2018
39. Nauta FL, Boertien WE, Bakker SJL, et al. Glomerular and tubular damage markers are elevated in patients with diabetes. Diabetes Care. 2011;34(4):975–981. doi:10.2337/dc10-1545
40. Mukai E, Fujimoto S, Inagaki N. Role of reactive oxygen species in glucose metabolism disorder in diabetic pancreatic β-cells. Biomolecules. 2022;12(9):1228. doi:10.3390/biom12091228
41. Li X, Wang L, Liu M, Zhou H, Xu H. Association between neutrophil-to- lymphocyte ratio and diabetic kidney disease in type 2 diabetes mellitus patients: a cross-sectional study. Front Endocrinol. 2024;14:1285509. doi:10.3389/fendo.2023.1285509
42. Jaaban M, Zetoune AB, Hesenow S, Hessenow R. Neutrophil-lymphocyte ratio and platelet-lymphocyte ratio as novel risk markers for diabetic nephropathy in patients with type 2 diabetes. Heliyon. 2021;7(7):e07564. doi:10.1016/j.heliyon.2021.e07564
43. Mattared AM, Esheba NE, Elshora OA, Mohamed WS. Mean platelet volume and neutrophil to lymphocyte ratio in prediction of early diabetic nephropathy in type 2 diabetics. Diabetes Metab Syndr. 2019;13(2):1469–1473. doi:10.1016/j.dsx.2019.02.029
44. Subramani M, Anbarasan M, Shanmugam D, Muthumani LN, Vasudevan P. Role of neutrophil-lymphocyte ratio as a prognostic marker for type 2 diabetic nephropathy among Indians. Bioinformation. 2023;19(4):375–379. doi:10.6026/97320630019375
45. Lou J, Jing L, Yang H, Qin F, Long W, Shi R. Risk factors for diabetic nephropathy complications in community patients with type 2 diabetes mellitus in Shanghai: logistic regression and classification tree model analysis. Int J Health Plann Manage. 2019;34(3):1013–1024. doi:10.1002/hpm.2871
46. Rayego-Mateos S, Rodrigues-Diez RR, Fernandez-Fernandez B, et al. Targeting inflammation to treat diabetic kidney disease: the road to 2030. Kidney Int. 2023;103(2):282–296. doi:10.1016/j.kint.2022.10.030
47. McGuire DK, Shih WJ, Cosentino F, et al. Association of SGLT2 inhibitors with cardiovascular and kidney outcomes in patients with type 2 diabetes: a meta-analysis. JAMA Cardiol. 2021;6(2):148–158. doi:10.1001/jamacardio.2020.4511
48. Palmer SC, Tendal B, Mustafa RA, et al. Sodium-glucose cotransporter protein-2 (SGLT-2) inhibitors and glucagon-like peptide-1 (GLP-1) receptor agonists for type 2 diabetes: systematic review and network meta-analysis of randomised controlled trials. BMJ. 2021;372:m4573. doi:10.1136/bmj.o109
 © 2026 The Author(s). This work is published and licensed by Dove Medical Press Limited. The
full terms of this license are available at https://www.dovepress.com/terms
and incorporate the Creative Commons Attribution
- Non Commercial (unported, 4.0) License.
By accessing the work you hereby accept the Terms. Non-commercial uses of the work are permitted
without any further permission from Dove Medical Press Limited, provided the work is properly
attributed. For permission for commercial use of this work, please see paragraphs 4.2 and 5 of our Terms.
© 2026 The Author(s). This work is published and licensed by Dove Medical Press Limited. The
full terms of this license are available at https://www.dovepress.com/terms
and incorporate the Creative Commons Attribution
- Non Commercial (unported, 4.0) License.
By accessing the work you hereby accept the Terms. Non-commercial uses of the work are permitted
without any further permission from Dove Medical Press Limited, provided the work is properly
attributed. For permission for commercial use of this work, please see paragraphs 4.2 and 5 of our Terms.