")
Back to Journals » International Journal of Chronic Obstructive Pulmonary Disease » Volume 12
Comparison of World Health Organization and Asia-Pacific body mass index classifications in COPD patients
Authors Lim JU, Lee JH , Kim JS , Hwang YI , Kim T , Lim SY , Yoo KH, Jung KS, Kim YK , Rhee CK
Received 7 May 2017
Accepted for publication 13 July 2017
Published 21 August 2017 Volume 2017:12 Pages 2465—2475
DOI https://doi.org/10.2147/COPD.S141295
Checked for plagiarism Yes
Review by Single anonymous peer review
Peer reviewer comments 4
Editor who approved publication: Dr Richard Russell
Jeong Uk Lim,1 Jae Ha Lee,2 Ju Sang Kim,3 Yong Il Hwang,4 Tae-Hyung Kim,5 Seong Yong Lim,6 Kwang Ha Yoo,7 Ki-Suck Jung,4 Young Kyoon Kim,8 Chin Kook Rhee8
1Division of Pulmonary, Critical Care and Sleep Medicine, Department of Internal Medicine, St Paul’s Hospital, College of Medicine, The Catholic University of Korea, 2Division of Pulmonology, Department of Internal Medicine, Inje University College of Medicine, Haeundae Paik Hospital, Busan, 3Division of Pulmonary Medicine, Department of Internal Medicine, Incheon St Mary’s Hospital, College of Medicine, The Catholic University of Korea, Incheon, 4Division of Pulmonary, Allergy and Critical Care Medicine, Department of Internal Medicine, Hallym University Sacred Heart Hospital, Hallym University College of Medicine, Anyang, 5Division of Pulmonary and Critical Care Medicine, Hanyang University Guri Hospital, Hanyang University College of Medicine, Guri, 6Division of Pulmonary and Critical Care Medicine, Department of Medicine, Kangbuk Samsung Hospital, Sungkyunkwan University School of Medicine, 7Division of Pulmonary, Allergy and Critical Care Medicine, Department of Internal Medicine, Konkuk University School of Medicine, 8Division of Pulmonary, Allergy and Critical Care Medicine, Department of Internal Medicine, Seoul St Mary’s Hospital, College of Medicine, The Catholic University of Korea, Seoul, Republic of Korea
Introduction: A low body mass index (BMI) is associated with increased mortality and low health-related quality of life in patients with COPD. The Asia-Pacific classification of BMI has a lower cutoff for overweight and obese categories compared to the World Health Organization (WHO) classification. The present study assessed patients with COPD among different BMI categories according to two BMI classification systems: WHO and Asia-Pacific.
Patients and methods: Patients with COPD aged 40 years or older from the Korean COPD Subtype Study cohort were selected for evaluation. We enrolled 1,462 patients. Medical history including age, sex, St George’s Respiratory Questionnaire (SGRQ-C), the modified Medical Research Council (mMRC) dyspnea scale, and post-bronchodilator forced expiratory volume in 1 second (FEV1) were evaluated. Patients were categorized into different BMI groups according to the two BMI classification systems.
Result: FEV1 and the diffusing capacity of the lung for carbon monoxide (DLCO) percentage revealed an inverse “U”-shaped pattern as the BMI groups changed from underweight to obese when WHO cutoffs were applied. When Asia-Pacific cutoffs were applied, FEV1 and DLCO (%) exhibited a linearly ascending relationship as the BMI increased, and the percentage of patients in the overweight and obese groups linearly decreased with increasing severity of the Global Initiative for Chronic Obstructive Lung Disease criteria. From the underweight to the overweight groups, SGRQ-C and mMRC had a decreasing relationship in both the WHO and Asia-Pacific classifications. The prevalence of comorbidities in the different BMI groups showed similar trends in both BMI classifications systems.
Conclusion: The present study demonstrated that patients with COPD who have a high BMI have better pulmonary function and health-related quality of life and reduced dyspnea symptoms. Furthermore, the Asia-Pacific BMI classification more appropriately reflects the correlation of obesity and disease manifestation in Asian COPD patients than the WHO classification.
Keywords: body mass index, COPD, comorbidity
Introduction
COPD is a slowly progressive disorder characterized by partially reversible chronic airway obstruction.1,2 Besides its lung manifestation, COPD has been considered to be a systemic disease in recent years due to its significant extrapulmonary findings.3 The body mass index (BMI), which can indirectly represent the degree of obesity, is one of the variables that affects the phenotypic expression of the disease, its course, and prognosis.3–9 Use of the BMI is recommended by the National Heart Lung and Blood Institute (NHLBI)10 and it has been shown to contribute toward the expression of COPD phenotypes.11,12 BMI is included in the Body-Mass Index, Airflow Obstruction, Dyspnea, and Exercise (BODE) index, which predicts the prognosis of patients with COPD.3 A low BMI is associated with increased mortality in patients with COPD3,10,13 through its influences on pulmonary mechanics,14 diaphragmatic muscle weakness,15 decreased lung function,16 as well as systemic inflammation and its biomarkers.17,18 Furthermore, a low body weight is associated with low health-related quality of life.19–21
With the increasing prevalence of obesity in Asia, BMI as a disease predictor has increased in importance. However, there has been controversy when applying international criteria for obesity to an Asian population, and there have been attempts to reinterpret the BMI cutoffs for Asian and Pacific populations.22,23 The World Health Organization (WHO) expert consultation identified further potential public health action points (23.0, 27.5, 32.5, and 37.5 kg/m2).24 In Asia-Pacific countries including Korea, the agreed cutoff for inclusion in the overweight category is 23.0 kg/m2.25 Asian populations have a higher risk of developing comorbidities such as cardiovascular disease and type 2 diabetes at BMIs lower than 25 kg/m2, which is the WHO cutoff point for overweight and, in addition, association between BMI and body fat percentage is different from that for Europeans.24 The prevalence of metabolically obese but normal-weight patients in Korea is almost twice that found in the United States (US) population26 and, compared to the non-Asian population, their muscle mass is smaller.
Very few studies have evaluated the correlation between BMI and the disease severity of patients with COPD according to the degree of obesity in Asians. We hypothesized that patients with COPD in different BMI groups would exhibit different manifestations of COPD and proportions of comorbidities. In addition, applying two BMI classifications and comparing the related clinical variables can be clinically significant and, to our knowledge, no study comparing two BMI classification systems has been reported.
Our study compared the clinical characteristics, disease severity, and COPD-related comorbidities of Korean patients with COPD in different BMI categories based on both the WHO and Asia-Pacific BMI classifications.
Patients and methods
Study participants
Patients registered in the Korean COPD Subtype Study (KOCOSS) were recruited from 48 tertiary referral hospitals in Korea and were required to visit the hospital to update their COPD status by self-administered questionnaires at least every 6 months.27 The inclusion criteria were as follows: age ≥40 years and post-bronchodilator forced expiratory volume in 1 second (FEV1)/forced vital capacity (FVC) <0.7. The medical history taken from patient questionnaires as well as measurements from their initial visit were used as baseline data. Age, sex, St George’s Respiratory Questionnaire (SGRQ-C) response, and the modified Medical Research Council (mMRC) dyspnea scale score of patients were recorded. Post-bronchodilator FEV1, FVC, and FEV1/FVC were checked by pulmonary function tests. Six-minute walk tests (6MWT) were also performed at the time of enrollment.
BMI and categorization
According to the NHLBI,10 BMI is calculated as weight in kilograms divided by the square of the height in meters (kg/m2) and is categorized into four groups according to the Asian-Pacific cutoff points (Table 1):25 underweight (<18.5 kg/m2), normal weight (18.5–22.9 kg/m2), overweight (23–24.9 kg/m2), and obese (≥25 kg/m2). For comparison, BMI was also categorized into four groups according to the conventional WHO classification:10 underweight (<18.5 kg/m2), normal weight (18.5–24.9 kg/m2), overweight (25–29.9 kg/m2), and obese (≥30 kg/m2).
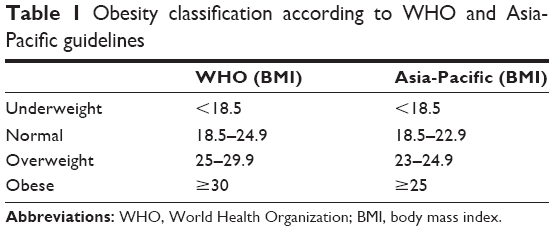 | Table 1 Obesity classification according to WHO and Asia-Pacific guidelines |
Ethnic backgrounds
Among Korean nationals, 96% are of Korean origin and most immigrants have an Asian background (People’s Republic of China, Vietnam, Japan, etc).28 All patients in this cohort were citizens of the Republic of Korea.
Comorbidities
At the time of enrollment to the cohort, patient comorbidities were checked. History of myocardial infarction, heart failure, peripheral vessel disease, diabetes mellitus, hypertension, osteoporosis, gastroesophageal reflux disease, dyslipidemia, thyroid disorder, inflammatory bowel disease, bronchiectasis, previously diagnosed COPD, measles, pertussis, pneumonia, asthma, allergic rhinitis, and atopic dermatitis were carefully evaluated.
Ethics statement
For KOCOSS patients, written informed consent was obtained from all study participants. Ethics approval for the KOCOSS cohort was obtained from the ethics committee at each center. We also received approval from each center to use clinical records of their subjects for the study while maintaining patient confidentiality with regard to the data. The official name of each approving ethics committee is listed in the Supplementary materials.
Statistical analysis
Continuous variables are reported as mean ± standard deviation. When comparing clinical parameters between BMI groups, an analysis of variance (ANOVA) test was performed for continuous variables, while the chi-squared test was performed for categorical variables. Pearson’s coefficient comparison was used to determine linear associations between numerical variables. Statistical significance was established at a P-value <0.05. The Mantel–Haenszel chi-squared test was performed to determine the association between categorical variables.
Results
Clinical characteristics
Table 2 lists the baseline characteristics of the study participants. The study included 1,462 subjects, and the number of male patients was 1,396 (90.8%). The mean patient age was 70.5±7.8 years. The predicted mean post-bronchodilator FEV1 percentage was 55.6%±18.3%. The mean FVC was 80.5±17.5 and FEV1/FVC was 48.8±12.3. The mean BMI was 22.8±3.4 kg/m2. The Global Initiative for Chronic Obstructive Lung Disease (GOLD) stage II was seen in the greatest proportion of this COPD cohort, with 758 (52.0%) patients falling into this category. The mean SGRQ-C was 34.6±19.0 and the mean COPD assessment test score was 15.8±7.8. The mean mMRC score was 1.5±0.9.
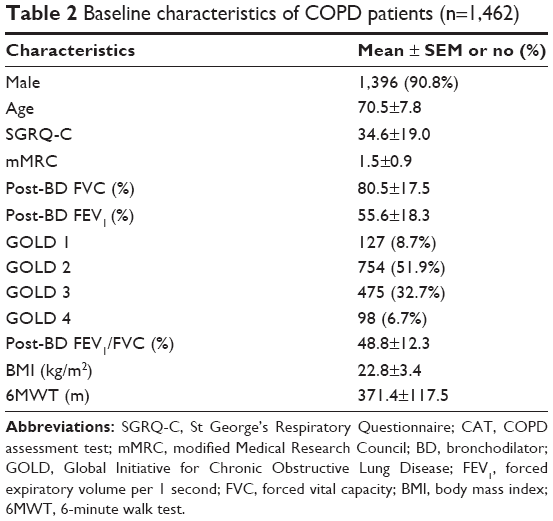 | Table 2 Baseline characteristics of COPD patients (n=1,462) |
Distribution of BMI
Figures 1 and 2 present the distribution of BMI values among study subjects. The mean BMI value was 22.8 [95% confidence interval (CI) 22.6–23.0] and the median value was 22.7. The lowest BMI value was 13.50, whereas the highest was 35.99 (Figure 1). Figure 2 shows the distribution of BMI values among the entire study population.
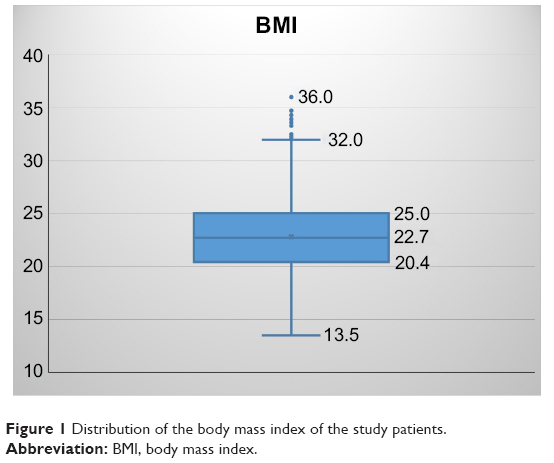 | Figure 1 Distribution of the body mass index of the study patients. |
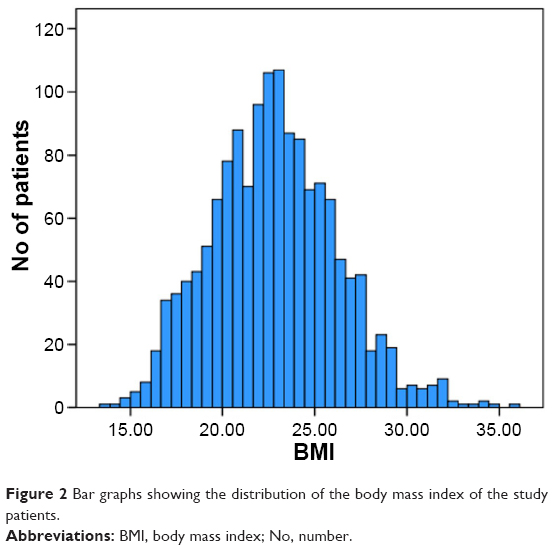 | Figure 2 Bar graphs showing the distribution of the body mass index of the study patients. |
Correlation of major variables with different BMI categories
The SGRQ-C was found to be in a linearly decreasing relationship with BMI (Pearson coefficient of correlation r=−0.14, P<0.01). However, the post-bronchodilator FEV1 was in a linearly increasing relationship with BMI (r=0.21, P<0.01). The diffusing capacity of the lung for carbon monoxide (DLCO) percentage and DLCO/alveolar volume (VA) were also in a linearly increasing relationship with BMI (r=0.22, P<0.01 and r=0.41, P<0.01, respectively; Figure 3).
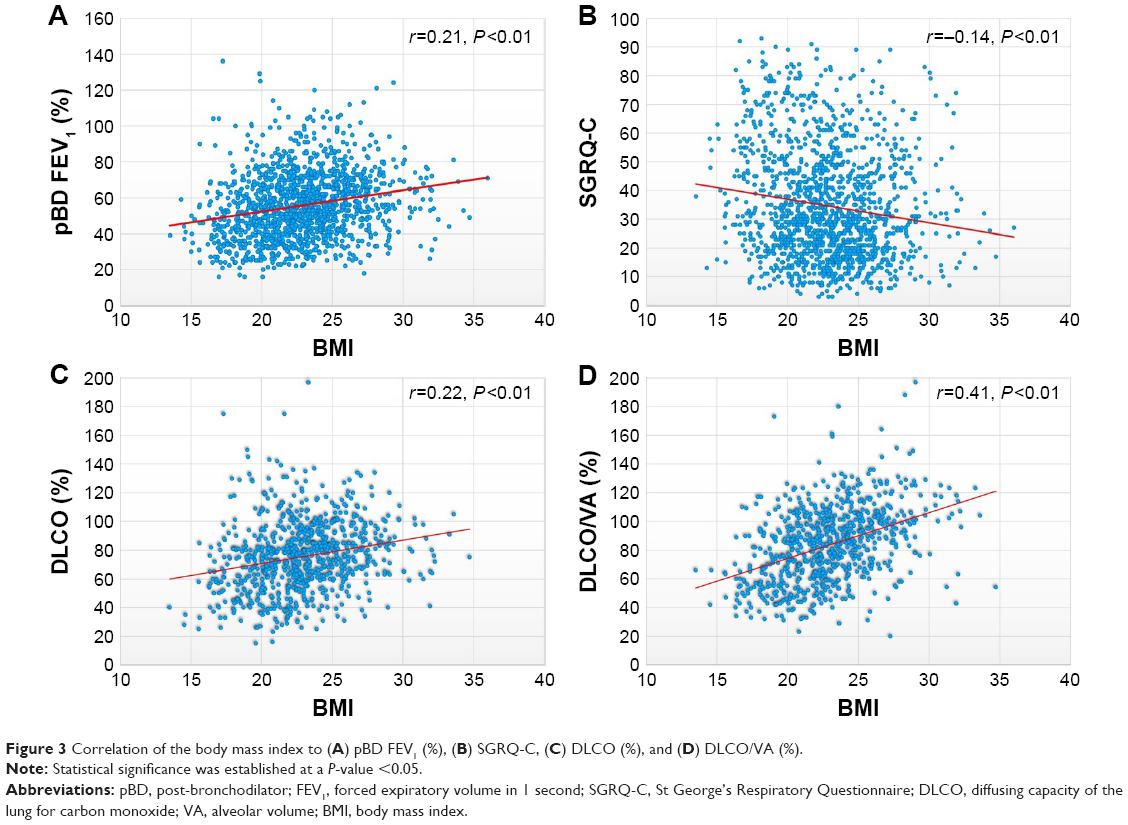 | Figure 3 Correlation of the body mass index to (A) pBD FEV1 (%), (B) SGRQ-C, (C) DLCO (%), and (D) DLCO/VA (%). |
Furthermore, we evaluated differences in the values of major variables when the BMI groups changed (Table 3). Changes in variables were also evaluated according to each classification system (WHO and Asia-Pacific). No significant change in the mean age was observed in either classification. A comparison of the normal weight group to the overweight group revealed that the proportion of male patients decreased gradually. Between the underweight and normal weight groups, SGRQ-C and mMRC scores were in a decreasing relationship in both the WHO and Asia-Pacific classifications. However, the two variables increased from the overweight to the obese group.
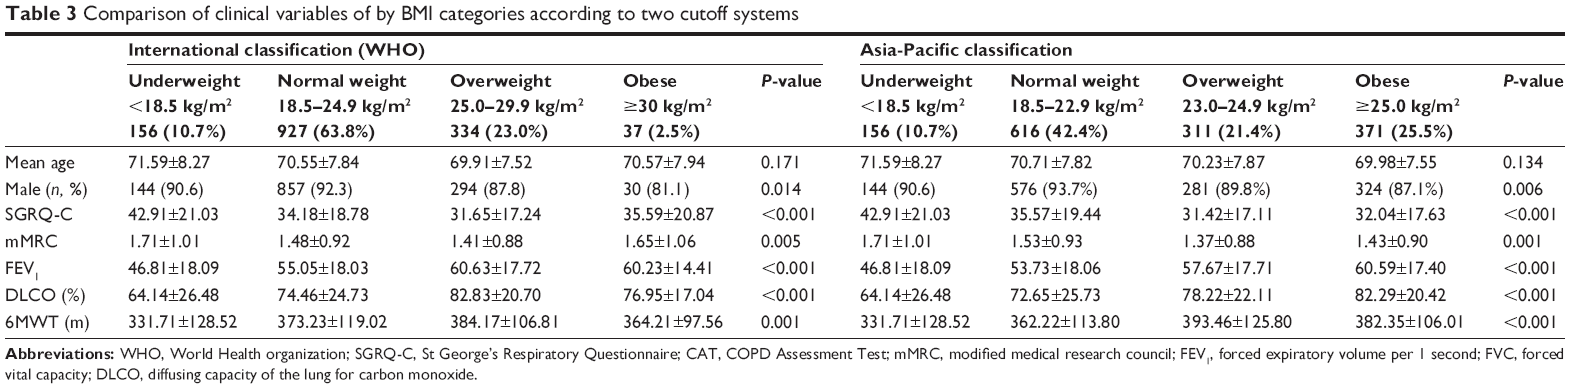 | Table 3 Comparison of clinical variables of by BMI categories according to two cutoff systems |
When the WHO cutoffs were applied, an inverse “U”-shaped pattern was observed for FEV1. When the Asia-Pacific cutoffs were applied, FEV1 was in a linearly ascending relationship, whereas DLCO (%) was in a linearly increasing relationship with BMI when the Asia-Pacific cutoffs were applied. However, DLCO (%) had an inverse “U”-shaped pattern when the WHO cutoffs were applied (Table 3).
FEV1 (%) and BMI categories
We compared the mean BMI of the groups of patients classified according to the GOLD criteria (Figure 4) and found that mean BMI decreases as the severity of airway obstruction increases. Mean BMI was 23.6 kg/m2 in the GOLD 1 group and 21.2 kg/m2 in the GOLD 4 group. Figure 5 shows the proportion of each BMI group. Figure 5A shows the proportion of each BMI group according to the WHO cutoffs, and Figure 5B shows proportions according to the Asia-Pacific cutoffs. When WHO cutoffs were applied, 2.4% of the patients fell into the obese category, while 25.5% of the patients were found to be obese according to the Asia-Pacific cutoffs.
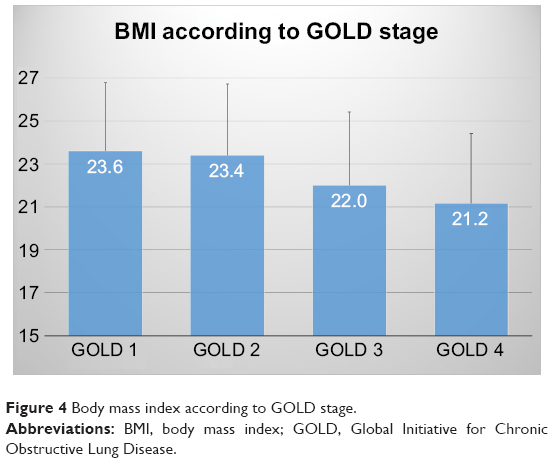 | Figure 4 Body mass index according to GOLD stage. |
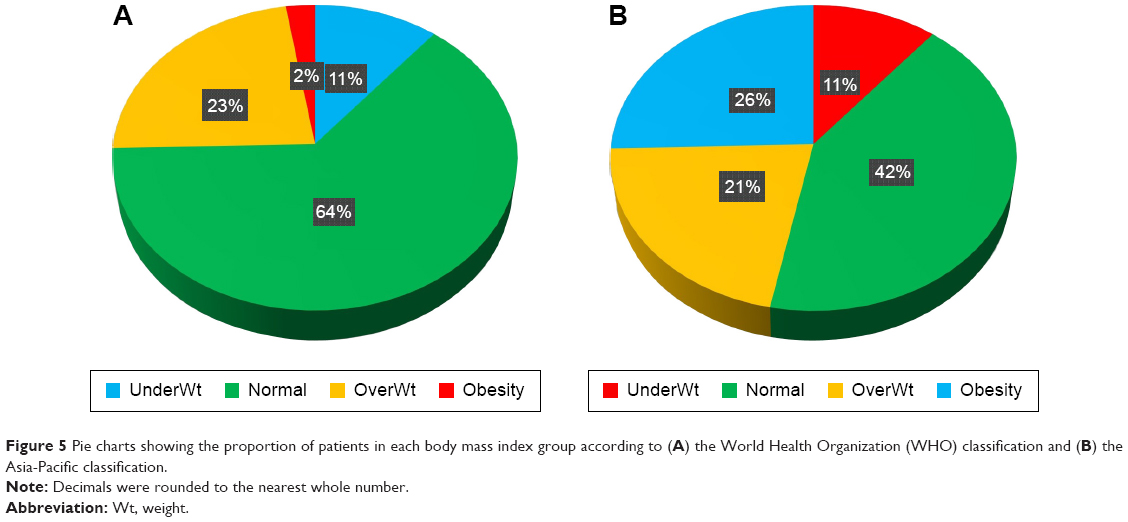 | Figure 5 Pie charts showing the proportion of patients in each body mass index group according to (A) the World Health Organization (WHO) classification and (B) the Asia-Pacific classification. |
Table 4 shows the proportion of each BMI group according to the GOLD criteria. As the severity of the GOLD criteria increases, proportions of the different BMI categories by both WHO and Asia-Pacific cutoffs change with statistical significance (P-value <0.001). However, when WHO cutoffs were applied, the percentage of the obese group decreased after an initial increase. Conversely, when the Asia-Pacific cutoffs were applied, the percentage in the obese group linearly decreased as the GOLD criteria increased in severity. The percentage in the underweight patient group increased from 5.5% to 21.4% as the GOLD criteria changed from 1 to 4 for both BMI classifications.
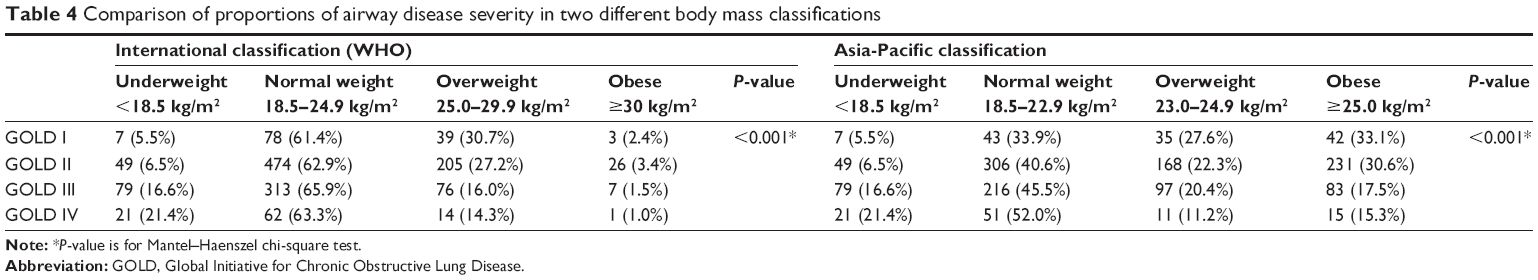 | Table 4 Comparison of proportions of airway disease severity in two different body mass classifications |
Comorbidities
Comorbidities were observed in different percentages in different BMI categories. Figure 6A presents the comorbidities of patients in different BMI groups classified according to the WHO cutoffs, while Figure 6B presents those in BMI groups according to the Asia-Pacific cutoffs. Both graphs show that the percentage of patients with hypertension, diabetes, and hyperlipidemia increased as the groups became more obese. The percentage of patients with congestive heart failure, myocardial infarction, and peripheral vascular disease was also highest in the obese groups. Osteoporosis had the highest proportion of patients in the obese group when the WHO classification was applied and also had the highest proportion of patients in the underweight group when the Asia-Pacific classification was applied (Figure 6).
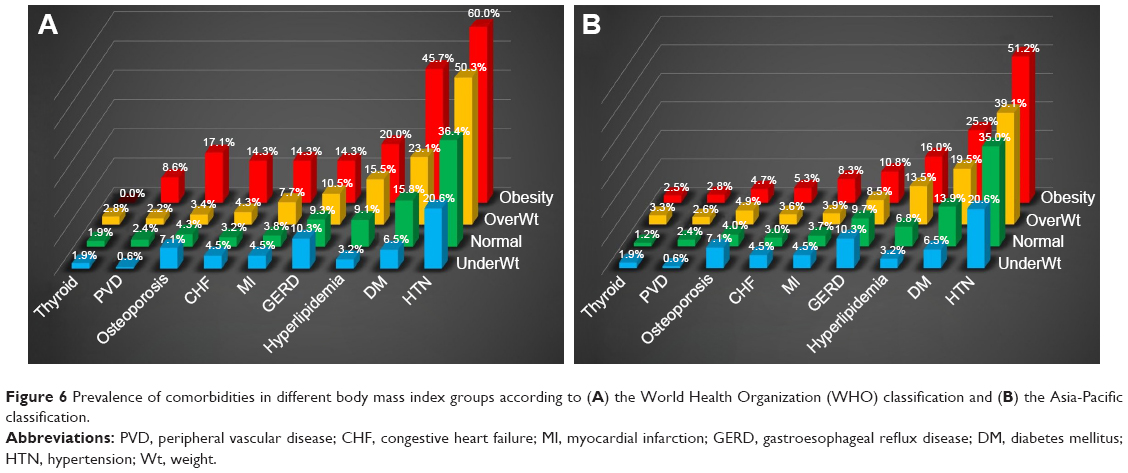 | Figure 6 Prevalence of comorbidities in different body mass index groups according to (A) the World Health Organization (WHO) classification and (B) the Asia-Pacific classification. |
Discussion
The present COPD cohort study evaluated COPD manifestation and comorbidity in different BMI categories. First, FEV1 worsened as the BMI groups changed from obese to underweight. Second, the quality of life and dyspnea score improved as the BMI groups changed from underweight to overweight. Third, comorbidities were observed in different proportions according to the BMI group. Two BMI classifications were used to assess the clinical correlation between clinical parameters and BMI, and several differences were observed.
These results reveal that a low BMI is associated with worse health-related quality of life in patients with COPD, and this result is consistent with those of previous studies.19–21,29 The study by Divo et al shows that the dyspnea score and SGRQ-C showed a “U” shape as the BMI category changed from underweight to obese.30 In the present study, SGRQ-C and mMRC scores were lowest for the overweight group and increased in the obese group, similar to the result from a previous study.30 We speculate that SGRQ-C and mMRC were worse for obese patients compared to overweight patients, due to the influence of obesity on the activities of patients with COPD. An increase in fat mass is likely to be associated with functional limitation.31 Metabolic comorbidity associated with obesity may also be a contributing factor to the relative worsening of quality of life of these patients.
Post-bronchodilator FEV1 decreased as the patients’ BMI decreased. Previous studies have reported that BMI is correlated with the severity of emphysema, with low-BMI COPD patients more likely to have this condition;30,32,33 such findings can provide an explanation for the linear decrease of FEV1 in the low-BMI group. In addition to previously reported results, the DLCO percentage gradually increased as patients were classified into groups of increasing obesity. Such a correlation between DLCO and obesity is controversial. Some studies have reported increased DLCO in more obese patients,30,34–36 while other studies have observed unchanged or reduced DLCO in obese patients.37–39 Nevertheless, a linear decrease of DLCO in lower BMI groups should be interpreted as a correlation between emphysema and low body mass, as previous studies showing a correlation between DLCO and emphysema suggest.40,41 Clinical relationships of FEV1 and DLCO to BMI also support the previously mentioned “obesity paradox” in which patients with COPD with higher BMI have better prognosis compared to low BMI groups.42,43
In this study, the WHO and Asia-Pacific BMI classifications were simultaneously applied to assess patients with COPD, and major clinical variables were evaluated for each classification system. To our knowledge, no study comparing two BMI classifications in Asian patients with COPD has previously been reported. Both BMI classification systems revealed similar changes in major variables as the patients became more obese (Table 3). However, when the Asia-Pacific cutoffs were applied, changes in the SGRQ-C and mMRC scores were more constant as the patients fell into the more obese groups. The change in FEV1% was more gradual compared to when the WHO cutoffs were applied.
Furthermore, when the WHO classification was applied, the proportion of obese patients was too low (2.5%) to allow a comparison with less obese patients. The proportions of obese patients were 29.6% according to the studies on the distribution of BMI among patients with COPD in both Spain44 as well as the Middle East and North Africa.45 The study by Rodríguez et al showed that the proportion of the obese was 43% among the selected patients with COPD.46 In addition, when evaluating the clinical parameters associated with BMI, such as health-related quality of life, dyspnea score, and respiratory functions, Asia-Pacific classifications can be more appropriate than WHO classifications in Asian patients with COPD.
We assume that the Asia-Pacific BMI classification is more appropriate for Asian patients for the following reasons. A previous study suggested that weight loss in patients with COPD is due to a loss of skeletal muscle volume; on the other hand, a change in fat mass is not a significant contributor.47 Furthermore, the fat-free mass index (FFMI) is reported to be more significant than fat mass in the assessment of quality of life and respiratory function of patients with COPD.48,49 According to the evaluation of Korea National Health and Nutrition Examination Survey (KNHANES), mean BMI and appendicular skeletal muscle (ASM) of Koreans were 24.0±0.0 kg/m2 and 22.6±0.1 kg in men and 23.2±0.1 kg/m2 and 14.5±0.0 kg in women, respectively.50,51 In contrast, average BMI and ASM from the US population sample from the National Health and Nutrition Examination Survey (NHANES) were 27.9±0.10 kg/m2 and 26.5±0.1 kg in men and 28.2±0.14 in women and 17.8±0.1 kg, respectively.52,53 Because the Asia-Pacific grading of obesity is based on a consensus that the skeletal and muscle mass of patients in the Asia-Pacific region is lower than that in the West,25 we might, therefore, expect a better correlation between BMI according to the Asia-Pacific guidelines than with the WHO grading in Asian patients with COPD.
Metabolic and cardiac problems were more frequent in the obese groups, and such a finding is consistent with the previous study on patients with COPD30 and distribution of comorbidities among the general population.54,55 The prevalence of metabolic disease and cardiovascular disease were much higher when the WHO classification was applied as compared to when the Asia-Pacific classification was applied. The proportion of patients with major comorbidities may differ according to the two different BMI classifications, but the patterns of increase or decrease according to the BMI of the patients with COPD were similar. Moreover, due to the extremely small number of patients falling into the obese category when the WHO cutoffs were applied, some comorbidities such as osteoporosis had an inappropriately high prevalence.
It is widely known that Asian and Western populations differ in mean body mass. However, few studies have compared BMI between Western and Asian patients with COPD. No statistical analysis was conducted for comparison with the other cohorts due to lack of raw data; however, the present study indirectly compared mean BMI of Korean patients with COPD to both Japanese and Western patients with COPD. Interestingly, compared with other major COPD cohorts, the mean BMI of the KOCOSS cohort was much lower than that in the Evaluation of COPD Longitudinally to Identify Predictive Surrogate Endpoints (ECLIPSE; 27±6 kg/m2);56 such a finding can be explained by the difference in body mass between Western and Asian populations. As expected, the Hokkaido cohort’s mean BMI (22±3 kg/m2)57,58 was similar to that for the KOCOSS patients (23±3 kg/m2; Figure 7).
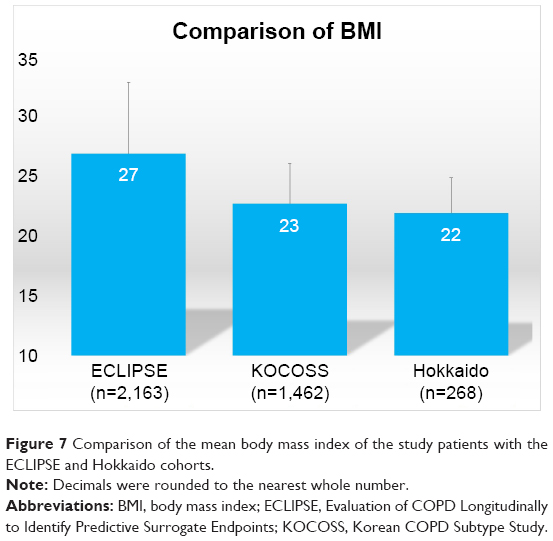 | Figure 7 Comparison of the mean body mass index of the study patients with the ECLIPSE and Hokkaido cohorts. |
Our study has a few limitations. First, due to the relatively short duration of the observation period of our recently constructed cohort, the mortality of the study patients could not be evaluated. Second, the body composition data, comprising fat and skeletal muscle mass and quadriceps muscle strength, of patients were not measured. Due to lack of body composition data, evaluation of the association of clinical parameters such as lung function and symptom score to FFMM was limited. We planned to include body composition data for the future study. However, we performed the 6 MWT to evaluate the functional capacity of these patients.
Conclusion
The present study revealed that patients with COPD with a high BMI had better pulmonary function and health-related quality of life and fewer dyspnea symptoms. Furthermore, the results suggest that the Asia-Pacific BMI classification is more appropriate in reflecting the correlation between obesity and the manifestation of COPD in Asian patients compared to that with the WHO classification system. Further studies regarding the clinical significance of BMI classification in Asian patients with COPD are needed.
Acknowledgment
The English in this document has been checked by at least two professional editors, both native speakers of English.
Disclosure
The authors report no conflicts of interest in this work.
References
Pauwels RA, Buist AS, Calverley PM, Jenkins CR, Hurd SS; GOLD Scientific Committee. Global strategy for the diagnosis, management, and prevention of chronic obstructive pulmonary disease. NHLBI/WHO Global Initiative for Chronic Obstructive Lung Disease (GOLD) Workshop summary. Am J Respir Crit Care Med. 2001;163(5):1256–1276. | ||
Celli BR, MacNee W; ATS/ERS Task Force. Standards for the diagnosis and treatment of patients with COPD: a summary of the ATS/ERS position paper. Eur Respir J. 2004;23(6):932–946. | ||
Celli BR, Cote CG, Marin JM, et al. The body-mass index, airflow obstruction, dyspnea, and exercise capacity index in chronic obstructive pulmonary disease. N Engl J Med. 2004;350(10):1005–1012. | ||
Casanova C, Aguirre-Jaíme A, de Torres JP, et al. Longitudinal assessment in COPD patients: multidimensional variability and outcomes. Eur Respir J. 2014;43(3):745–753. | ||
Marin JM, Alfageme I, Almagro P, et al. Multicomponent indices to predict survival in COPD: the COCOMICS study. Eur Respir J. 2013;42(2):323–332. | ||
Vestbo J, Hurd SS, Agustí AG, et al. Global strategy for the diagnosis, management, and prevention of chronic obstructive pulmonary disease: GOLD executive summary. Am J Respir Crit Care Med. 2013;187(4):347–365. | ||
Pischon T, Boeing H, Hoffmann K, et al. General and abdominal adiposity and risk of death in Europe. N Engl J Med. 2008;359(20):2105–2120. | ||
Castaldi PJ, Dy J, Ross J, et al. Cluster analysis in the COPD Gene study identifies subtypes of smokers with distinct patterns of airway disease and emphysema. Thorax. 2014;69(5):415–422. | ||
Rennard SI, Locantore N, Delafont B, et al. Identification of five chronic obstructive pulmonary disease subgroups with different prognoses in the ECLIPSE cohort using cluster analysis. Ann Am Thorac Soc. 2015;12(3):303–312. | ||
Executive summary of the clinical guidelines on the identification, evaluation, and treatment of overweight and obesity in adults. Arch Intern Med. 1998;158(17):1855–1867. | ||
Garcia-Aymerich J, Gómez FP, Benet M; PAC-COPD Study Group. Identification and prospective validation of clinically relevant chronic obstructive pulmonary disease (COPD) subtypes. Thorax. 2011;66(5):430–437. | ||
Burgel PR, Paillasseur JL, Caillaud D; Initiatives BPCO Scientific Committee. Clinical COPD phenotypes: a novel approach using principal component and cluster analyses. Eur Respir J. 2010;36(3):531–539. | ||
Cao C, Wang R, Wang J, Bunjhoo H, Xu Y, Xiong W. Body mass index and mortality in chronic obstructive pulmonary disease: a meta-analysis. PLoS One. 2012;7(8):e43892. | ||
Franssen FM, O’Donnell DE, Goossens GH, Blaak EE, Schols AM. Obesity and the lung: 5. Obesity and COPD. Thorax. 2008;63(12):1110–1117. | ||
Vestbo J, Prescott E, Almdal T, et al. Body mass, fat-free body mass, and prognosis in patients with chronic obstructive pulmonary disease from a random population sample: findings from the Copenhagen City Heart Study. Am J Respir Crit Care Med. 2006;173(1):79–83. | ||
Coxson HO, Chan IH, Mayo JR, Hlynsky J, Nakano Y, Birmingham CL. Early emphysema in patients with anorexia nervosa. Am J Respir Crit Care Med. 2004;170(7):748–752. | ||
Agusti A, Edwards LD, Rennard SI; Evaluation of COPD Longitudinally to Identify Predictive Surrogate Endpoints (ECLIPSE) Investigators. Persistent systemic inflammation is associated with poor clinical outcomes in COPD: a novel phenotype. PLoS One. 2012;7(5):e37483. | ||
Tomoda K, Yoshikawa M, Itoh T, et al. Elevated circulating plasma adiponectin in underweight patients with COPD. Chest. 2007;132(1):135–140. | ||
Hesselink AE, van der Windt DA, Penninx BW, et al. What predicts change in pulmonary function and quality of life in asthma or COPD? J Asthma. 2006;43(7):513–519. | ||
Shoup R, Dalsky G, Warner S, et al. Body composition and health-related quality of life in patients with obstructive airways disease. Eur Respir J. 1997;10(7):1576–1580. | ||
Katsura H, Yamada K, Kida K. Both generic and disease specific health-related quality of life are deteriorated in patients with underweight COPD. Respir Med. 2005;99(5):624–630. | ||
WHO/IASO/IOTF. The Asia-Pacific perspective: redefining obesity and its treatment. Health Communications Australia: Melbourne. 2000. | ||
James WP, Chunming C, Inoue S. Appropriate Asian body mass indices? Obes Rev. 2002;3(3):139. | ||
WHO Expert Consultation. Appropriate body-mass index for Asian populations and its implications for policy and intervention strategies. Lancet. 2004;363(9403):157–163. | ||
Pan WH, Yeh WT. How to define obesity? Evidence-based multiple action points for public awareness, screening, and treatment: an extension of Asian-Pacific recommendations. Asia Pac J Clin Nutr. 2008;17(3):370–374. | ||
Lee K. Metabolically obese but normal weight (MONW) and metabolically healthy but obese (MHO) phenotypes in Koreans: characteristics and health behaviors. Asia Pac J Clin Nutr. 2009;18(2):280–284. | ||
Lee JY, Chon GR, Rhee CK, et al. Characteristics of patients with chronic obstructive pulmonary disease at the first visit to a pulmonary medical center in Korea: The KOrea COpd Subgroup Study Team Cohort. J Korean Med Sci. 2016;31(4):553–560. | ||
Kostat.go.kr. Daejeon: Statistics Korea [updated 2016 Aug 04; cited 2017 Jun 12]. Available from: http://kostat.go.kr/portal/korea/index.action/. Accessed Jun 12, 2017. | ||
Tsiligianni I, Kocks J, Tzanakis N, Siafakas N, van der Molen T. Factors that influence disease-specific quality of life or health status in patients with COPD: a review and meta-analysis of Pearson correlations. Prim Care Respir J. 2011;20(3):257–268. | ||
Divo MJ, Cabrera C, Casanova C, et al. Comorbidity distribution, clinical expression and survival in COPD patients with different body mass index. J COPD F. 2014;1(2):229–238. | ||
Eisner MD, Blanc PD, Sidney S, et al. Body composition and functional limitation in COPD. Respir Res. 2007;8:7. | ||
Renvall MJ, Friedman P, Ramsdell JW. Predictors of body mass index in patients with moderate to severe emphysema. COPD. 2009;6(6):432–436. | ||
Ogawa E, Nakano Y, Ohara T, et al. Body mass index in male patients with COPD: correlation with low attenuation areas on CT. Thorax. 2009;64(1):20–25. | ||
Collard P, Wilputte JY, Aubert G, Rodenstein DO, Frans A. The single-breath diffusing capacity for carbon monoxide in obstructive sleep apnea and obesity. Chest. 1996;110(5):1189–1193. | ||
Saydain G, Beck KC, Decker PA, Cowl CT, Scanlon PD. Clinical significance of elevated diffusing capacity. Chest. 2004;125(2):446–452. | ||
Ray CS, Sue DY, Bray G, Hansen JE, Wasserman K. Effects of obesity on respiratory function. Am Rev Respir Dis. 1983;128(3):501–506. | ||
Biring MS, Lewis MI, Liu JT, Mohsenifar Z. Pulmonary physiologic changes of morbid obesity. Am J Med Sci. 1999;318(5):293–297. | ||
Hakala K, Stenius-Aarniala B, Sovijärvi A. Effects of weight loss on peak flow variability, airways obstruction, and lung volumes in obese patients with asthma. Chest. 2000;118(5):1315–1321. | ||
Ravipati G, Aronow WS, Sidana J, et al. Association of reduced carbon monoxide diffusing capacity with moderate or severe left ventricular diastolic dysfunction in obese persons. Chest. 2005;128(3):1620–1622. | ||
Holme J, Stockley RA. Radiologic and clinical features of COPD patients with discordant pulmonary physiology: lessons from alpha1-antitrypsin deficiency. Chest. 2007;132(3):909–915. | ||
van der Lee I, Gietema HA, Zanen P, et al. Nitric oxide diffusing capacity versus spirometry in the early diagnosis of emphysema in smokers. Respir Med. 2009;103(12):1892–1897. | ||
Jee SH, Sull JW, Park J, et al. Body-mass index and mortality in Korean men and women. N Engl J Med. 2006;355(8):779–787. | ||
Landbo C, Prescott E, Lange P, Vestbo J, Almdal TP. Prognostic value of nutritional status in chronic obstructive pulmonary disease. Am J Respir Crit Care Med. 1999;160(6):1856–1861. | ||
García-Rio F, Soriano JB, Miravitlles M, et al. Impact of obesity on the clinical profile of a population-based sample with chronic obstructive pulmonary disease. PLoS One. 2014;9(8):e105220. | ||
Koniski ML, Salhi H, Lahlou A, Rashid N, El Hasnaoui A. Distribution of body mass index among subjects with COPD in the Middle East and North Africa region: data from the BREATHE study. Int J Chron Obstruct Pulmon Dis. 2015;10:1685–1694. | ||
Rodríguez DA, Garcia-Aymerich J, Valera JL, et al. Determinants of exercise capacity in obese and non-obese COPD patients. Respir Med. 2014;108(5):745–751. | ||
Ischaki E, Papatheodorou G, Gaki E, Papa I, Koulouris N, Loukides S. Body mass and fat-free mass indices in COPD: relation with variables expressing disease severity. Chest. 2007;132(1):164–169. | ||
Planas M, Alvarez J, Garcia-Peris PA, et al. Nutritional support and quality of life in stable chronic obstructive pulmonary disease (COPD) patients. Clin Nutr. 2005;24(3):433–441. | ||
McDonald VM, Gibson PG, Scott HA, et al. Should we treat obesity in COPD? The effects of diet and resistance exercise training. Respirology. 2016;21(5):875–882. | ||
Kim SG, Ko K, Hwang IC, et al. Relationship between indices of obesity obtained by anthropometry and dual-energy X-ray absorptiometry: The Fourth and Fifth Korea National Health and Nutrition Examination Survey (KNHANES IV and V, 2008–2011). Obes Res Clin Pract. 2015;9(5):487–498. | ||
Kim Y, Han BD, Han K, et al. Optimal cutoffs for low skeletal muscle mass related to cardiovascular risk in adults: The Korea National Health and Nutrition Examination Survey 2009–2010. Endocrine. 2015;50(2):424–433. | ||
Flegal KM, Shepherd JA, Looker AC, et al. Comparisons of percentage body fat, body mass index, waist circumference, and waist-stature ratio in adults. Am J Clin Nutr. 2009;89(2):500–508. | ||
Prado CM, Siervo M, Mire E, et al. A population-based approach to define body-composition phenotypes. Am J Clin Nutr. 2014;99(6):1369–1377. | ||
Aronson D, Bartha P, Zinder O, et al. Obesity is the major determinant of elevated C-reactive protein in subjects with the metabolic syndrome. Int J Obes Relat Metab Disord. 2004;28(5):674–679. | ||
Florez H, Castillo-Florez S, Mendez A, et al. C-reactive protein is elevated in obese patients with the metabolic syndrome. Diabetes Res Clin Pract. 2006;71(1):92–100. | ||
Vestbo J, Edwards LD, Scanlon PD, et al; ECLIPSE Investigators. Changes in forced expiratory volume in 1 second over time in COPD. N Engl J Med. 2011;365(13):1184–1192. | ||
Suzuki M, Makita H, Konno S, et al; Hokkaido COPD Cohort Study Investigators. Asthma-like features and clinical course of chronic obstructive pulmonary disease. An analysis from the Hokkaido COPD cohort study. Am J Respir Crit Care Med. 2016;194(11):1358–1365. | ||
Hizawa N, Makita H, Nasuhara Y, et al; Hokkaido COPD Cohort Study Group. Functional single nucleotide polymorphisms of the CCL5 gene and nonemphysematous phenotype in COPD patients. Eur Respir J. 2008;32(2):372–378. |
Supplementary materials
The names of ethics committees are as follows: Gacheon University Gil Medical Center, Hallym University Kangnam Sacred Heart Hospital, Gangnam Severance Hospital, Kyung Hee University Hospital at Gangdong, Hallym University Kangdong Sacred Heart Hospital, Kangbuk Samsung Hospital, Kangwon National University Hospital, Konkuk University Hospital, Konkuk University Chungju Hospital, Kyungpook National University Hospital, Gyeongsang National University Hospital, Korea University Guro Hospital, Korea University Anam Hospital, Seoul Eulji Hospital, Dongguk University Gyeongju Hospital, Dongguk University Ilsan Hospital, Keimyung University Dongsan Medical Center, Dong-A University Hospital, Hallym University Dongtan Sacred Heart Hospital, Pusan National University Hospital, Inje University Busan Paik Hospital, The Catholic University of Korea Bucheon St Mary’s Hospital, Soonchunhyang University Hospital Bucheon, Seoul National University Bundang Hospital, Bundang CHA Hospital, Seoul Metropolitan Government Seoul National University Bora-mae Medical Center, Samsung Medical Center, Soonchunhyang University Hospital Seoul, The Catholic University of Korea Seoul St Mary’s Hospital, The Catholic University of Korea St Paul’s Hospital, The Catholic University of Korea St Vincent’s Hospital, Severance Hospital, Asan Medical Center, Ajou University Hospital, The Catholic University of Korea Yeouido St Mary’s Hospital, The Catholic University of Korea Uijeongbu St Mary’s Hospital, Yeungnam University Medical Center, Ulsan University Hospital, Wonkwang University Sanbon Hospital, Wonju Severance Christian Hospital, Ewha Womans University Mokding Hospital, Incheon St Mary’s Hospital, Inha University Hospital, Chonnam National University Hospital, Chonbuk National University Hospital, Jeju National University Hospital, Soonchunhyang University Hospital Cheonan, Hallym University Chuncheon Sacred Heart Hospital, Hallym University Sacred Heart Hospital, and Hanyang University Guri Hospital.
We also received approval from each center to use their subjects’ clinical records for the study while maintaining the confidentiality of the data.
 © 2017 The Author(s). This work is published and licensed by Dove Medical Press Limited. The
full terms of this license are available at https://www.dovepress.com/terms.php
and incorporate the Creative Commons Attribution
- Non Commercial (unported, v3.0) License.
By accessing the work you hereby accept the Terms. Non-commercial uses of the work are permitted
without any further permission from Dove Medical Press Limited, provided the work is properly
attributed. For permission for commercial use of this work, please see paragraphs 4.2 and 5 of our Terms.
© 2017 The Author(s). This work is published and licensed by Dove Medical Press Limited. The
full terms of this license are available at https://www.dovepress.com/terms.php
and incorporate the Creative Commons Attribution
- Non Commercial (unported, v3.0) License.
By accessing the work you hereby accept the Terms. Non-commercial uses of the work are permitted
without any further permission from Dove Medical Press Limited, provided the work is properly
attributed. For permission for commercial use of this work, please see paragraphs 4.2 and 5 of our Terms.