Back to Journals » Clinical Ophthalmology » Volume 19
Comparison of Visual Field Assessments Between the Humphrey Field Analyzer, Tempo, and Virtual Eye Elite Perimeters
Received 19 August 2025
Accepted for publication 28 November 2025
Published 9 December 2025 Volume 2025:19 Pages 4535—4542
DOI https://doi.org/10.2147/OPTH.S561638
Checked for plagiarism Yes
Review by Single anonymous peer review
Peer reviewer comments 2
Editor who approved publication: Dr Scott Fraser
Clayton Blehm,1 Brad Hall2
1North Georgia Eye Associates, Gainesville, GA, USA; 2Sengi, Penniac, NB, Canada
Correspondence: Clayton Blehm, North Georgia Eye Associates, Gainesville, GA, 30501, USA, Tel +1-770-532-4444, Email [email protected]
Purpose: To compare test duration and the agreement of summary metrics between the TEMPO, Virtual Eye ELITE (VEE), and Humphrey Field Analyzer (HFA) perimeters.
Methods: This was a prospective, randomized, comparative study. Subjects were excluded if they were unable to tolerate ophthalmic imaging or had any ocular or systemic conditions that could affect visual field test results, such as age-related macular degeneration, peripheral retinal disease, or severe glaucoma. Eligible subjects were assessed at 1 visit with all perimeters for total bilateral acquisition time, mean deviation (MD), pattern standard deviation (PSD), foveal threshold (FT), visual field index (VFI), false positives and false negatives, and administered a questionnaire.
Results: A total of 54 subjects completed the study. Mean bilateral visual field acquisition time differences were significant between TEMPO and HFA (p < 0.001) and TEMPO and VEE (p < 0.001), and not significant between HFA and VEE (p = 0.34). Mean MD differences were not significant between TEMPO and HFA (p = 0.96) and were significant for TEMPO and VEE (p = 0.01) and HFA and VEE (p = 0.02). Mean PSD differences were not significant between TEMPO and HFA (p = 0.27), TEMPO and VEE (p = 0.72), or HFA and VEE (p = 0.72). Mean foveal threshold differences were significant between TEMPO and HFA (p < 0.001), TEMPO and VEE (p < 0.001), and HFA and VEE (p < 0.001). A significantly higher percentage of subjects reported agreement that the testing was “Easy” to perform with the TEMPO compared to HFA (p < 0.001), TEMPO compared to VEE (p = 0.006), and with VEE compared to HFA (p = 0.002).
Conclusion: The results suggest similar summary metrics between the HFA, TEMPO, and VEE perimeters. There was faster acquisition time with the TEMPO. These results also indicate the potential for streamlined clinical workflow.
Keywords: perimetry, visual field, glaucoma
Introduction
The leading cause of irreversible blindness globally is glaucoma, with an estimated 76.0 million people worldwide and 4.2 million people in the United States impacted by this disease.1,2 For those with glaucoma, visual field testing is a key component of comprehensive eye examinations. Perimetry is the systematic measurement of visual field function, and allows clinicians to identify, quantify, and map patterns of vision loss to detect and monitor diseases like glaucoma.3–5 A popular device for perimetry is the Humphrey Field Analyzer (HFA, Carl Zeiss Meditec, Dublin, CA).6,7 However, as eyes are tested separately, HFA can be time consuming for both clinicians and patients.8 In addition, the HFA utilizes a projection bowl which requires testing in a dark room and has a large footprint.
As technology advances, novel opportunities are available to overcome some of the challenges with traditional standard automated perimetry (SAP). Several novel technologies, such as virtual reality and tablet perimetry,3,9,10 aim to address the longstanding pain points of traditional visual field devices and offer space-saving alternatives. Another new alternative to traditional SAP is the TEMPO perimeter (Topcon Healthcare, Tokyo, Japan), marketed as IMOvifa outside the US.11–13 The TEMPO is a tabletop instrument that allows visual field tests to be conducted in ambient room lighting.14 The 24–2 Ambient Interactive Zippy Estimated by Sequential Testing (AIZE)-Rapid has been demonstrated to have good agreement with the HFA 24–2 Swedish Interactive Threshold Algorithm (SITA)-Fast.12 Perimetry using virtual reality is another emergent option for clinicians and patients.15 In particular, the Virtual Eye ELITE (VEE; Virtual Vision, Miami, FL) is a head-mounted, portable device, that could be used for an in-home or in-office assessment under ambient lighting conditions.16 Pilot data to date has suggested reasonable agreement with HFA SAP and faster measurement time,16 however, more studies are needed. The purpose of this study was to compare test duration and the agreement of summary metrics between the TEMPO, VEE, and HFA perimeters.
Methods
This was a prospective, randomized, multi-arm, single-site study comparing visual assessments between three different perimeters. The study was reviewed and approved by an independent institutional review board (Advarra IRB, approval # Pro00080959). The study was conducted in private practice, therefore an independent IRB was used. The study followed the tenets of the Declaration of Helsinki, and International Harmonization (ICH) guidelines, and Good Clinical Practice (GCP). The study was also registered in a clinical trials database (NCT06539715). Data are not available for sharing.
Inclusion criteria were adult glaucoma patients with best-corrected visual acuity of 20/30 or better. Subjects were excluded if they were unable to tolerate ophthalmic imaging or had any ocular or systemic conditions that could affect visual field test results, such as age-related macular degeneration, peripheral retinal disease, or severe glaucoma (defined as a cup-to-disc ratio of >0.8). Mild and moderate glaucoma were defined as a cup-to-disc ratio of 0.6 to 0.7 inclusive and 0.8, respectively.
Eligible subjects performed perimetry with each of the three devices in this study—Humphrey Field Analyzer (HFA; model 745), TEMPO (version 20231214), Virtual Eye ELITE (VEE; model A7510). Visual field testing was performed with TEMPO using 24–2 Ambient Interactive Zippy Estimated by Sequential Testing (AIZE)-Rapid, and visual field testing with HFA and VEE using 24–2 Swedish Interactive Threshold Algorithm (SITA)-Fast. A Goldmann size of III was used for all devices. Subjects were randomized to the order of device testing using block randomization that was generated prior to recruitment and applied sequentially to enrolled patients. A five-minute rest period occurred between perimetry testing with each device. Subjects attended a single visit where informed consent was given and perimetry was performed with each of the three devices. Data were collected for mean deviation, pattern standard deviation, foveal threshold, false positives and false negatives, total acquisition time for both eyes, and subjects were administered a questionnaire. The questionnaire was developed in-house, and asked subjects to rate on a five-point Likert style scale the ease at which the testing was done, the comfort while completing the testing, and the anxiety caused by the testing for each device. Total setup time was defined as the time from first instructions to each participant up to visual field acquisition start. Total visual field acquisition time was the total time it took each subject to complete perimetry testing with both eyes, excluding any setup time or time to switch the setup from one eye to the next. One objective of this study was to compare the agreement of summary metrics between the perimeters. Therefore, no cutoff of false positives or false negatives from any device were used to exclude data from final analysis.
The primary endpoint was total acquisition time (both eyes) between devices. Secondary endpoints included mean deviation, pattern standard deviation, foveal threshold, and responses on the patient questionnaire. Exploratory endpoints included visual field index, setup time, and false positives and negatives for each device.
The software R (version 4.4.2; The R Foundation for Statistical Computing, Vienna, Austria) was used for all statistical analyses. Comparisons between devices were performed using linear mixed effect models that were adjusted for perimeter order and for multiple measurements with the same patient. Responses on the questionnaire were compared using Fisher’s Exact test, and p-values were adjusted to account for multiple comparisons. Bland-Altman analysis was used to evaluate difference between devices for mean deviation, pattern standard deviation, foveal threshold, and visual field index. In all cases, p ≤ 0.05 was considered significant. Assuming an effect size of 0.5, alpha 0.05, and power 90%, we estimated the study would require 46 subjects. To account for 15% dropout, the target sample size was to 54.
Results
Table 1 outlines the subject demographics. There were 54 subjects who completed the study, with no adverse events reported.
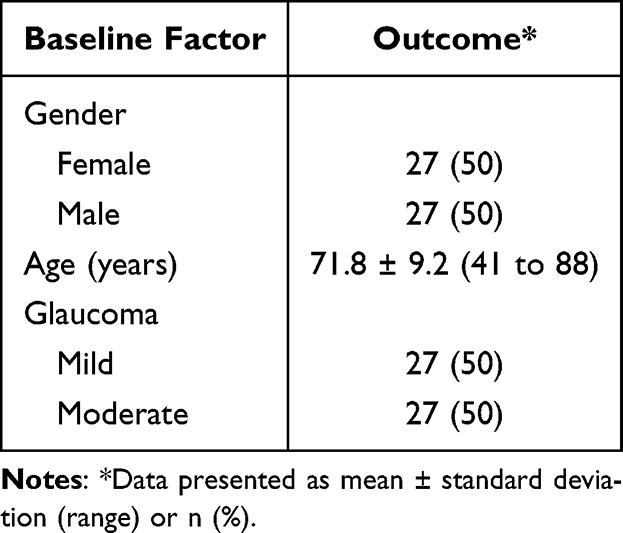 |
Table 1 Subject Demographics |
Table 2 summarizes the total bilateral acquisition time for visual fields, total setup time, mean deviation, pattern standard deviation, and foveal threshold between devices. Mean bilateral visual field acquisition time was 7.34 ± 2.27 minutes for HFA, 4.44 ± 0.88 minutes for TEMPO, and 7.71 ± 1.21 minutes for VEE. Differences were significant between TEMPO and HFA (p < 0.001), TEMPO and VEE (p < 0.001), but were not significant between HFA and VEE (p = 0.34). Mean total setup time was 1.92 ± 0.66 minutes for HFA, 1.69 ± 0.65 minutes for TEMPO, and 1.68 ± 0.60 minutes for VEE. Differences were significant between TEMPO and HFA (p = 0.002), HFA and VEE (p = 0.001), but were not significant between TEMPO and VEE (p = 0.98). Average mean deviation was −3.28 ± 4.19 dB for HFA, −3.16 ± 4.39 dB for TEMPO, and −4.22 ± 3.51 dB for VEE. Differences were not significant between TEMPO and HFA (p = 0.96), but were significant for TEMPO and VEE (p = 0.01) and HFA and VEE (p = 0.02). Mean pattern standard deviation was 4.22 ± 3.21 dB for HFA, 4.78 ± 3.82 dB for TEMPO, and 4.51 ± 2.99 dB for VEE. Differences were not significant between TEMPO and HFA (p = 0.27), TEMPO and VEE (p = 0.72), or HFA and VEE (p = 0.72). Mean foveal threshold was 34.71 ± 3.63 dB for HFA, 31.40 ± 3.77 dB for TEMPO, and 27.61 ± 6.20 dB for VEE. Differences were significant between TEMPO and HFA (p < 0.001), TEMPO and VEE (p < 0.001), and HFA and VEE (p < 0.001).
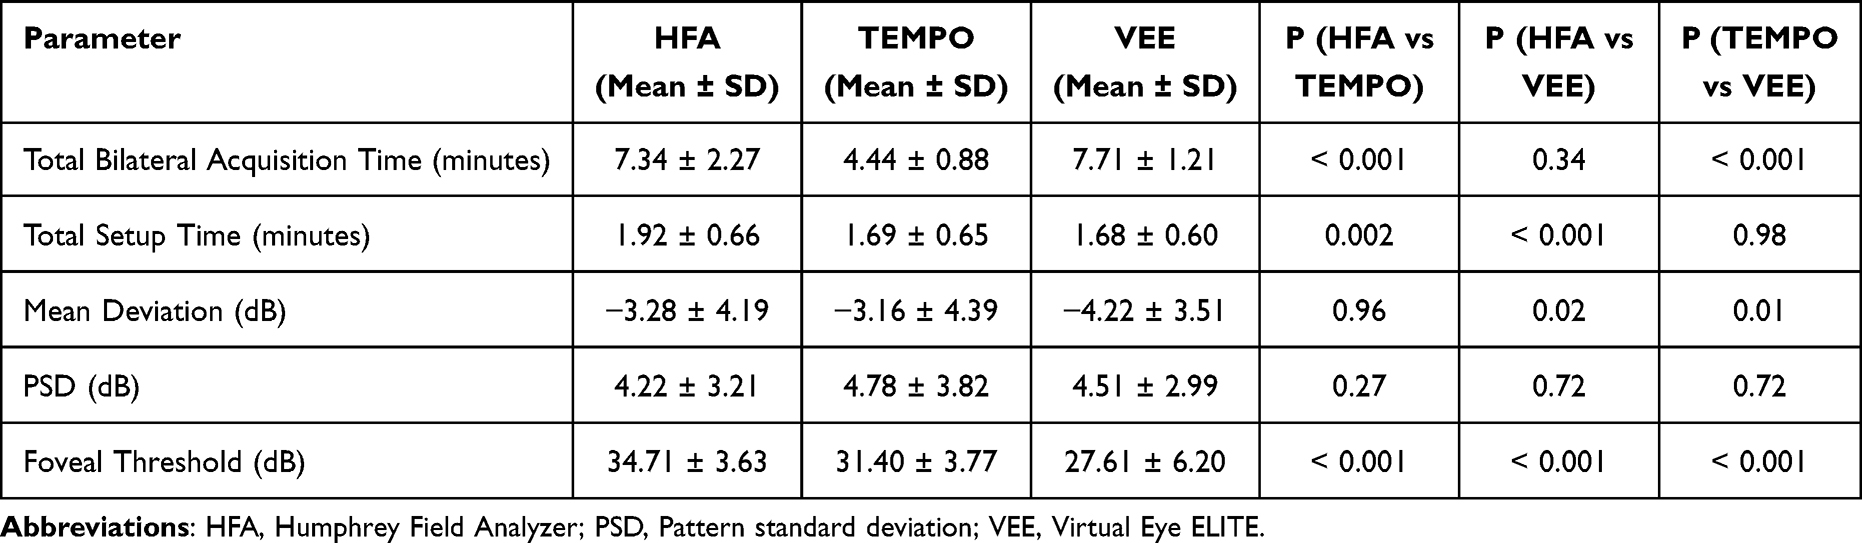 |
Table 2 Measurement Differences Between Devices |
Figure 1 summarizes the Bland-Altman analysis comparing mean deviation between devices. The mean difference for HFA compared to TEMPO was minimal at −0.12 dB (95% LoA −4.27 to 4.04 dB). For TEMPO vs VEE the mean difference was 1.06 dB (95% LoA −4.36 to 6.47 dB), indicating higher values on average with TEMPO. For HFA vs VEE the mean difference was 0.94 dB (95% LoA −4.05 to 5.94 dB), indicating higher values on average with HFA.
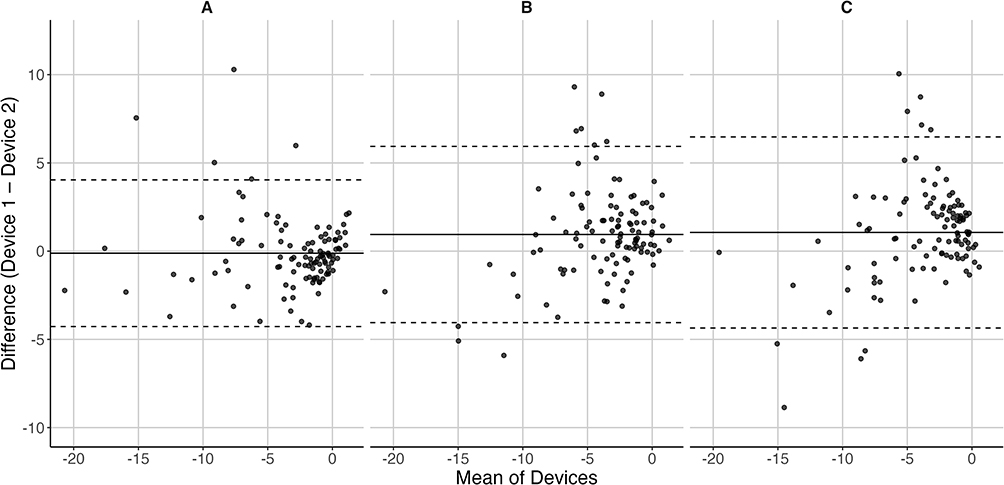 |
Figure 1 Bland-Altman plots comparing mean deviation (in dB) between the Humphrey Field Analyzer (HFA), TEMPO, and Virtual Eye ELITE (VEE) perimeters. (A) HFA vs TEMPO, (B) HFA vs VEE, and (C) TEMPO vs VEE. The dashed lines represent the 95% limits of agreement, and the solid lines represent the mean difference. |
Figure 2 summarizes the Bland-Altman analysis comparing pattern standard deviation between devices. The mean difference for HFA compared to TEMPO was −0.57 dB (95% LoA −4.75 to 3.62 dB) indicating higher values on average with TEMPO. For TEMPO vs VEE the mean difference was −0.27 dB (95% LoA −4.04 to 4.58 dB), indicating higher values on average with VEE. For HFA vs VEE the mean difference was −0.30 dB (95% LoA −4.38 to 3.79 dB), indicating higher values on average with VEE.
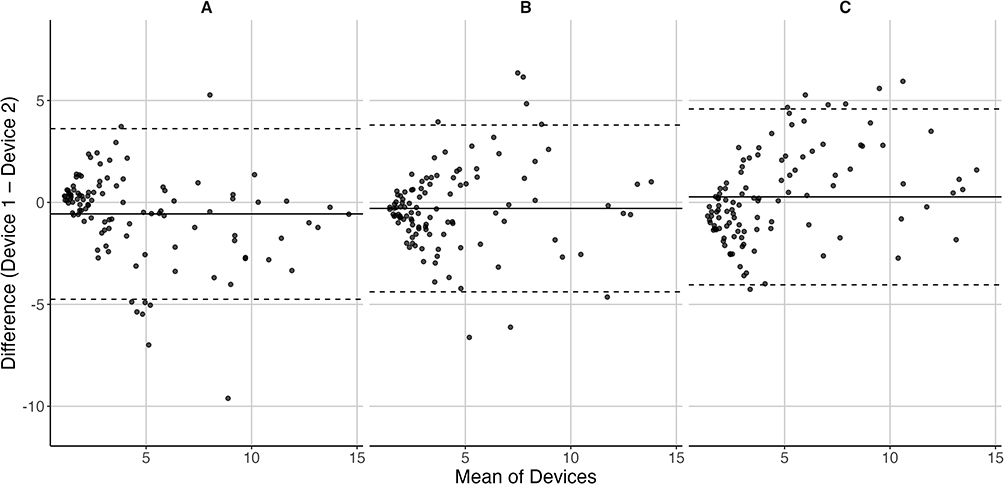 |
Figure 2 Bland-Altman plots comparing pattern standard deviation (in dB) between the Humphrey Field Analyzer (HFA), TEMPO, and Virtual Eye ELITE (VEE) perimeters. (A) HFA vs TEMPO, (B) HFA vs VEE, and (C) TEMPO vs VEE. The dashed lines represent the 95% limits of agreement, and the solid lines represent the mean difference. |
Figure 3 summarizes the Bland-Altman analysis comparing foveal threshold between devices. The mean difference for HFA compared to TEMPO was 3.31 dB (95% LoA −5.28 to 11.91 dB) indicating higher values on average with HFA. For TEMPO vs VEE the mean difference was 3.78 dB (95% LoA −8.48 to 16.04 dB), indicating higher values on average with TEMPO. For HFA vs VEE the mean difference was 7.09 dB (95% LoA −5.41 to 19.60 dB), indicating higher values on average with HFA.
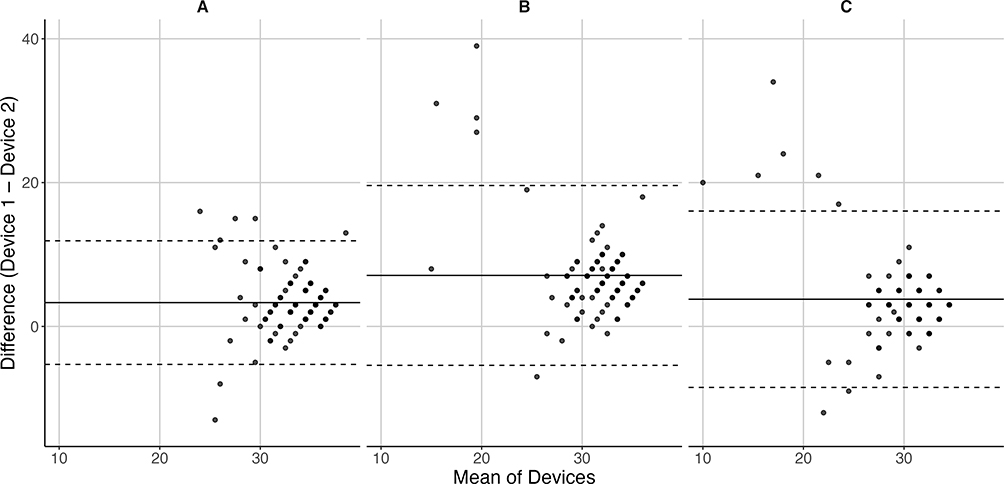 |
Figure 3 Bland-Altman plots comparing foveal threshold (in dB) between the Humphrey Field Analyzer (HFA), TEMPO, and Virtual Eye ELITE (VEE) perimeters. (A) HFA vs TEMPO, (B) HFA vs VEE, and (C) TEMPO vs VEE. The dashed lines represent the 95% limits of agreement, and the solid lines represent the mean difference. |
Figure 4 summarizes the Bland-Altman analysis comparing visual field index between devices. The mean difference for HFA compared to TEMPO was −0.36 (95% LoA −12.87 to 12.16 dB) indicating higher values on average with TEMPO. For TEMPO vs VEE the mean difference was −0.70 (95% LoA −21.10 to 19.71), indicating higher values on average with VEE. For HFA vs VEE the mean difference was −0.89 (95% LoA −18.96 to 17.19), indicating higher values on average with VEE.
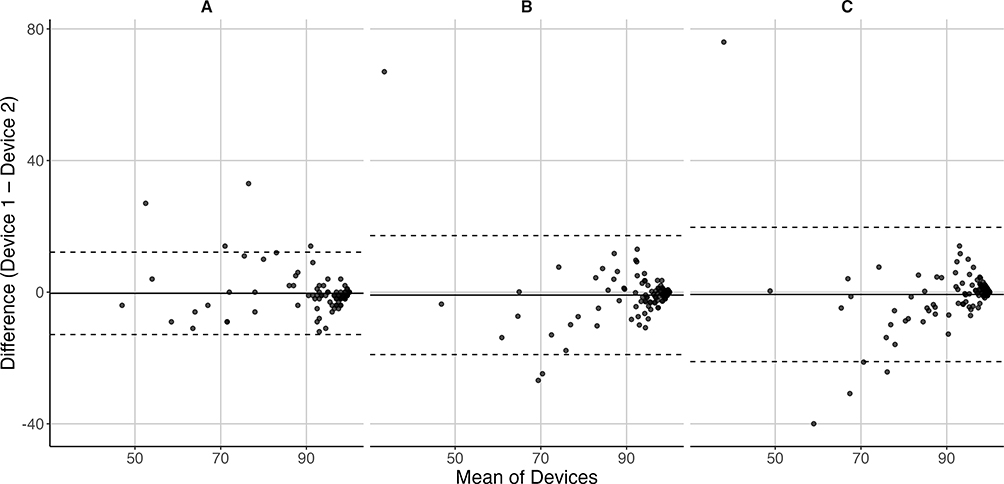 |
Figure 4 Bland-Altman plots comparing visual field index (in %) between the Humphrey Field Analyzer (HFA), TEMPO, and Virtual Eye ELITE (VEE) perimeters. (A) HFA vs TEMPO, (B) HFA vs VEE, and (C) TEMPO vs VEE. The dashed lines represent the 95% limits of agreement, and the solid lines represent the mean difference. |
Table 3 summarizes the results of the questionnaire. A significantly higher percentage of subjects reported agreement that the testing was “Easy” to perform with the TEMPO compared to HFA (p < 0.001), TEMPO compared to VEE (p = 0.006), and with VEE compared to HFA (p = 0.002). A significantly higher percentage of subjects reported agreement that the testing was more “Comfortable” to perform with the TEMPO compared to HFA (p < 0.001) and VEE compared to HFA (p < 0.001), but there was no significant difference between TEMPO and VEE (p = 0.14). There were no significant differences for the subject-reported responses on if the test caused anxiety between TEMPO and HFA (p = 0.16), TEMPO and VEE (p = 0.70), and HFA compared to VEE (p = 0.78).
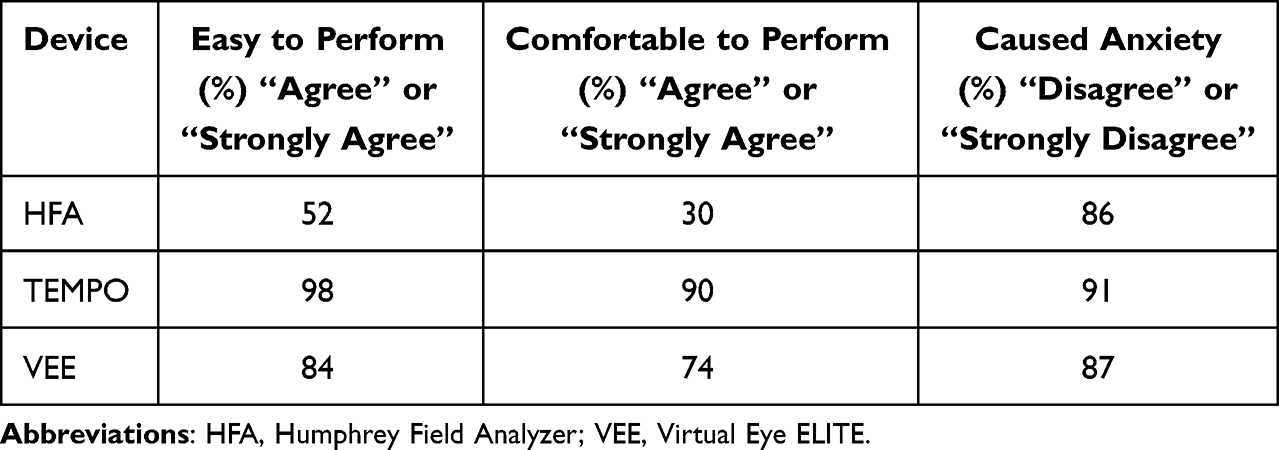 |
Table 3 Questionnaire About Perimetry Devices |
Mean visual field index was 91.3 ± 11.6% for HFA, 91.6 ± 12.5% for TEMPO, and 92.3 ± 12.5% for VEE. There were no significant differences for visual field index between TEMPO and HFA (p = 0.96), TEMPO and VEE (p = 0.77), and HFA compared to VEE (p = 0.64). Mean false positives with HFA (6.2 ± 7.8%) were significantly higher compared to TEMPO (1.7 ± 2.4%; p = 0.05), HFA and VEE (0.3 ± 0.8%; p < 0.001), and significantly higher with TEMPO compared to VEE (p < 0.001). Likewise, false negatives with HFA (5.7 ± 7.9%;) were significantly higher compared to TEMPO (0.6 ± 1.3%; p < 0.001), HFA and VEE (0.2 ± 0.5%; p < 0.001), but were not significantly different with TEMPO compared to VEE (p = 0.70).
Discussion
Technological advances in perimetry are attempting to overcome some of the limitations with SAP. In this study, we evaluated the test duration and the agreement of summary metrics between the TEMPO, VEE, HFA perimeters. To the best of our knowledge, this is the first study to compare these three devices to each other.
One of the major drawbacks of SAP is the clinical and patient time required for bilateral testing. We observed that the TEMPO was significantly faster to acquire bilateral visual fields compared to both HFA and VEE. This is not surprising, since the TEMPO is designed to test both eyes without breaks, while HFA and VEE test each eye sequentially. This should relate to less technician testing time in a clinical setting and increase clinic throughput. Nishida et al14 reported an average bilateral acquisition time of 4.34 minutes with the TEMPO and 7.15 minutes with HFA, similar to our study. In a separate study, Nishida et al12 observed an average bilateral acquisition time of 4.27 minutes with the TEMPO and 6.98 minutes with HFA, also similar to our study. Kang et al17 reported an average bilateral acquisition time of 3.7 minutes with the TEMPO and 5.3 minutes with HFA, faster than our study. We are not aware of any reports of comparisons between TEMPO and VEE. However, pilot data16 indicated an average bilateral acquisition time of 10.17 minutes with the VEE and 11.93 minutes with HFA, both longer than reported in our study.
Agreement between the HFA, TEMPO, and VEE perimeters in our study was reasonable, and there were no clinically significant differences for mean deviation or mean pattern standard deviation. Nishida et al12 reported good agreement between HFA and TEMPO with mean difference (95% LoA) of −0.1 (−3.8, 3.5) dB for mean deviation and −0.4 (−3.4, 2.5) dB for pattern standard deviation. This was similar to what we observed in our study. In addition, Nishida et al14 observed reasonable agreement between HFA and TEMPO, with mean difference (95% LoA) of −0.2 (−4.8, 4.3) dB for mean deviation and −0.6 (−4.7, 3.4) dB for pattern standard deviation. Finally, Kang et al17 reported a mean difference of 0.6 dB between HFA and TEMPO for mean deviation. We are not aware of any studies that compared the agreement between TEMPO and VEE, however, McLaughlin et al16 observed reasonable agreement between HFA and VEE.
It is important to note that the decibel scale is different with the VEE device compared to HFA and TEMPO. VEE is capable of luminance up to 120 cd/m2 on a 1 cd/m2 background,16 compared to 3183 cd/m2 max luminance on a 10 cd/m2 background for HFA and TEMPO. This has two implications. First, the maximum Weber contrast ([Lstimulus – Lbackground]/Lbackground) is nearly three times greater with HFA and TEMPO compared to VEE (317.3 vs 119). Second, VEE operates with a dimmer background, which is in the mesopic range, compared to the background in the photopic range for HFA and TEMPO. The different adaptation states can impact contrast detection.
Questionnaire responses in our study suggest that a higher percentage of patients found the TEMPO and VEE devices easy and comfortable to perform compared to HFA. Comparisons of our results to other studies are difficult, as there are no standardized or routine questionnaires used across studies. However, it is worthwhile to discuss other reports for context. For instance, McLaughlin et al14 observed that 84.2% and 89.5% of subjects reported VEE easy to use and comfortable, respectively, compared to 84% and 74% in our study. In addition, Freeman et al18 noted that 80.2% of subjects preferred the TEMPO (IMOVifa) over HFA at the final visit.
A limitation of our study was the exclusion of patients with severe glaucoma. This was due to expected poor reliability of measurements as most of these patients would have generalized depression on the visual field testing. However, this limits the generalizability of our results to all disease states. In addition, the study was powered for the primary endpoint, which limits the conclusions that can be drawn about MD, PSD, FT, and VFI agreement between devices. Conclusions are further hampered by the fact that reproducibility of measurements was not investigated. Finally, three sequential visual field exams may have been fatiguing to patients. Although device order was uniformly randomized to eliminate bias, patient fatigue could have impacted our results.
In conclusion, the results suggest similar summary metrics between the HFA, TEMPO, and VEE perimeters, and faster acquisition time with the TEMPO. These results also indicate the potential for streamlined clinical workflow. Future studies investigating longitudinal monitoring and cost-effectiveness are warranted.
Supporting its potential for clinical adoption and future studies evaluating longitudinal monitoring and cost-effectiveness.
Acknowledgment
Maryann Thomas, CRC from North Georgia Eye Associates assisted with data collection and data checking. Marco Miranda from Topcon Healthcare Inc. provided valuable feedback on earlier versions of this paper. This paper was presented at the 2025 American Society of Cataract and Refractive Surgery (ASCRS) Annual Meeting as a conference poster.
Funding
This study was supported with an investigator-initiated study grant from Topcon Healthcare Inc., Oakland, NJ, USA.
Disclosure
Dr Clayton Blehm reports grants from Topcon, outside the submitted work. Dr Brad Hall reports contractor fees from Topcon Healthcare Inc., outside the submitted work. The authors report no other conflict of interest for this work.
References
1. Ehrlich JR, Burke-Conte Z, Wittenborn JS, et al. Prevalence of glaucoma among US adults in 2022. JAMA Ophthalmol. 2024;142:1046–1053. doi:10.1001/jamaophthalmol.2024.3884
2. Tham YC, Li X, Wong TY, Quigley HA, Aung T, Cheng CY. Global prevalence of glaucoma and projections of glaucoma burden through 2040: a systematic review and meta-analysis. Ophthalmology. 2014;121:2081–2090. doi:10.1016/j.ophtha.2014.05.013
3. Hekmatjah N, Chibututu C, Han Y, Keenan JD, Oatts JT. Virtual reality perimetry compared to standard automated perimetry in adults with glaucoma: a systematic review. PLoS One. 2025;20:e0318074. doi:10.1371/journal.pone.0318074
4. Tan JCK, Yohannan J, Ramulu PY, et al. Visual field testing in glaucoma using the Swedish Interactive Thresholding Algorithm (SITA). Surv Ophthalmol. 2025;70:141–152. doi:10.1016/j.survophthal.2024.09.005
5. Scuderi GL, Cesareo M, Perdicchi A, Recupero SM. Standard automated perimetry and algorithms for monitoring glaucoma progression. Prog Brain Res. 2008;173:77–99.
6. Monsalve B, Ferreras A, Calvo P, et al. Diagnostic ability of Humphrey perimetry, Octopus perimetry, and optical coherence tomography for glaucomatous optic neuropathy. Eye. 2017;31:443–451. doi:10.1038/eye.2016.251
7. Roberti G, Manni G, Riva I, et al. Detection of central visual field defects in early glaucomatous eyes: comparison of humphrey and octopus perimetry. PLoS One. 2017;12:e0186793. doi:10.1371/journal.pone.0186793
8. Glen FC, Baker H, Crabb DP. A qualitative investigation into patients’ views on visual field testing for glaucoma monitoring. BMJ Open. 2014;4:e003996. doi:10.1136/bmjopen-2013-003996
9. Ahmed Y, Pereira A, Bowden S, et al. Multicenter comparison of the Toronto portable perimeter with the humphrey field analyzer: a pilot study. Ophthalmol Glaucoma. 2022;5:146–159. doi:10.1016/j.ogla.2021.07.011
10. Kimura T, Matsumoto C, Nomoto H. Comparison of head-mounted perimeter (imo((R))) and humphrey field analyzer. Clin Ophthalmol. 2019;13:501–513. doi:10.2147/OPTH.S190995
11. Patella VM, El-Nimri NW, Flanagan JG, et al. Reference database for a novel binocular visual function perimeter: a randomized clinical trial. Ophthalmol Sci. 2024;4:100583. doi:10.1016/j.xops.2024.100583
12. Nishida T, Eslani M, Weinreb RN, et al. Perimetric comparison between the IMOvifa and humphrey field analyzer. J Glaucoma. 2023;32:85–92. doi:10.1097/IJG.0000000000002134
13. Arias JD, Chopra R, Durbin MK, et al. Validation of a novel suprathreshold strategy for screening visual function. J Clin Med. 2025;14:1526. doi:10.3390/jcm14051526
14. Nishida T, Weinreb RN, Arias J, Vasile C, Moghimi S. Comparison of the TEMPO binocular perimeter and humphrey field analyzer. Sci Rep. 2023;13. doi:10.1038/s41598-023-48105-5
15. Sethi S, Pocari G. Exploring head-mounted virtual visual fields for glaucoma: how do they stack up against humphrey tests? TNOA J Ophthalmic Sci Res. 2024;62:301–310. doi:10.4103/tjosr.tjosr_85_24
16. McLaughlin DE, Savatovsky EJ, O’Brien RC, et al. Reliability of visual field testing in a telehealth setting using a head-mounted device: a pilot study. J Glaucoma. 2024;33:15–23. doi:10.1097/IJG.0000000000002290
17. Kang JY, Silva RNE, Kim JA, et al. Comparison of structure-function correlation among IMO visual function analyser and humphrey field analyser. Br J Ophthalmol. 2025;109:1005–1011. doi:10.1136/bjo-2023-324846
18. Freeman SE, De Arrigunaga S, Kang J, et al. Participant experience using novel perimetry tests to monitor glaucoma progression. J Glaucoma. 2023;32:948–953.
 © 2025 The Author(s). This work is published and licensed by Dove Medical Press Limited. The
full terms of this license are available at https://www.dovepress.com/terms
and incorporate the Creative Commons Attribution
- Non Commercial (unported, 4.0) License.
By accessing the work you hereby accept the Terms. Non-commercial uses of the work are permitted
without any further permission from Dove Medical Press Limited, provided the work is properly
attributed. For permission for commercial use of this work, please see paragraphs 4.2 and 5 of our Terms.
© 2025 The Author(s). This work is published and licensed by Dove Medical Press Limited. The
full terms of this license are available at https://www.dovepress.com/terms
and incorporate the Creative Commons Attribution
- Non Commercial (unported, 4.0) License.
By accessing the work you hereby accept the Terms. Non-commercial uses of the work are permitted
without any further permission from Dove Medical Press Limited, provided the work is properly
attributed. For permission for commercial use of this work, please see paragraphs 4.2 and 5 of our Terms.
Recommended articles
Effects of Stimulus Luminance, Stimulus Color and Intra-Stimulus Color Contrast on Visual Field Mapping in Neurologically Impaired Adults Using Flicker Pupil Perimetry
Portengen BL, Porro GL, Bergsma D, Veldman EJ, Imhof SM, Naber M
Eye and Brain 2023, 15:77-89
Published Date: 2 June 2023
An Electronic Frailty Index Based on Deficit Accumulation May Predict Glaucomatous Visual Field Progression
Duy W, Pajewski N, Williamson JD, Thompson AC
Clinical Ophthalmology 2025, 19:387-393
Published Date: 5 February 2025
Virtual Reality Visual Field Testing in Glaucoma: Benefits and Drawbacks
Babel AT, Soumakieh MM, Chen AY, Wong C, R da Costa D, Almeida DR
Clinical Ophthalmology 2025, 19:933-937
Published Date: 17 March 2025
Peripherex Home Visual Field Demonstrates High Test-Retest Reliability, Validity
Schweitzer J, Ibach M, Berdahl J, Daoud M, Daoud YA, Kempinski Y, Goldberg JL
Clinical Ophthalmology 2025, 19:1877-1884
Published Date: 17 June 2025
Comparative Evaluation of VisuALL Virtual Reality Perimetry and Humphrey Visual Field Testing in Glaucoma Patients
Weng PJ, Asrani S, Wen JC
Clinical Ophthalmology 2026, 20:599752
Published Date: 18 May 2026