Back to Journals » Clinical Ophthalmology » Volume 20
Comparative Evaluation of VisuALL Virtual Reality Perimetry and Humphrey Visual Field Testing in Glaucoma Patients
Authors Weng PJ, Asrani S, Wen JC ![]()
Received 25 February 2026
Accepted for publication 14 April 2026
Published 18 May 2026 Volume 2026:20 599752
DOI https://doi.org/10.2147/OPTH.S599752
Checked for plagiarism Yes
Review by Single anonymous peer review
Peer reviewer comments 2
Editor who approved publication: Dr Sotiria Palioura
Peter J Weng, Sanjay Asrani, Joanne C Wen
Duke Eye Center, Duke University, Durham, NC, USA
Correspondence: Joanne C Wen, Duke Eye Center, Duke University, Durham, NC, USA, Email [email protected]
Purpose: To compare virtual reality (VR) perimetry with perimetry conducted using the Humphrey visual field (HVF).
Materials and Methods: A retrospective, single-center study was conducted on patients with diagnoses of: ocular hypertension, glaucoma suspect, or glaucoma who had both HVF and VR 24– 2 visual field testing performed as a part of their routine eye examination. Results from both devices were compared on: test duration, test preference, mean deviation (MD), pattern standard deviation (PSD), and point-by-point sensitivity.
Results: Seventy-nine eyes were evaluated from 50 patients with a mean age of 72.1 ± 11.8 years. Of the 79 eyes, 8 had ocular hypertension or were glaucoma suspects, 24 had mild glaucoma, 28 had moderate glaucoma, and 19 had severe glaucoma. The average test duration by HVF was significantly greater (HVF: 253 ± 65 sec vs. VR: 122 ± 6 sec, p < 0.001). Strong correlations for both MD (r = 0.82, p < 0.001) and PSD (r = 0.85, p < 0.001) were observed between HVF and VR perimetry. Point-by-point evaluation did not detect systematic differences in sensitivity between HVF and VR perimetry. Of the 48 patients who completed both tests, 41 (85.4%) indicated a preference for VR perimetry and 7 (13.6%) felt neutral between VR perimetry and HVF.
Conclusion: These findings demonstrate that results from HVF and VR perimetry may be comparable. While a majority of the patients preferred VR perimetry, additional studies will be necessary to assess whether VR perimetry can serve as a useful adjunct in monitoring glaucoma.
Keywords: glaucoma, perimetry, virtual reality
Introduction
Visual field testing is an essential component of glaucoma monitoring and management, and the development of standard automated perimetry through the Humphrey Visual Field (HVF) analyzer in the 1980s allowed for reliable and standardized testing to be performed in glaucoma clinics.1 Since its introduction, HVF has remained the clinical standard in visual field testing.
While HVF testing is essential to monitor for functional progression of glaucoma, routine use of perimetry in glaucoma monitoring remains low. A recent study using the TruvenHealth Commercial Claims Database found that only 25% of individuals with open-angle glaucoma adhered to guideline recommendations for glaucoma monitoring,2 with most having fewer than one visual field test per year.3 While low adherence to visual field testing is multifactorial, it could partly be attributed to the fact that patients describe this test as one of the most laborious and time-consuming elements of glaucoma monitoring.4
To make visual field testing more appealing, virtual reality (VR) technologies have been adopted into perimetry evaluation. VR systems rely on a headset that obstructs ambient lighting to allow the user to focus solely on the digital display inside the headset. This provides a distinct advantage for patients who are unable to position themselves into the HVF analyzer by allowing them to be more comfortably seated.5,6 Additionally, cameras inside the headset can track eye movements, allowing for continuous monitoring for changes in fixation.7,8 Moreover, a few reports have documented that compared to HVF, the length of VR perimetry testing is significantly reduced.9–11 Given these distinct advantages, we sought to compare how VR perimetry, using the VisuALL system (Olleyes, Summit, NJ), compared to HVF in a cohort of patients with varying stages of glaucoma.
Materials And Methods
This retrospective cohort study was performed for a single outpatient glaucoma clinic in the Duke University Health System. The study was approved by the Institutional Review Board at Duke University for review between September 2023 and March 2024 (Pro00115355), and adhered to all tenets of the Declaration of Helsinki. The requirement of informed consent was waived by the Institutional Review Board at Duke University as this study was retrospective. Patient confidentiality was maintained by limiting access to patient records to study team members directly involved with data collection. All collected data was stored in a password protected file and deidentified prior analysis. Patients over the age of 18 with a diagnosis of either ocular hypertension, glaucoma suspect, or glaucoma who received both HVF and VR perimetry testing were identified for the study (97 eyes from 58 individuals). Eyes were considered to have glaucoma if they had diffuse or localized signs of glaucomatous damage to the optic nerve or at least 2 prior abnormal visual field tests, and the diagnosis was made by a glaucoma specialist (SA and JW), with staging determined according to the Hodapp-Parrish-Anderson grading criteria.12 Additional variables collected by chart review included co-morbid ocular conditions, sex, age, and visual acuity. Eyes were excluded from the study if they had other ocular pathology that could affect visual field testing, including diagnoses of posterior staphyloma, age-related macular degeneration, or proliferative diabetic retinopathy. In addition, eyes where greater than 6 months had elapsed between HVF and VR perimetry were excluded due to the concern for possible disease progression between the two perimetry tests. Of the 79 eyes that were included in the study, 7 were collected on separate days, with a mean difference between dates of HVF and VR perimetry of 12 days.
Perimetry Protocols
The 24–2 SITA Fast protocol (white, stimulus size: Goldmann III) was employed on the HVF analyzer (ZEISS, Dublin, CA, USA). The AVA (American Virtual Algorithm) Fast protocol (white, stimulus size: Goldman III) was run on the VisuALL head-mounted VR display. Details regarding VR perimetry testing on the VisuALL have been described in detail in previous studies.6,13,14 In this study, headsets were calibrated per manufacturer specifications, and the software conducts a calibration process prior to each test.6 The testing strategy used on the VisuALL perimetry device was the AVA Fast, a proprietary strategy developed by Olleyes that assesses 50 locations across the central 24 degrees of vision, that was developed based on the SITA fast protocol. Background luminescence of VR display was 3 cd/m2, compared with 10 cd/m2 for HVF and the dynamic range was 3–120 cd/m2 for the VR display and 10–3183.1 cd/m2 for HVF. VR perimetry on the VisuALL also utilizes a dynamic matrix, which enables the matrix of points in the perimetry test to move along with the individual’s point of fixation, using a Tobii eye tracking system. Visual field testing was deemed unreliable when fixation losses (FL) were over 20%.
All patients in the study performed perimetry testing in the clinic on the HVF analyzer prior to the VisuALL head-mounted VR display. If tests were performed on the same day, patients were given at least 5-minutes of eye rest in order to prevent testing fatigue. After the completion of both tests, patients reported a favorability rating between the two devices: preferred VR perimetry, neutral, or preferred HVF.
Statistical Analysis
Parameters of perimetry evaluated consisted of mean deviation (MD), pattern standard deviation (PSD), test duration (in seconds), and threshold sensitivity for the 52 points that were tested. Spearman’s rank correlation was used to evaluate the relationship between both devices for MD and PSD. MD, PSD, and test duration were compared between glaucoma stages using a one-way ANOVA with Tukey post-hoc comparisons. Each point for threshold sensitivity was mapped to the corresponding location in the visual field such that points from both left and right eyes can be treated equally for evaluation, as previously described.15,16 Point-by-point comparison between HVF and VR perimetry was performed for the entire population, as well as for each stage of glaucoma (no glaucoma, mild, moderate, and severe). Bland–Altman plots were created to visualize differences between perimetry devices and evaluate the relationship between the two testing modalities. Unpaired, 2-tailed t-tests were performed for each point to evaluate for significant differences between devices.
Reliability metrics, including: fixation losses, false positives, false negatives, were also compared between both devices. Fixation losses for HVF were calculated using the Heijl–Krakau method (presenting a stimulus into the blind spot area), while fixation losses for VR perimetry were calculated as the percentage of time where the eye’s fixation point could not be tracked by eye-tracking cameras (ie greater than 15 degrees from the recommended fixation point). False negatives for VR perimetry were evaluated at either 4 or 5 locations, while the number of locations that are evaluated for HVF for false negatives is not reported. Fixation losses, false positives, and false negatives were compared between HVF and VR perimetry using a Mann Whitney U-test. All statistical tests were performed in R Statistical Software (v4.1.2, R Core Team 2021). A p-value of 0.05 was selected for statistical significance, unless otherwise stated.
Results
Seventy-nine eyes of 50 patients, with a mean age of 72.3 ± 11.5 years, were included in this study. Of the 79 eyes, the average best corrected visual acuity in logMAR was 0.21 ± 0.21. For the entire cohort, there was no statistically significant difference between MD (HVF: −6.8 ± 6.7 dB vs VR: −6.0 ± 6.6 dB, p = 0.46) or PSD (HVF: 5.6 ± 3.9 dB vs VR: 6.3 ± 3.7 dB, p = 0.26) between the two devices. On average, duration of VR perimetry testing was significantly shorter than HVF perimetry testing (HVF: 253 ± 65 sec vs VR: 122 ± 6 sec, p < 0.001, Table 1). Test duration on the HVF increased with increasingly advanced glaucoma. Test duration was significantly longer for eyes with either moderate (258 ± 57 sec) or severe glaucoma (317 ± 48 sec) compared to mild glaucoma (197 ± 35 sec, p < 0.001) on the HVF. In contrast, no significant difference in time was noted between glaucoma stages on testing performed by VR perimetry (mild glaucoma: 121 ± 2 sec, moderate glaucoma: 122 ± 4 sec, severe glaucoma: 120 ± 2 sec, p = 0.14, Table 1).
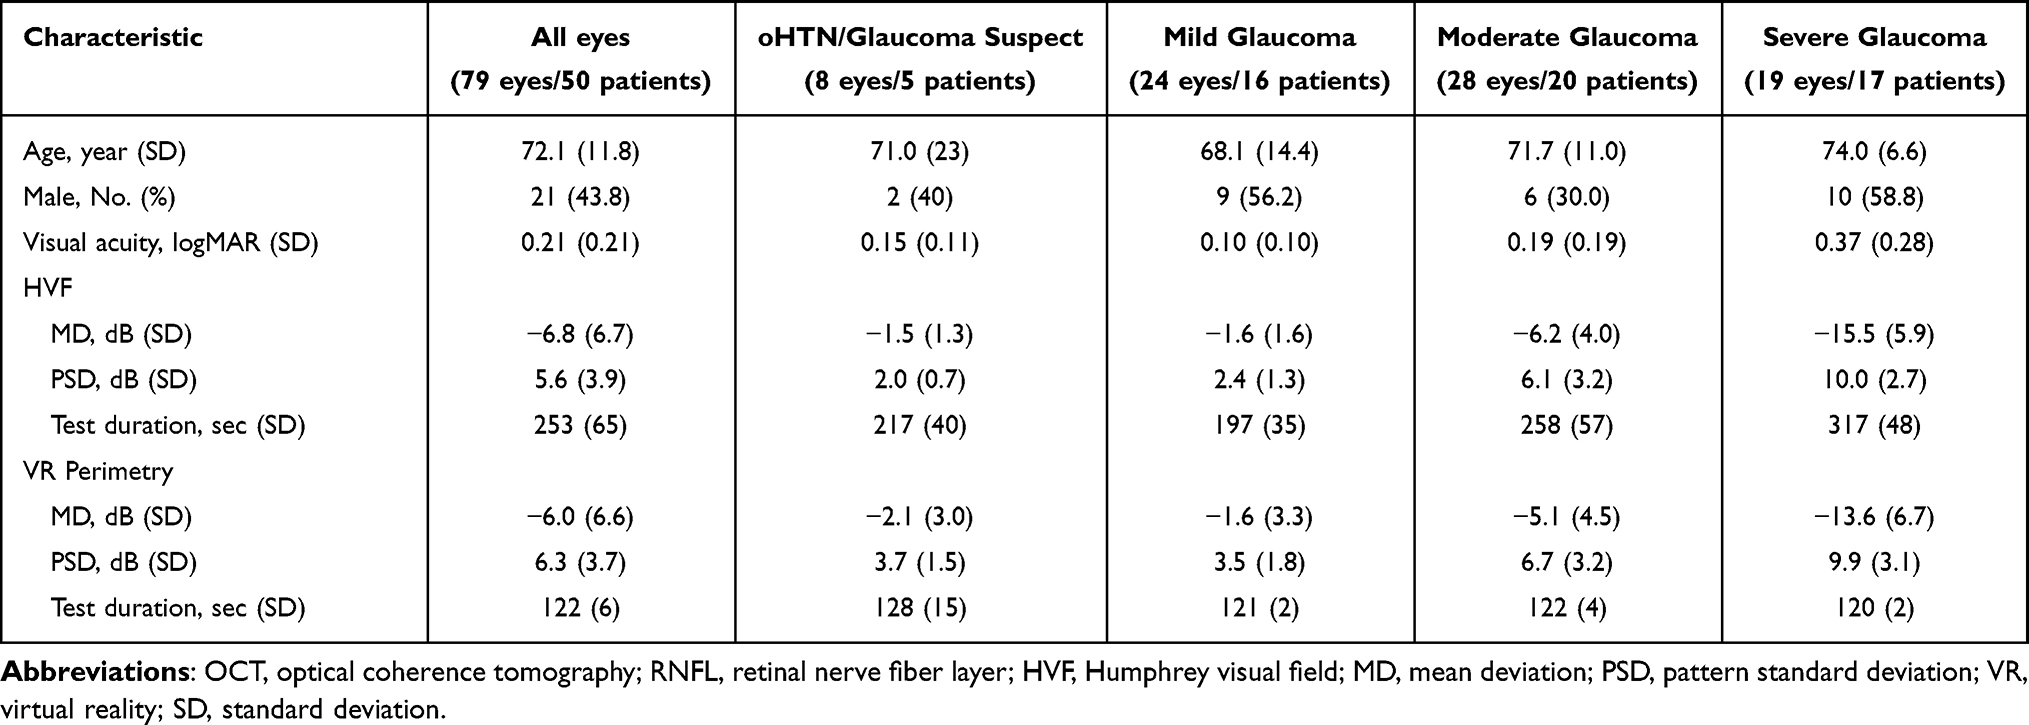 |
Table 1 Patient Characteristics by Glaucoma Stage |
When evaluating across all eyes, there was a strong correlation between HVF and VR perimetry for both MD (R = 0.82, p < 0.001, Figure 1A) and PSD (R = 0.85, p < 0.001, Figure 1B). For the HVF, as expected, MD in eyes with either moderate (−6.2 ± 4.0 dB) or severe (−15.5 ± 5.9 dB) glaucoma was significantly different from MD in eyes with mild glaucoma (−1.6 ± 1.6 dB, p < 0.001). Similarly, for VR perimetry, MD in eyes with either moderate (−5.1 ± 4.5 dB) or severe (−13.6 ± 6.7 dB) glaucoma was significantly lower compared to eyes with mild glaucoma (−1.6 ± 3.3 dB, p = 0.05). In addition, eyes with either moderate or severe glaucoma had significantly greater PSD values when compared against mild glaucoma on both devices (p < 0.001 for all pairwise comparisons, Table 1).
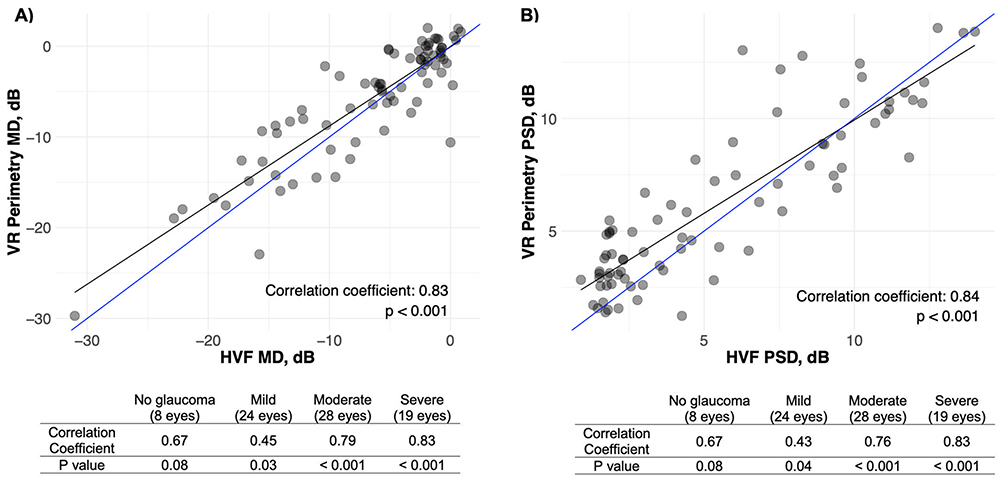 |
Figure 1 Scatterplots depicting the correlation in (A) mean deviation (MD) and (B) pattern standard deviation (PSD) between virtual reality (VR) 24–2 perimetry and Humphrey Visual Field (HVF) 24–2 perimetry. Blue line represents perfect correlation between VR and HVF perimetry. Black line depicts the line of best fit. Tables that depict the correlations based on glaucoma severity are below the respective scatterplots. |
Representative images are presented from eyes with mild, moderate, and severe glaucoma are depicted in Figure 2. Point-by-point sensitivity was performed to assess for systematic or loci-specific discrepancies between HVF and VR perimetry. Bland Altman analysis was performed across all points and shows that VR perimetry has a negligible increase in sensitivity (0.95 ± 6.4 dB, Figure 3A). Pairwise comparison for each of the 52 points evaluated by 24–2 perimetry was conducted, and the mean sensitivity difference for each point that was assessed depicts differences that range from −0.4 to +3.1 dB, with no statistically significant difference noted at any particular point (Figure 3B). When evaluating across different glaucoma stages, variability increased without significant differences in mean sensitivity between devices (mean sensitivities relative to HVF for: glaucoma suspect or ocular hypertension: −0.04 ± 4.0 dB, mild glaucoma: 0.24 ± 4.9 dB, moderate glaucoma: 1.3 ± 6.9 dB, and severe glaucoma: 1.6 ± 7.6 dB, Figure 4).
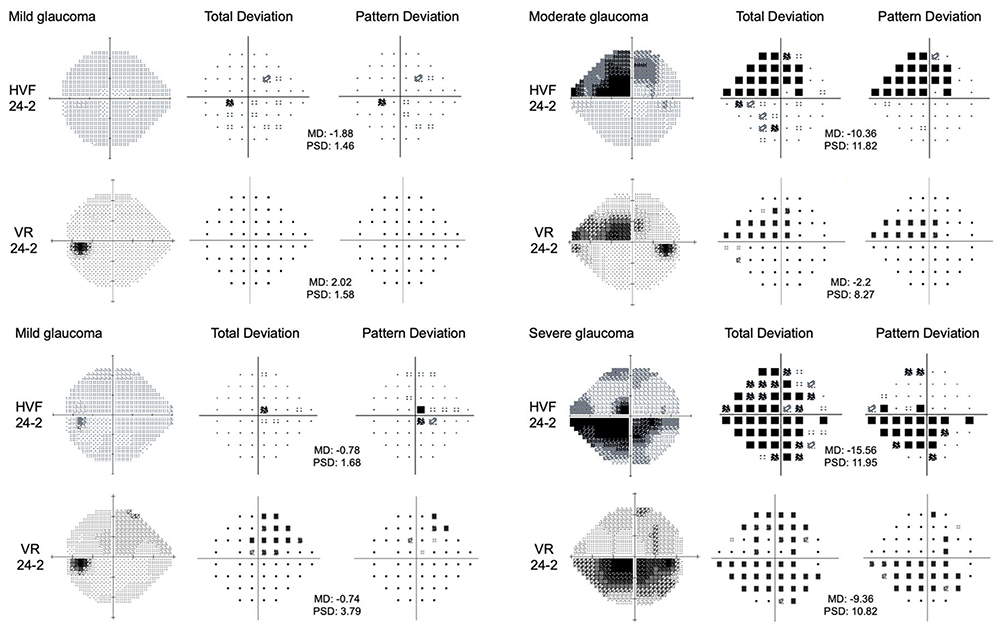 |
Figure 2 Examples of Humphrey (HVF) and virtual reality (VR) visual fields from eyes with mild, moderate, and severe-stage primary open angle glaucoma. From left-to-right: grayscale, total deviation, and pattern deviation plots for each eye. |
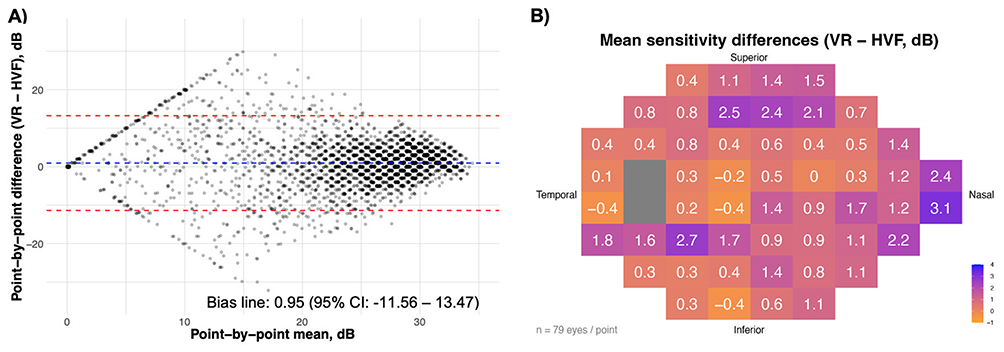 |
Figure 3 Point-by-point sensitivity collected on Humphrey Visual Field (HVF) and virtual reality (VR) 24–2 perimetry testing. (A) Bland-Altman analysis, where the blue dotted line indicates the mean point-by-point difference, while red dotted lines represent 95% confidence interval of the mean point-by-point difference. Darker areas signify overlapping points with regards to point-by-point mean and difference. (B) Mean sensitivity difference between VR and HVF mapped at each point. While the visual representation depicts the left eye, data from both eyes are included. Points from the right eye were mapped according to their corresponding visual field location. Gray boxes represent the blind spot on either HVF or VR testing. |
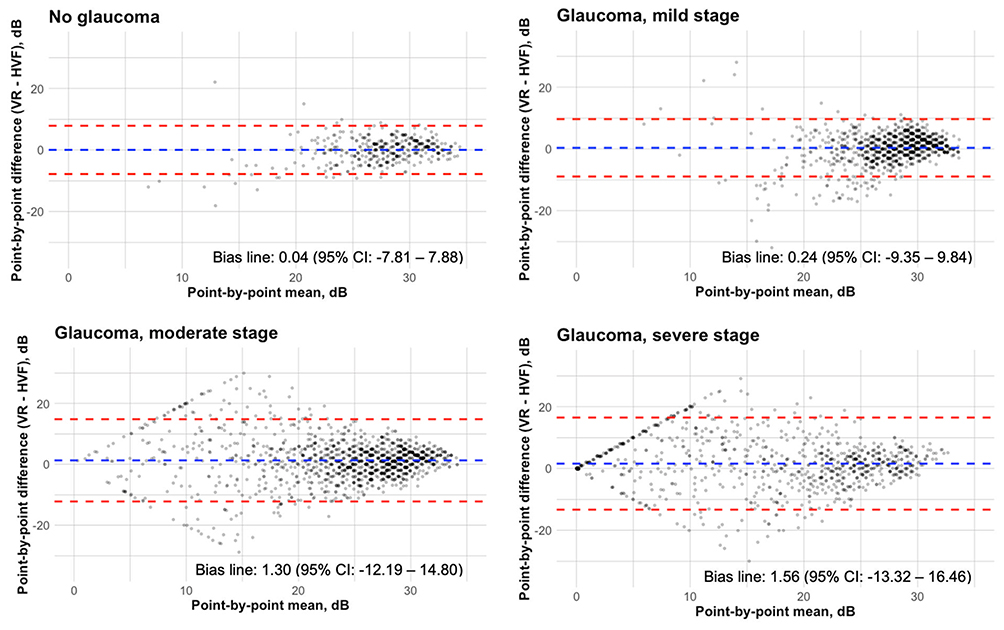 |
Figure 4 Bland-Altman analysis of point-by-point sensitivity by glaucoma severity. Blue dotted line indicates mean point-by-point difference, and red lines represent 95% confidence interval of the mean point-by-point difference. Increasing dot color intensity signifies increased number of overlapping points with regards to point-by-point mean and difference. |
One feature that is unique to VR perimetry, compared to HVF, is the ability to utilize a dynamic matrix of points for the 24–2 testing that moves based on an individual’s fixation point. This dynamic perimetry testing has been proposed to improve testing reliability in patients with high fixation losses (FLs). Visual field testing is traditionally deemed unreliable when FLs are over 20%.17 In our study, 18 eyes had FLs > 20% on HVF (Table 2). In these eyes, FLs are significantly lower in VR perimetry compared to HVF (HVF FLs: 46.3% ± 23.7% vs VR perimetry FLs: 0.6% ± 1.0%, p < 0.01), likely owing to the eye-tracking on the VR device. When comparing the two devices, although the false-negative rate was higher on VR perimetry, it was highly variable and no statistically significant difference was noted, when compared to HVF. In contrast, the false-positive rate was significantly higher on HVF compared to VR perimetry in eyes with less than 20% FLs, suggesting that the VR perimetry device may have higher specificity than HVF in these eyes (Table 2). At the end of the examination, participants were queried on their preference between the two devices. Notably, no patients preferred HVF over the VR perimetry, 14% were neutral, and 86% preferred the VR perimetry (Table 2).
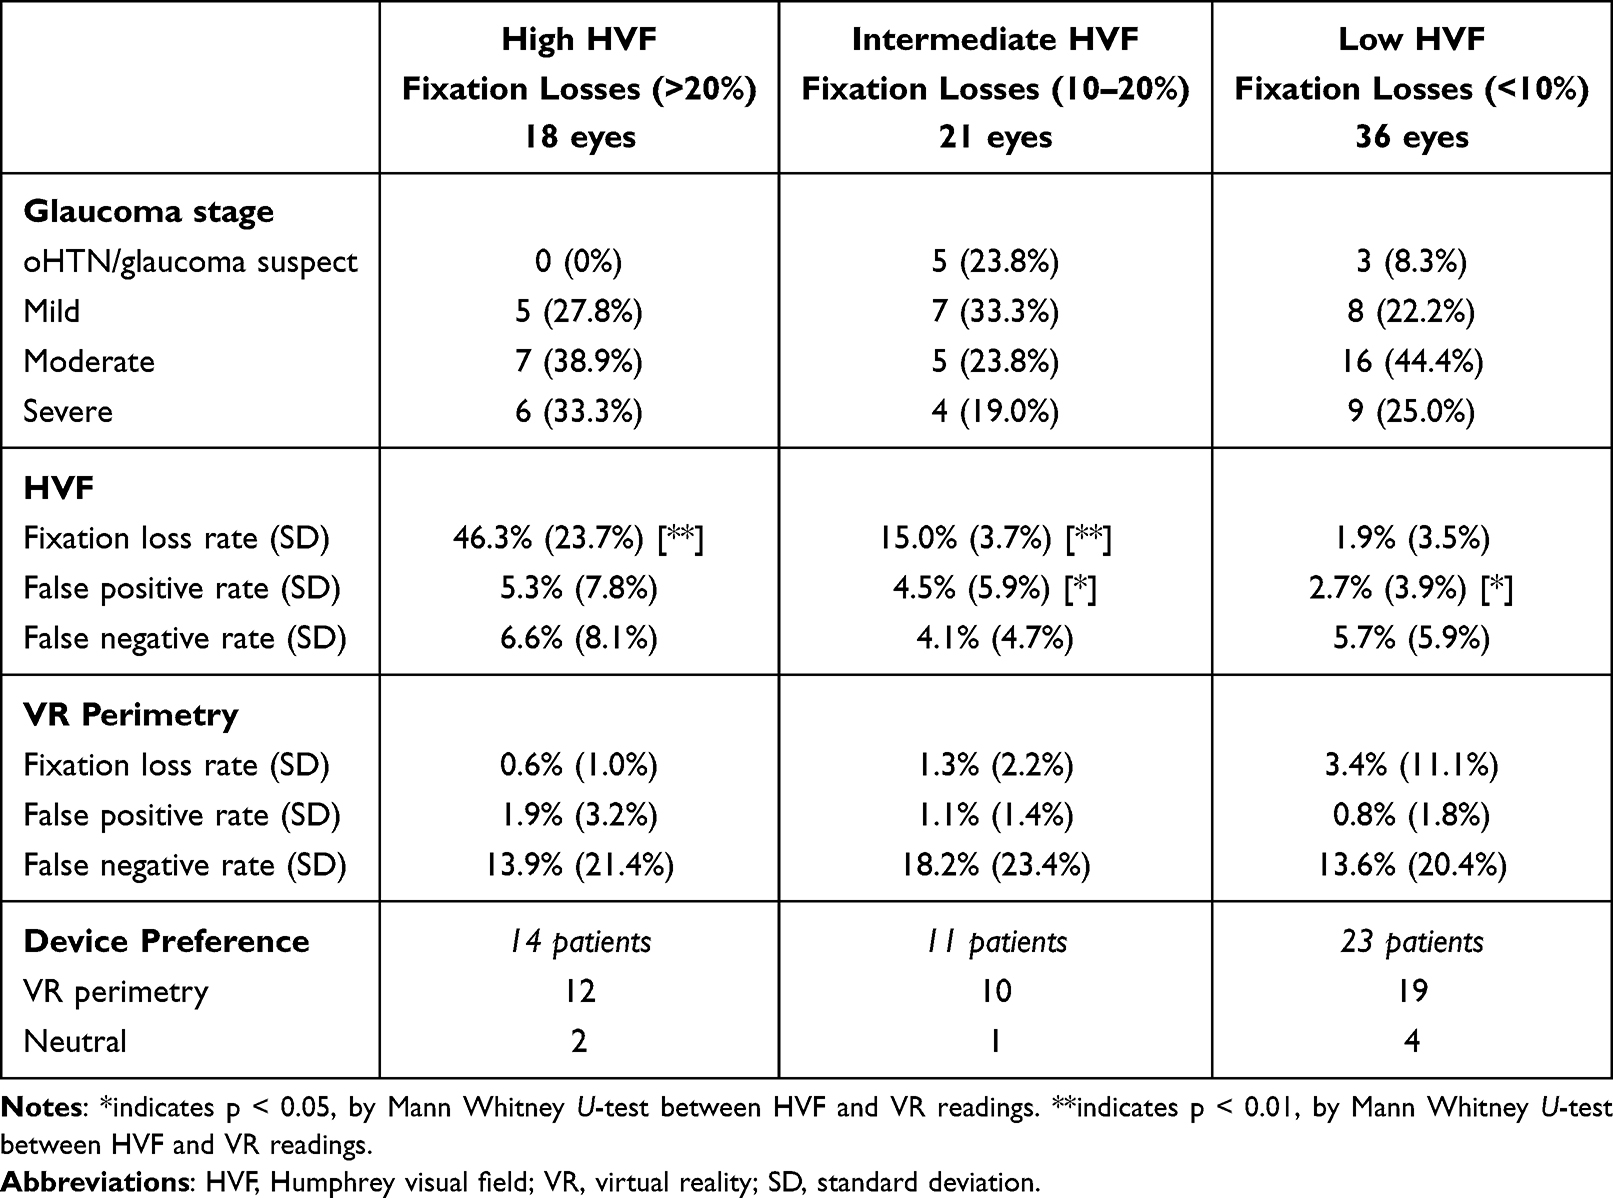 |
Table 2 Evaluating Visual Field Reliability & Preferences |
Discussion
In this study, we found that VR perimetry, using the VisuALL analyzer, was strongly correlated with HVF perimetry on both overall metrics and point-by-point analysis. Our study adds to the growing literature evaluating the utility of VR perimetry in both clinics and at home.10,15,18,19 In addition, the pathology in eyes from our cohort ranged from glaucoma suspect or ocular hypertension to severe glaucoma, allowing for a comparison between the two devices at different glaucoma stages as well as in eyes without glaucoma.
Neither MD or PSD significantly differed between HVF and VR perimetry across any stage of glaucoma, which is consistent with prior reports from earlier this year that compared the two devices in patients with either glaucoma or ocular hypertension.15,19 The test duration was significantly shorter across all stages of glaucoma for VR perimetry. Furthermore, as severity of glaucoma progressed from mild to severe, length of testing increased by an average of nearly two minutes on HVF testing, while remaining unchanged on VR perimetry testing. This is due to the fact that VR perimetry on the VisuALL analyzer provides each eye its own unique display,13 such that the device can rapidly alternate testing between left and right eyes and saves time that would be needed to patch the eyes and re-position the patient between eyes on the HVF analyzer.
Point-by-point analysis was also performed to evaluate for more subtle differences between the two devices. Of note, variability for threshold sensitivity between the two devices was greater in patients with moderate and severe glaucoma compared to individuals with mild glaucoma or had ocular hypertension or were glaucoma suspects. Given that patients with more severe glaucoma had a greater number of points with low sensitivity to stimuli, this was to be expected. However, the mean difference in threshold sensitivity across all points was not significantly different between HVF and VR perimetry, corroborating the findings seen for MD. Taking into consideration the good correlation for HVF and VR perimetry on global metrics and the significant time savings with VR perimetry for individuals with severe glaucoma, it may be worthwhile to monitor these individuals with VR perimetry. VR perimetry may be particularly beneficial in busy glaucoma clinics that may opt to prolong intervals of visual field testing due to time or operational constraints.
In VR perimetry on the VisuALL analyzer, dynamic eye tracking is utilized to account for fixation drifts, dramatically reducing the reported number of FLs. Interestingly, the number of false positives on the VR perimetry device was significantly lower in tests of individuals with that did not have poor reliability (ie, individuals with less than 20% FLs).17 Compared to glaucoma testing with optical coherence tomography (OCT), perimetry testing by HVF has been shown to induce greater levels of anxiety.20,21 It is possible that the anxiety associated with HVF is associated with a greater degree of false positives, as participants may press on the trigger even in the absence of stimuli. While strictly observational, given that patients have a lower rate of false positives on VR perimetry and largely prefer the VR perimetry testing, it could be inferred that VR perimetry is less anxiety-provoking relative to standard automated perimetry using the HVF. In contrast to false positives, the algorithm for false negatives on VisuALL may differ from that on HVF, and an exact interpretation of these findings is challenging. A follow-up study with a larger sample size is warranted to confirm our findings that VR perimetry appears to have fewer false positives and a higher specificity when compared to HVF in eyes with less than 20% FLs on HVF.
While this study demonstrated a strong correlation between global testing metrics (MD and PSD) between VR perimetry by the VisuALL analyzer and the HVF analyzer, it is subject to several limitations. This study had a rather modest sample size due to the fact that all patients were evaluated at a single site. While the sample size of the study is comparable with other single-center studies comparing VR perimetry and HVF,11,15,19 future studies that compile the results from these individual studies will be needed to improve the generalizability of these findings. In addition, due to its retrospective nature, this study was unable to randomize the order in which VR perimetry and HVF were performed. In all eyes, HVF was performed prior to VR perimetry, leading to an order effect that may have introduced either learning or fatigue bias in the VR perimetry testing. Furthermore, no eyes in this study had multiple tests with the VR perimetry device, preventing the ability to assess for re-test repeatability.
Apart from limitations in study design, it is important to recognize the inherent distinctions between the VR perimetry device and the HVF. First, the dynamic range between the two devices is an order of magnitude different (3–120cd/m2 for VR perimetry and 10–3183.1 cd/m2 for HVF), and eyes with decreased contrast sensitivity would have less sensitive test results on VR perimetry compared to HVF. While threshold values from VR perimetry and HVF are both reported as dB, given the differences in dynamic range, these values may not be directly comparable. While the number of FLs is traditionally a key reliability metric, VR perimetry combines eye tracking with the movement of the matrix of 24–2 points, leading to a substantially reduced number of reported fixation losses. Finally, while the AVA Fast protocol offers substantial time saving compared to the SITA Fast protocol, a recent single-center study demonstrated that the AVA Fast protocol on this VR perimetry device only found moderate correlations in their ability to detect localized visual field defects.22 Future studies will be needed to determine whether there is systematic under-detection of localized visual field defects by VR perimetry. While specific patterns of visual field loss were not evaluated in our study, there did not appear to be a systematic decline in point-by-point sensitivity in the VR perimetry device in this study.
Nevertheless, the results from this study generally support existing literature that VR perimetry by the VisuALL analyzer correlates well with testing on the HVF analyzer. As such, VR perimetry may be used in glaucoma management, particularly in circumstances where access to a HVF analyzer is challenging either due to physical or operational constraints. While this study only evaluated perimetry testing at a single time point, glaucoma management is highly dependent on the ability to monitor disease progression. As such, future studies that evaluate how these VR perimetry track visual field changes over longer periods of time will be a critical in determining whether VR perimetry can serve as an effective adjunct to glaucoma monitoring and management.
Funding
There is no funding to report.
Disclosure
The authors report no conflicts of interest in this work.
References
1. Beck RW, Bergstrom TJ, Lighter PR. A clinical comparison of visual field testing with a new automated perimeter, the humphrey field analyzer, and the goldmann perimeter. Ophthalmology. 1985;92(1):77–9. doi:10.1016/S0161-6420(85)34065-4
2. Gedde SJ, Vinod K, Wright MM, et al. Primary open-angle glaucoma preferred practice pattern®. Ophthalmology. 2021;128(1):P71–P150. doi:10.1016/j.ophtha.2020.10.022
3. Stagg BC, Stein JD, Medeiros FA, et al. The frequency of visual field testing in a us nationwide cohort of individuals with open-angle glaucoma. Ophthalmol Glaucoma. 2022;5(6):587–593. doi:10.1016/j.ogla.2022.05.002
4. Glen FC, Baker H, Crabb DP. A qualitative investigation into patients’ views on visual field testing for glaucoma monitoring. BMJ Open. 2014;4(1):e003996. doi:10.1136/bmjopen-2013-003996
5. Tsapakis S, Papaconstantinou D, Diagourtas A, et al. Visual field examination method using virtual reality glasses compared with the Humphrey perimeter. Clin Ophthalmol. 2017;11:1431–1443. doi:10.2147/OPTH.S131160
6. Montelongo M, Gonzalez A, Morgenstern F, Donahue SP, Groth SL. A virtual reality-based automated perimeter, device, and pilot study. Transl Vis Sci Technol. 2021;10(3):20. doi:10.1167/tvst.10.3.20
7. Wroblewski D, Francis BA, Sadun A, Vakili G, Chopra V. Testing of visual field with virtual reality goggles in manual and visual grasp modes. BioMed Res Int. 2014;2014(1):206082. doi:10.1155/2014/206082
8. Clay V, König P, König S. Eye tracking in virtual reality. J Eye Mov Res. 2019;12(1). doi:10.16910/jemr.12.1.3
9. Wang B, Alvarez-Falcón S, El-Dairi M, Freedman SF. Performance of virtual reality game-based automated perimetry in patients with childhood glaucoma. J AAPOS. 2023;27(6):
10. Selvan K, Mina M, Abdelmeguid H, Gulsha M, Vincent A, Sarhan A. Virtual reality headsets for perimetry testing: a systematic review. Eye. 2024;38(6):1041–1064. doi:10.1038/s41433-023-02843-y
11. Najdawi WO, Jiang F, Zamba GKD, Johnson CA, Pouw AE. Comparison of a novel head-mounted perimeter vs. the humphrey field analyzer. Ophthalmol Glaucoma. 2025;8(3):213–226. doi:10.1016/j.ogla.2024.11.007
12. Hodapp E, Parrish R, Anderson D. Clinical decisions in glaucoma. 1993. Available from: https://www.semanticscholar.org/paper/Clinical-Decisions-In-Glaucoma-Hodapp-Parrish/0661773d328bd6c03cf2aaebc648d4264bf98837.
13. Razeghinejad R, Gonzalez-Garcia A, Myers JS, Katz LJ. Preliminary report on a novel virtual reality perimeter compared with standard automated perimetry. J Glaucoma. 2021;30(1):17–23. doi:10.1097/IJG.0000000000001670
14. Groth SL, Linton EF, Brown EN, Makadia F, Donahue SP. Evaluation of virtual reality perimetry and standard automated perimetry in normal children. Trans Vis Sci Tech. 2023;12(1):6. doi:10.1167/tvst.12.1.6
15. Sponsel WE, Griffin JM, Slagle GT, Vu TA, Eis A. Prospective comparison of visuAll virtual reality perimetry and humphrey automated perimetry in glaucoma. J Curr Glaucoma Pract. 2024;18(1):4–9. doi:10.5005/jp-journals-10078-1434
16. Salazar D, Morales E, Rabiolo A, et al. Pointwise methods to measure long-term visual field progression in glaucoma. JAMA Ophthalmol. 2020;138(5):536–543. doi:10.1001/jamaophthalmol.2020.0647
17. Ruia S, Tripathy K. Humphrey visual field. In: StatPearls. StatPearls Publishing; 2024.
18. Greenfield JA, Deiner M, Nguyen A, et al. Virtual reality oculokinetic perimetry test reproducibility and relationship to conventional perimetry and OCT. Ophthalmol Sci. 2022;2(1):100105. doi:10.1016/j.xops.2021.100105
19. Nascimento e Silva R, Kim JA, Li Y. Repeatability of a virtual reality headset perimeter in glaucoma and ocular hypertensive patients. Transl Vision Sci Technol. 2024;13(6):14. doi:10.1167/tvst.13.6.14
20. Chew SSL, Kerr NM, Wong ABC, Craig JP, Chou CY, Danesh-Meyer HV. Anxiety in visual field testing. Br J Ophthalmol. 2016;100(8):1128–1133. doi:10.1136/bjophthalmol-2015-307110
21. Kaliaperumal S, Janani VS, Menon V, Sarkar S, Behera G, Kattamani S. Study of anxiety in patients with glaucoma undergoing standard automated perimetry and optical coherence tomography - A prospective comparative study. Indian J Ophthalmol. 2022;70(8):2883. doi:10.4103/ijo.IJO_508_22
22. Susanna FN, Susanna CN, Libânio PGS, Nishikawa FT, Schiave Germano RA, Junior RS. Comparison between the fast strategies of a virtual reality perimetry and the humphrey field analyzer in patients with glaucoma. Ophthalmol Glaucoma. 2025;8(3):227–234. doi:10.1016/j.ogla.2024.12.004
 © 2026 The Author(s). This work is published and licensed by Dove Medical Press Limited. The
full terms of this license are available at https://www.dovepress.com/terms
and incorporate the Creative Commons Attribution
- Non Commercial (unported, 4.0) License.
By accessing the work you hereby accept the Terms. Non-commercial uses of the work are permitted
without any further permission from Dove Medical Press Limited, provided the work is properly
attributed. For permission for commercial use of this work, please see paragraphs 4.2 and 5 of our Terms.
© 2026 The Author(s). This work is published and licensed by Dove Medical Press Limited. The
full terms of this license are available at https://www.dovepress.com/terms
and incorporate the Creative Commons Attribution
- Non Commercial (unported, 4.0) License.
By accessing the work you hereby accept the Terms. Non-commercial uses of the work are permitted
without any further permission from Dove Medical Press Limited, provided the work is properly
attributed. For permission for commercial use of this work, please see paragraphs 4.2 and 5 of our Terms.
Recommended articles
Virtual Reality Visual Field Testing in Glaucoma: Benefits and Drawbacks
Babel AT, Soumakieh MM, Chen AY, Wong C, R da Costa D, Almeida DR
Clinical Ophthalmology 2025, 19:933-937
Published Date: 17 March 2025
Peripherex Home Visual Field Demonstrates High Test-Retest Reliability, Validity
Schweitzer J, Ibach M, Berdahl J, Daoud M, Daoud YA, Kempinski Y, Goldberg JL
Clinical Ophthalmology 2025, 19:1877-1884
Published Date: 17 June 2025
Comparison of Visual Field Assessments Between the Humphrey Field Analyzer, Tempo, and Virtual Eye Elite Perimeters
Blehm C, Hall B
Clinical Ophthalmology 2025, 19:4535-4542
Published Date: 9 December 2025