Back to Journals » International Journal of Chronic Obstructive Pulmonary Disease » Volume 18
Comparison of Three Prediction Models for Predicting Chronic Obstructive Pulmonary Disease in China
Authors Teng Y, Jian Y, Chen X, Li Y, Han B, Wang L
Received 19 August 2023
Accepted for publication 5 December 2023
Published 12 December 2023 Volume 2023:18 Pages 2961—2969
DOI https://doi.org/10.2147/COPD.S431115
Checked for plagiarism Yes
Review by Single anonymous peer review
Peer reviewer comments 2
Editor who approved publication: Prof. Dr. Richard Russell
Yuhan Teng,1 Yining Jian,2 Xinyue Chen,3 Yang Li,4 Bing Han,2 Lei Wang3
1Department of Clinical Medicine, Southwest Medical University, Luzhou, Sichuan, People’s Republic of China; 2Department of Public Health, China Medical University, Shenyang, Liaoning, People’s Republic of China; 3Department of General Practice, the First Hospital of China Medical University, Shenyang, Liaoning, People’s Republic of China; 4Department of General Practice, Hunnan Zhujia Community Health Service Center, Shenyang, Liaoning, People’s Republic of China
Correspondence: Lei Wang, Department of General Practice, The First Hospital of China Medical University, 122 N Nanjing St., Heping District, Shenyang, 110001, People’s Republic of China, Fax +86-24-83283333, Email [email protected]
Purpose: To predict the future number of patients with chronic obstructive pulmonary disease (COPD) in China and compare the three prediction models.
Methods: A generalized additive model (GAM), autoregressive integrated moving average (ARIMA) model, and curve-fitting method were used to fit and predict the number of patients with COPD in China. Data on the number of patients with COPD in China from 1990 to 2019 were obtained from the Global Burden of Disease (GBD) database. The coefficient of determination (R2), mean absolute error (MAE), mean absolute percentage error (MAPE), root mean squared error (RMSE), relative error of prediction, Akaike Information Criterion (AIC), and Bayesian Information Criterion (BIC) were used to evaluate and compare the fitting effect, prediction effect, and reliability of the three models.
Results: The GAM, ARIMA, and curve-fitting methods could predict future trends in COPD in China. The performance of the GAM is the best among the three models, whereas the curve fitting method is the worst, and the ARIMA (0,1,2) model is in between. The prediction results of the three models showed that the number of patients with COPD in China is expected to increase from 2020 to 2025.
Conclusion: GAM and AIRMA models are recommended for predicting the future prevalence of COPD in China. The number of patients with COPD in China is expected to increase in the next few years. The prevention and control of COPD in China still needs to be strengthened. Using appropriate models to predict future trends in COPD will provide support for health policymakers.
Keywords: generalized additive model, ARIMA model, curve fitting method, COPD, prediction
Introduction
Chronic obstructive pulmonary disease (COPD) is a common, preventable, and treatable disease that is usually caused by significant exposure to noxious particles or gases.1 COPD is a heterogeneous lung condition characterized by chronic respiratory symptoms (dyspnea, cough, sputum production) due to abnormalities of the airways (bronchitis, bronchiolitis) and/or alveoli (emphysema) that cause persistent, often progressive, airflow obstruction.2 COPD is a worldwide health issue, which causes a heavy burden to the world. From 1990 In 2019, the number of patients with COPD has increased from 115 million to 212 million globally.3 In China, the number of patients with COPD increased from 28 million in 1990 to 45 million in 2019.3 In addition, COPD is one of the leading causes of mortality worldwide. In 2017, the total number of deaths from COPD was approximately 3.2 million worldwide, and the age-standardized death rate was 42.2 per 100,000, ranking third in the world.4 In China, with more than one million in 2019.5 Prevention and control of COPD has become an important challenge for the world and China. Therefore, predicting the prevalence of COPD and the number of patients with COPD in the future will provide data support for health decision-makers.
Several methods have been used to predict future epidemiological disease trends. For example, the generalized additive model (GAM) was used to predict lung cancer incidence among women aged 25 to 84 years in five countries, including the United States, the United Kingdom and Australia.6 In China, the autoregressive integrated moving average (ARIMA) model was used to predict the number of patients and prevalence trends of diabetes and chronic kidney disease.7,8 One study used the curve fitting method and long short-term memory (LSTM) to predict the number of Corona Virus Disease 2019 (COVID-19) cases in India.9 However, the number of existing studies on predicting the future trend of COPD is small, and few studies have compared the accuracy of COPD prediction methods.
In this study, we used the GAM, ARIMA model, and curve fitting method to predict the number of patients with COPD in China from 2020 to 2025, and compared the fitting and prediction effects of the three models. The number of patients with COPD in China from 1990 to 2018 was used to fit the models and the number of patients with COPD in 2019 was used to test the models. The aim of this study was to explore appropriate methods to predict the prevalence of COPD in China, estimate the future risk and disease burden of COPD, and provide references for the prevention and control of COPD in China, and provide data support for health decision-making departments to invest medical resources in the clinical treatment of COPD.
Materials and Methods
Data
Data on the number of patients with COPD in China from 1990 to 2019 were obtained from the Global Health Data Exchange (GHDx). GBD Results Tool (2023). https://vizhub.healthdata.org/gbd-results/. The database was established using Microsoft Excel 2016 and statistical analyses of the data were performed using R 4.2.0.
GAM
Generalized additive model (GAM) is an extension of the linear regression model, which is based on a Generalized linear model and an additive model.10 GAM is a flexible regression model. Its predictor variables can be linear or nonlinear and can be applied to data with various distributions, including normal, binomial, Gamma, and Poisson. GAM predicts disease trends by non-parametric fitting with relaxed assumptions on the relationship between response and predictor variables and the flexibility of the GAM in setting predictor variables allows it to achieve high predictive accuracy.11 The GAM has the following inequality:12
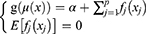
where g() is the link function, µ(x)=E(y/x), α is the intercept, f() is an arbitrary univariate function for each predictor variable, xj If the response variable yi is independent of a single-parameter exponential distribution, the distribution has a density function or probability density function as follows:
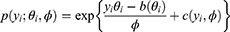
where θi is the natural parameter of this exponential distribution, different yi corresponds to different θi,  is the nuisance or scale parameter,
  is the same for all yi, b and c are the functions used to determine the distribution type.
ARIMA Model
The autoregressive integrated moving average (ARIMA) model is a common method for time series analysis and prediction which can predict future values from past values.13 Therefore, the future disease trends can be predicted by using the past number of people with a disease.7,8 ARIMA model consists of an autoregressive (AR) model, a moving average (MA) model, and integration (I), which correspond to the three parameters p, q and d respectively. The AR (p) model represents the p-order autoregressive model, which is used to associate the pattern of a one-time period with its previous time periods. The MA (q) model represents a q-order moving average model that uses the errors associated with the forecast at a previous time step to forecast a variable at a later time step. I (d) is the reverse process of differencing to generate the forecast, which refers to the difference order that converts a non-stationary time series into a stationary time series. Combining these three components yields the ARIMA (p, d, q) model. The generalized pth-order AR model (Eq. (3)), and qth-order MA model (Eq. (4)) can be expressed as

where yt is the current time-series value, c is the intercept,  (i=1,2 … p) is the autoregressive parameter, θi (i=1,2 … p) is the moving average parameter, εt is the white noise series with zero mean, εt=yt-yt-1. Based on Eq. (3) and Eq. (4), we obtain the generalized ARIMA model, as follows:

where  is the stationary time series after differencing. Using the backshift operator Bmyt=yt-m in Eq. (5), the ARIMA (p, d, q) model can be expressed as:

Curve Fitting Method
Curve fitting method is a common technique for data modeling.14 It is the process of transforming the observed relationship in a particular dataset into a parameterized function and can be used for prediction and parameter estimation.15 Curve fitting method constructs a curve or mathematical function of the number of patients to predict the future disease trends by best fitting a series of data points of the number of patients in the past.16 Curve fitting methods include several classes, such as polynomials, exponential functions, power functions and logarithmic functions.14 Polynomials are a common choice for curve fitting, and their general form is as follows:

where ci (i=0,1 … n) is a real number; is the autoregressive parameter, which is the parameter or coefficient of X, n is the degree of the polynomial.
Model Evaluation
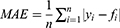
Model evaluation metrics can intuitively evaluate the performance of the model. By comparing the various evaluation metrics of different models, we can intuitively compare the performance of different prediction models in various aspects. The prediction model that performs better in all aspects will be more reliable in predicting disease trends. The three prediction methods in this study were evaluated and compared using common model-evaluation metrics. The model fitting effect was evaluated using the coefficient of determination (R2), mean absolute error (MAE), mean absolute percentage error (MAPE), and root mean square error (RMSE). The predictive effect of the model was evaluated by using the relative error of prediction. Akaike Information Criterion (AIC) and Bayesian Information Criterion (BIC) were used to evaluate the reliability of the time-series analysis. The equations for the model evaluation metrics are as follows:
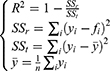
where SSr is the sum of the squares of the residuals, SSt is the total sum of squares, yi is the actual value, fi is the fitted value,  is the mean of the actual values. The value of R2 ranged from 0 to 1, with values closer to 1 indicating a better fit of the model.
Smaller values of MAE, MAPE, and RMSE values indicated a better fitting effect of the model.
where  is the predicted value. The lower the value of the relative error of prediction, the better the prediction effect of the model.
where  denotes the likelihood function, K denotes the total number of model parameters, N denotes the number of observations. Smaller values of AIC and BIC values indicated a more reliable model.
Results
Model Evaluation
The GAM used to predict the number of patients with COPD was modeled using years as a predictor. Using the number of patients with COPD in China from 1990 to 2019 to fit and validate the model, we found that when the basis dimension k=22, the GAM had the optimal fitting and predictive effect. The model selection was based on the generalized cross-validation (GCV) principle. The GCV score (1.5749e+09) and deviance explained (100%) of the GAM established by year showed that the model works well.
The ARIMA (0,1,2) model was constructed by fitting the number of patients with COPD in China from 1990 to 2018. After the first difference transformation, the original time series changed from non-stationary to stationary, and the differencing time series passed the augmented Dickey–Fuller (ADF) test (ADF value = −3.8001, P < 0.05). The ARIMA (0,1,2) model passed the white noise test (P>0.05), indicating that it fits well and can be used to predict the number of patients with COPD in the future.
For the curve-fitting method, a curve-fitting equation was established by fitting the number of patients with COPD in China from 1990 to 2018. According to the polynomial curve fitting method, we obtained the quadratic equation y=−9357.3x2+38034939x-3.8605e+10. The coefficient of determination of the model was 0.9866, indicating a good fit (F = 960.08, P < 0.001).
Model Evaluation results
The specific values of the fitting and prediction effect evaluation metrics of the GAM, ARIMA (0,1,2) model, and curve-fitting method are listed in Table 1. The R2 values of the three models were greater than 0.9, which indicates that the three models can fit the data well. The GAM had the smallest R2, MAE, MAPE, and RMSE, indicating that the GAM has the best fitting effect among the three models. In addition, the relative error of prediction of the three models was small, which shows that these models also have good prediction effects. Moreover, GAM has the smallest relative error of prediction, which indicates that it also has the best prediction effect among the three models. According to AIC and BIC, all three prediction models were reliable, and the values of AIC and BIC for GAM were the smallest among the three models.
 |
Table 1 Fitting and Prediction Effect Evaluation of the Three Models |
Prediction Results
We used the GAM, ARIMA (0,1,2) model, and curve-fitting method to fit the number of patients with COPD in China from 1990 to 2018 and predicted the number of patients with COPD in China from 2019 to 2025, as shown in Table 2. In addition, the prediction results of the three models showed an overall upward trend in the number of patients with COPD in China from 1990 to 2025, as shown in Figure 1.
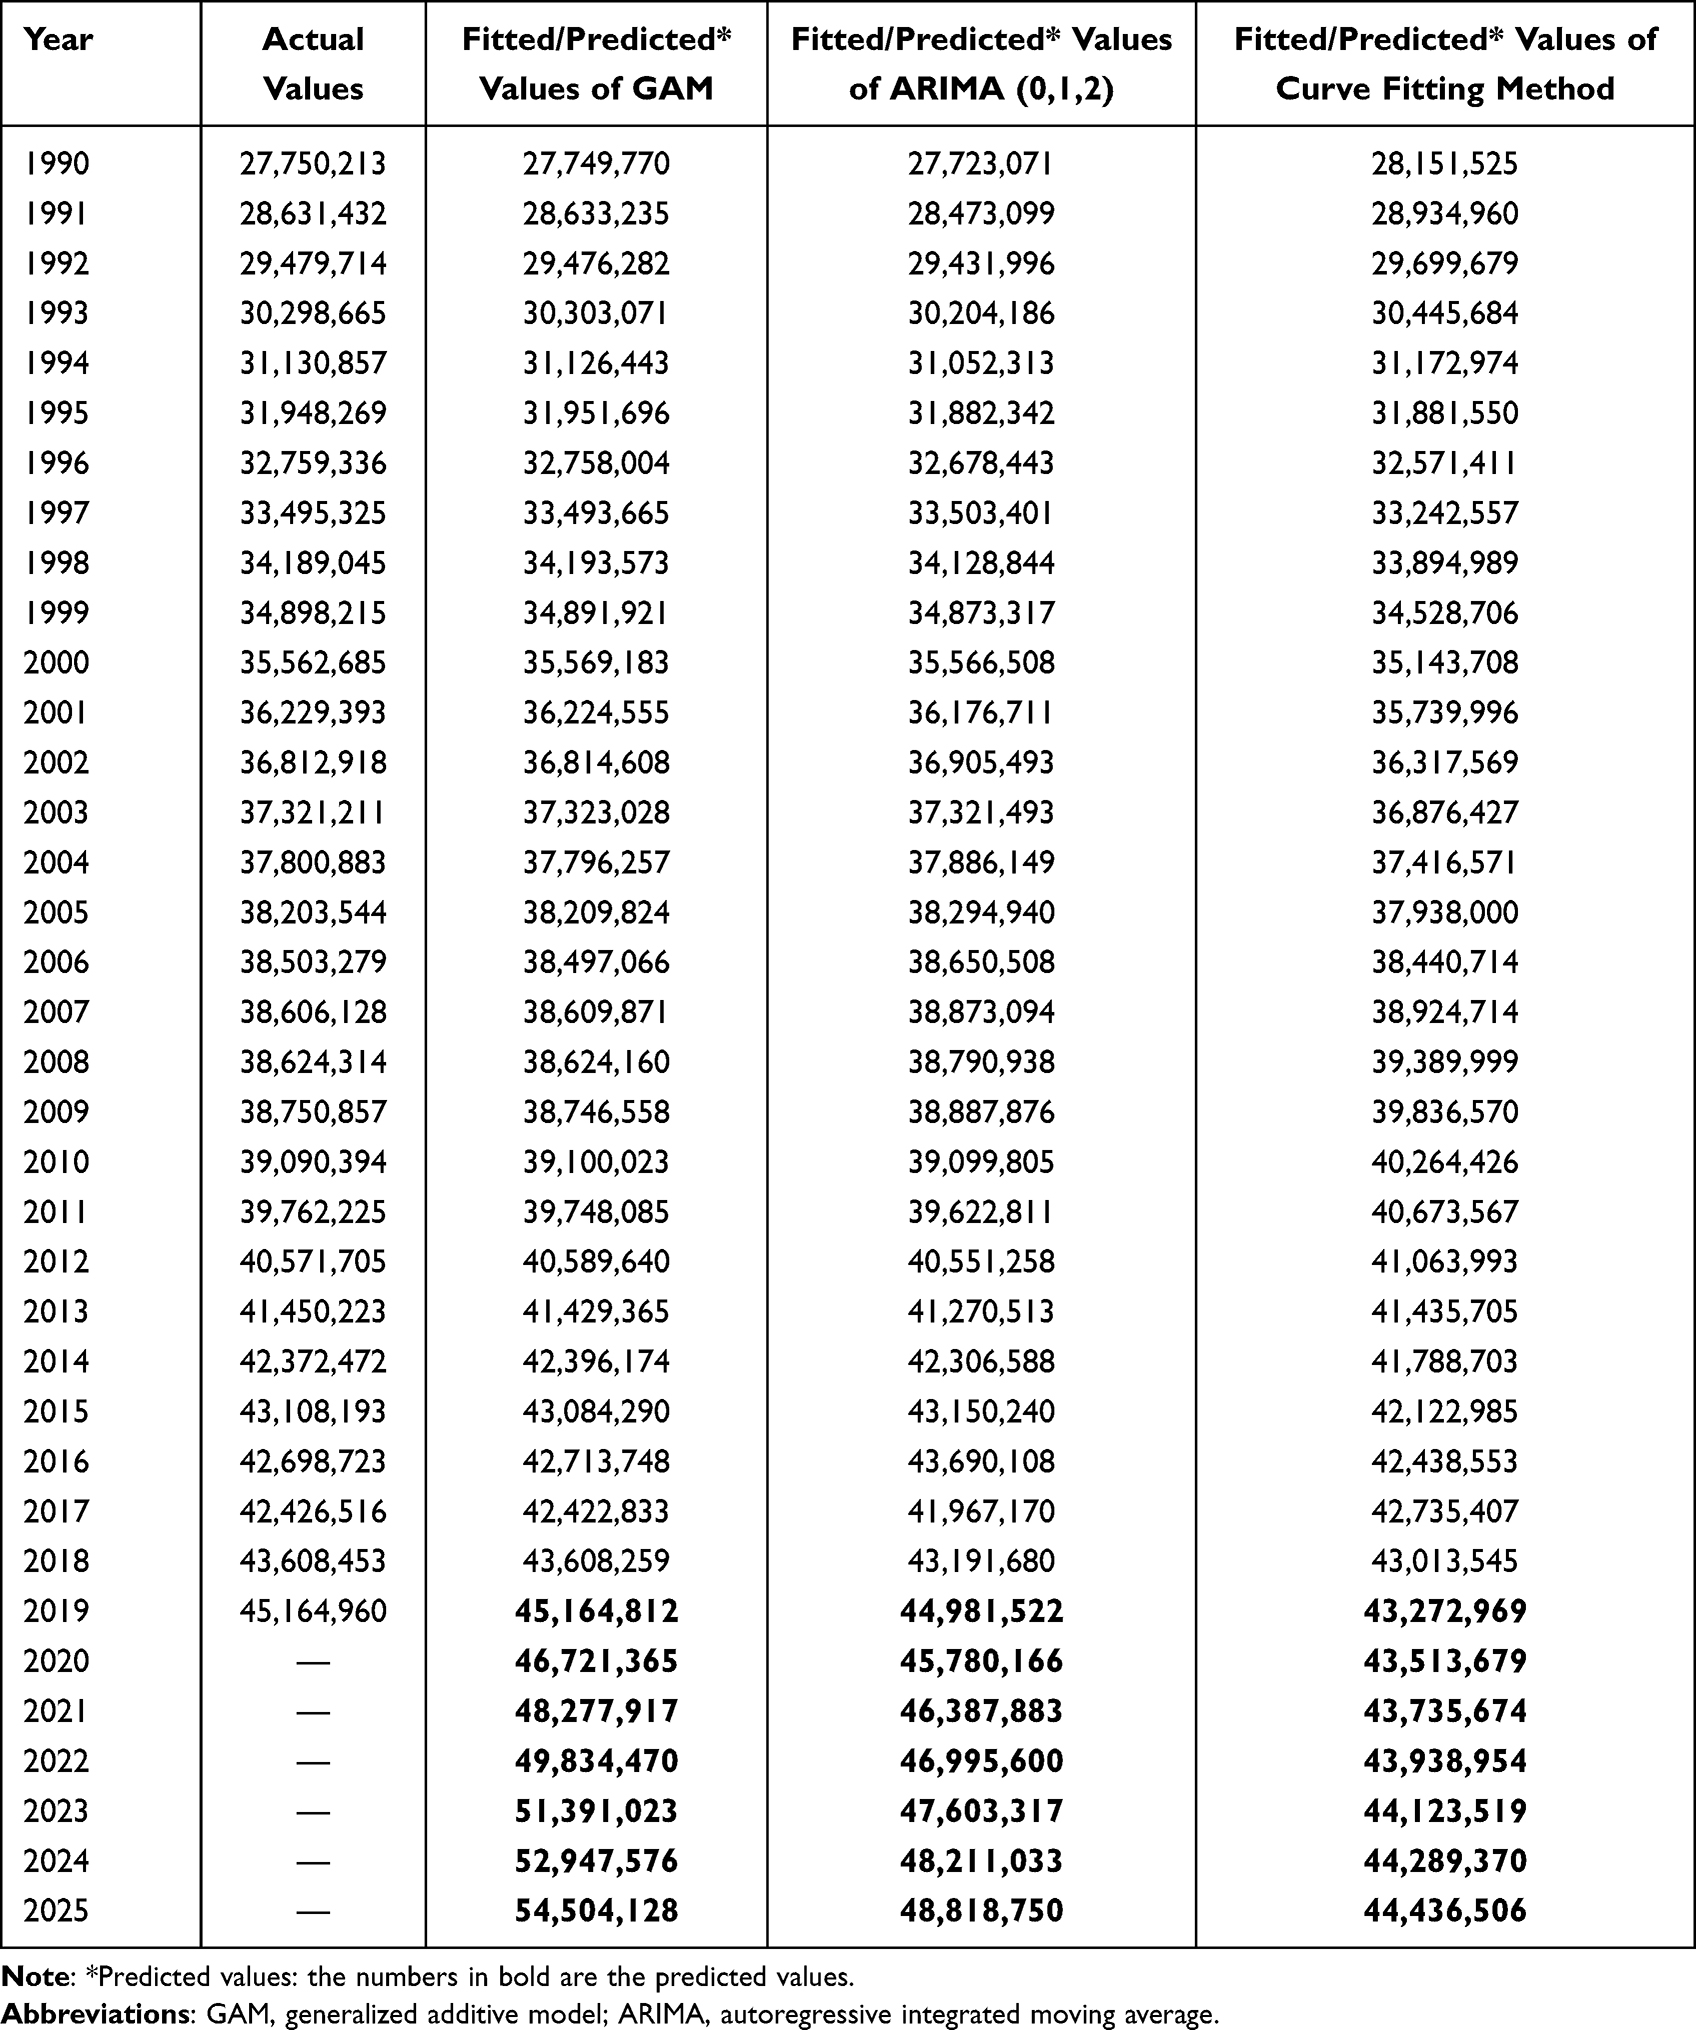 |
Table 2 Fitting and Prediction Results of the Three Models from 1990 to 2025 |
 |
Figure 1 The prevalence trend of COPD in China from 1990 to 2025. Abbreviations: COPD, chronic obstructive pulmonary disease; GAM, generalized additive model; ARIMA, autoregressive integrated moving average. |
Discussion
According to our results, all three models in this study can be used to predict the future number of patients with COPD in China, and all three prediction models showed good fitting and prediction effects. The fitting effect, prediction effect, and model reliability of the GAM are the best among the models, whereas the curve fitting method is the worst among the three models, and the effect of the ARIMA model is in between. In this study, the number of patients with COPD in China from 1990 to 2018 used for model fitting was not normal. For non-normal data, GAM provides a more efficient analysis method than traditional linear models.17 Similar to the results of this study, GAM also shows some advantages when predicting other diseases. In 2019, a study constructed GAM, ARIMA, and negative binomial regression models (NBM) to predict the number of hand-foot-mouth disease (HFMD) cases in Yiwu City, Zhejiang Province, China. The results showed that the predicted values of the three models were in good agreement with the observed values, and the GAM had the best fitting effect.18 Based on the number of diagnosed pneumoconiosis cases in China from 2000 to 2019, a study established three prediction models for the incidence trend of pneumoconiosis, including GAM, curve fitting method and GM (1,1) model. This study found that GAM was relatively good among the three prediction models. The coefficient of determination, average fitting relative error, and relative error of prediction of the GAM were better than those of the other two models.19 The ARIMA model was also suitable for predicting the future number of patients with COPD in China. As a common time-series prediction method, the ARIMA model fully utilizes the temporal information of the original dataset to make accurate predictions. In addition, the modeling process of the ARIMA model is not complex and can be generalized for use.20 At present, ARIMA model has been applied to predict the epidemic trend of various diseases and whether infectious or chronic non-communicable diseases can be well predicted. For example, the ARIMA model was used to predict the estimated confirmed cases and epidemic trends of COVID-19 from April 24 to July 7, 2020 for the top 15 countries with confirmed cases, deaths, and recoveries from COVID-19.21 In addition, one study verified the accuracy of using the ARIMA model to predict COVID-19, and the results showed that most of the observed actual values were well within bounds of the ARIMA model prediction at 95% confidence interval, indicating that the prediction accuracy provided by the ARIMA model was appropriate and satisfactory.22 In the United States, the ARIMA model was used to predict the incidence of cancer from 2015 to 2020.23 Moreover, the ARIMA model was also been select to predict the trends in the incidence of global bladder cancer from 2017 to 2030.24 The curve fitting method can also be used to predict the future number of patients with COPD in China. However, the fitting effect, prediction effect, and model reliability of the curve-fitting method were the worst of the three methods. Consistent with the results of this study, a study comparing the accuracy of several algorithms used to predict COVID-19 showed that the curve-fitting method had the worst performance in terms of prediction accuracy among the methods considered.25 In this study, we choose the quadratic polynomial model in the curve fitting method, which is a parabolic model and cannot accurately fit the fluctuation part of the data, so the effect of the model may have been affected. However, the sigmoid curve, which is more suitable for volatility data in the curve fitting method, did not show a better fitting and prediction effect in the comparative study of other prediction methods.25 Therefore, compared with the curve fitting method, the GAM or ARIMA model is recommended for analyzing and predicting the future number of patients with COPD in China.
The results indicated that the number of patients with COPD in China showed an overall upward trend from 1990 to 2019 and that the number of patients with COPD in 2019 increased by 62.8% from 1990. Moreover, the predictions of all three models showed that the number of patients with COPD will continue to increase over the next few years. The reasons for the increasing number of patients with COPD in China may be as follows. First, it is related to rapid population aging in China. A meta-analysis of 28 countries worldwide found that the prevalence of COPD increased with age, with a significant increase in people aged 40 years and older. The highest prevalence of COPD among all age groups was in people aged 65 years and older.26 In China, a national cross-sectional study found that the prevalence of COPD increased with age and was as high as 35.5% in people aged 70 years and older in 2015.27 From 1990 to 2021, the number of people aged 65 years and older in China increased from 64 million to 201 million, accounting for the proportion of the total Chinese population increased from 5.6% to 14.2%.28 By 2050, it is expected that there will be 365 million elderly people aged 65 years and older in China, accounting for 26.1% of the total population.29 Secondly, there are a large number of smokers in China. Smoking is a major risk factor for COPD.30 A meta-analysis of 162 population-based articles from 65 countries showed that globally, the risk of COPD in current smokers is 3.2 times higher than that in non-smokers.31 In China, a national COPD prevalence study found that the risk of COPD in smokers was 1.87 times higher than that in non-smokers among people aged 40 years and older.32 China is the world’s largest consumer of tobacco, accounting for more than one-third of the world’s tobacco consumption; in 2019, 341 million (30%) of the world’s 1.14 billion tobacco smokers lived in China.33 A study based on data from five consecutive large nationally representative surveys from 2007 to 2018 showed that the smoking prevalence among Chinese adults aged 18 to 69 years was greater than 25% in all five surveys, and the smoking prevalence among adult males in China was the highest in the world.34 Based on the above reasons, we put forward the following suggestions. First, it is recommended that COPD screening should be strengthened in people aged 40 years and above, especially people aged 65 years and above, so as to achieve early detection, early diagnosis, and early treatment of patients with COPD. Second, health education regarding the dangers of smoking should be strengthened, and smokers should be encouraged to quit smoking. In addition, such a large number of patients with COPD who will continue to increase in the future not only brings challenges to the prevention and control of COPD in China, but also brings some problems to the clinical treatment of COPD. Therefore, health policy makers should increase the resource investment for the clinical treatment of COPD in China to promote the development of clinical treatment of COPD, so that it can better adapt to the increasing number of COPD patients in China.
Conclusion
The GAM, ARIMA model, and curve-fitting method could be used to predict the future number of patients with COPD in China, and the GAM had the best effect among the three models. The prediction results of the three models showed that the number of patients with COPD in China will increase in the future. Therefore, we should continue to strengthen the prevention and control of COPD in China. In addition, it also suggests that the health policy makers in China should invest more medical resources in the clinical treatment of COPD to better face the challenge of the increasing number of patients with COPD in the future.
Abbreviations
COPD, chronic obstructive pulmonary disease; GAM, generalized additive model; ARIMA model, autoregressive integrated moving average model; MAPE, mean absolute percentage error; MAE, mean absolute error; RMSE, root mean squared error; AIC, akaike information criterion; BIC, bayesian information criterion; LSTM, long short-term memory; COVID-19, corona virus disease 2019; GBD, global burden of disease; AR, autoregression; MA, moving average; I, integration; GCV, generalized cross validation; ADF test, augmented dickey fuller test; NBM, negative binomial regression model; HFMD, hand-foot-mouth disease.
Data Sharing Statement
The data used in this study were obtained from the Global Health Data Exchange (GHDx). GBD Results Tool (2022). https://vizhub.healthdata.org/gbd-results/.
Ethics Approval and Informed Consent
We applied for ethical approval of China Medical University. The data in the research included no identifiable information, and China Medical University approved the research plan. We have attached the original copy of the ethical approval as an attachment.
Author Contributions
All authors made a significant contribution to the work reported, whether that is in the conception, study design, execution, acquisition of data, analysis and interpretation, or in all these areas; took part in drafting, revising or critically reviewing the article; gave final approval of the version to be published; have agreed on the journal to which the article has been submitted; and agree to be accountable for all aspects of the work.
Funding
This study did not receive any specific grants from funding agencies in the public, commercial, or not-for-profit sectors.
Disclosure
The authors report no conflicts of interest in this work.
References
1. Vogelmeier CF, Criner GJ, Martinez FJ, et al. Global Strategy for the Diagnosis, Management, and Prevention of Chronic Obstructive Lung Disease 2017 Report. Am J Respir Crit Care Med. 2017;195(5):557–582. doi:10.1164/rccm.201701-0218PP
2. Celli B, Fabbri L, Criner G, et al. Definition and Nomenclature of Chronic Obstructive Pulmonary Disease: time for Its Revision. Am J Respir Crit Care Med. 2022;206(11):1317–1325. doi:10.1164/rccm.202204-0671PP
3. Global Health Data Exchange (GHDx) [homepage on the Internet]. GBD Results Tool; 2023. Available from: https://vizhub.healthdata.org/gbd-results/.
4. GBD 2017 Causes of Death Collaborators. Global, regional, and national age-sex-specific mortality for 282 causes of death in 195 countries and territories, 1980-2017: a systematic analysis for the Global Burden of Disease Study 2017. Lancet. 2018;392(10159):1736–1788. doi:10.1016/S0140-6736(18)32203-7
5. Yin P, Wu J, Wang L, et al. The Burden of COPD in China and Its Provinces: findings From the Global Burden of Disease Study 2019. Front Public Health. 2022;10:859499. doi:10.3389/fpubh.2022.859499
6. Clements MS, Armstrong BK, Moolgavkar SH. Lung cancer rate predictions using generalized additive models. Biostatistics. 2005;6(4):576–589. doi:10.1093/biostatistics/kxi028
7. Zhu D, Zhou D, Li N, Han B. Predicting Diabetes and Estimating Its Economic Burden in China Using Autoregressive Integrated Moving Average Model. Int J Public Health. 2022;66:1604449. doi:10.3389/ijph.2021.1604449
8. Jian Y, Zhu D, Zhou D, et al. ARIMA model for predicting chronic kidney disease and estimating its economic burden in China. BMC Public Health. 2022;22(1):2456. doi:10.1186/s12889-022-14959-z
9. Tomar A, Gupta N. Prediction for the spread of COVID-19 in India and effectiveness of preventive measures. Sci Total Environ. 2020;728:138762. doi:10.1016/j.scitotenv.2020.138762
10. Hastie T, Tibshirani R. Generalized Additive Models. Boca Raton: CRC Press; 1990.
11. Xiao D, Wu K, Tan X, et al. Modeling and predicting hemorrhagic fever with renal syndrome trends based on meteorological factors in Hu County, China. PLoS One. 2015;10(4):56.
12. Hastie T, Tibshirani R. Generalized additive models: some applications. J Am Stat Assoc. 1987;82(398):371–386. doi:10.1080/01621459.1987.10478440
13. Newbold P. ARIMA model building and the time series analysis approach to forecasting. J Forecasting. 1983;2(1):23–35. doi:10.1002/for.3980020104
14. Sit V, Poulin-Costello M. Catalogue of Curves for Curve Fitting. Columbia: Forest Science Research Branch, Ministry of Forests; 1994.
15. Li M, Li LD. A novel method of curve fitting based on optimized extreme learning machine. Appl Artif Intell. 2020;34(12):849–865. doi:10.1080/08839514.2020.1787677
16. Wang J, Wang C, Zhang W. Data analysis and forecasting of tuberculosis prevalence rates for smart healthcare based on a novel combination model. Appl Sci. 2018;8(9):1693. doi:10.3390/app8091693
17. Ravindra K, Rattan P, Mor S, Aggarwal AN. Generalized additive models: building evidence of air pollution, climate change and human health. Environ Int. 2019;132:104987. doi:10.1016/j.envint.2019.104987
18. Fu T, Chen T, Dong ZB, et al. Development and comparison of forecast models of hand-foot-mouth disease with meteorological factors. Sci Rep. 2019;9(1):15691. doi:10.1038/s41598-019-52044-5
19. Zhou D, Zhu D, Li N, Han B. Exploration of Three Incidence Trend Prediction Models Based on the Number of Diagnosed Pneumoconiosis Cases in China From 2000 to 2019. J Occup Environ Med. 2021;63(7):e440–e444. doi:10.1097/JOM.0000000000002258
20. Zhu Z, Zhu X, Zhan Y, Gu L, Chen L, Li X. Development and comparison of predictive models for sexually transmitted diseases-AIDS, gonorrhea, and syphilis in China, 2011-2021. Front Public Health. 2022;10:966813. doi:10.3389/fpubh.2022.966813
21. Singh RK, Rani M, Bhagavathula AS, et al. Prediction of the COVID-19 Pandemic for the Top 15 Affected Countries: advanced Autoregressive Integrated Moving Average (ARIMA) Model. JMIR Public Health Surveill. 2020;6(2):e19115. doi:10.2196/19115
22. Alabdulrazzaq H, Alenezi MN, Rawajfih Y, Alghannam BA, Al-Hassan AA, Al-Anzi FS. On the accuracy of ARIMA based prediction of COVID-19 spread. Results Phys. 2021;27:104509. doi:10.1016/j.rinp.2021.104509
23. Xie L. Time series analysis and prediction on cancer incidence rates. J Med Discovery. 2017;2(3):1–10. doi:10.24262/jmd.2.3.17030
24. Cai Q, Chen Y, Xin S, et al. Temporal trends of bladder cancer incidence and mortality from 1990 to 2016 and projections to 2030. Translational Androl Urol. 2020;9(2):153–165. doi:10.21037/tau.2020.02.24
25. Achterberg MA, Prasse B, Ma L, Trajanovski S, Kitsak M, Van Mieghem P. Comparing the accuracy of several network-based COVID-19 prediction algorithms. Int J Forecast. 2022;38(2):489–504. doi:10.1016/j.ijforecast.2020.10.001
26. Halbert RJ, Natoli JL, Gano A, Badamgarav E, Buist AS, Mannino DM. Global burden of COPD: systematic review and meta-analysis. Eur Respir J. 2006;28(3):523–532. doi:10.1183/09031936.06.00124605
27. Wang C, Xu J, Yang L, et al.; China Pulmonary Health Study Group. Prevalence and risk factors of chronic obstructive pulmonary disease in China (the China Pulmonary Health [CPH] study): a national cross-sectional study. Lancet. 2018;391(10131):1706–1717. doi:10.1016/S0140-6736(18)30841-9
28. National Bureau of Statistics of China [homepage on the Internet]. Age Composition and Dependency Ratio of Population; 2022. Available from: https://data.stats.gov.cn/english/easyquery.htm?cn=C01.
29. Fang EF, Xie C, Schenkel JA, et al. A research agenda for ageing in China in the 21st century (2nd edition): focusing on basic and translational research, long-term care, policy and social networks. Ageing Res Rev. 2020;64:101174. doi:10.1016/j.arr.2020.101174
30. Bartal M. COPD and tobacco smoke. Monaldi Arch Chest Dis. 2005;63(4):213–225. doi:10.4081/monaldi.2005.623
31. Adeloye D, Song P, Zhu Y, Campbell H, Sheikh A, Rudan I. NIHR RESPIRE Global Respiratory Health Unit. Global, regional, and national prevalence of, and risk factors for, chronic obstructive pulmonary disease (COPD) in 2019: a systematic review and modelling analysis. Lancet Respir Med. 2022;10(5):447–458. doi:10.1016/S2213-2600(21)00511-7
32. Fang L, Gao P, Bao H, et al. Chronic obstructive pulmonary disease in China: a nationwide prevalence study. Lancet Respir Med. 2018;6(6):421–430. doi:10.1016/S2213-2600(18)30103-6
33. Reitsma MB, Kendrick PJ, Ababneh E; GBD 2019 Tobacco Collaborators. Spatial, temporal, and demographic patterns in prevalence of smoking tobacco use and attributable disease burden in 204 countries and territories, 1990-2019: a systematic analysis from the Global Burden of Disease Study 2019. Lancet. 2021;397(10292):2337–2360. doi:10.1016/S0140-6736(21)01169-7
34. Zhang M, Yang L, Wang L, et al. Trends in smoking prevalence in urban and rural China, 2007 to 2018: findings from 5 consecutive nationally representative cross-sectional surveys. PLoS Med. 2022;19(8):e1004064. doi:10.1371/journal.pmed.1004064
 © 2023 The Author(s). This work is published and licensed by Dove Medical Press Limited. The
full terms of this license are available at https://www.dovepress.com/terms
and incorporate the Creative Commons Attribution
- Non Commercial (unported, 3.0) License.
By accessing the work you hereby accept the Terms. Non-commercial uses of the work are permitted
without any further permission from Dove Medical Press Limited, provided the work is properly
attributed. For permission for commercial use of this work, please see paragraphs 4.2 and 5 of our Terms.
© 2023 The Author(s). This work is published and licensed by Dove Medical Press Limited. The
full terms of this license are available at https://www.dovepress.com/terms
and incorporate the Creative Commons Attribution
- Non Commercial (unported, 3.0) License.
By accessing the work you hereby accept the Terms. Non-commercial uses of the work are permitted
without any further permission from Dove Medical Press Limited, provided the work is properly
attributed. For permission for commercial use of this work, please see paragraphs 4.2 and 5 of our Terms.
Recommended articles
Development and Internal Validation of a Prediction Model for Major Cardiovascular and Respiratory Events in Chronic Obstructive Pulmonary Disease: Nationwide Primary Care Electronic Medical Records Cohort Study
Gale CP, Bhutani M, Chan JSK, Townend J, Patel MS, Sadatsafavi M, Henley W, Ariti C, Carter V, Couper A, Hubbard R, Kocks JWH, Pullen R, Skinner D, Price D
Pragmatic and Observational Research 2026, 17:551291
Published Date: 10 March 2026