Back to Journals » Infection and Drug Resistance » Volume 15
Comparison of Renal Function Biomarkers of Serum Creatinine and Cystatin C in HIV-Infected People on Dolutegravir-Containing Therapy
Authors Lu L, Li X, Liu X, Han Y, Qiu Z, Song X, Li Y, Li X, Cao W, Li T
Received 31 October 2021
Accepted for publication 9 March 2022
Published 8 April 2022 Volume 2022:15 Pages 1695—1706
DOI https://doi.org/10.2147/IDR.S347054
Checked for plagiarism Yes
Review by Single anonymous peer review
Peer reviewer comments 2
Editor who approved publication: Prof. Dr. Héctor Mora-Montes
Lianfeng Lu,1 Xiaodi Li,1 Xiaosheng Liu,2 Yang Han,1 Zhifeng Qiu,1 Xiaojing Song,1 Yanling Li,1 Xiaoxia Li,1 Wei Cao,1 Taisheng Li1,2
1Department of Infectious Diseases, Peking Union Medical College Hospital, Peking Union Medical College and Chinese Academy of Medical Sciences, Beijing, People’s Republic of China; 2Tsinghua-Peking Center for Life Sciences, Beijing, China Department of Basic Medical Sciences, School of Medicine, Tsinghua University, Beijing, People’s Republic of China
Correspondence: Taisheng Li, Department of Infectious Diseases, Peking Union Medical College Hospital, Peking Union Medical College and Chinese Academy of Medical Sciences, 1# Shuai Fu Yuan, Beijing, 100730, People’s Republic of China, Email [email protected]
Objective(s): HIV-1-infected Chinese patients who were treated naïve with combination dolutegravir (DTG) and tenofovir disoproxil fumarate (TDF) group, DTG without TDF group, TDF without DTG, as well as patients switched to DTG-containing therapy from other drugs were included.
Design: The dynamics of serum creatinine, cystatin C (CysC) level, eGFRcr and eGFRCysC at the baseline, 4 w, 12w, 24w, 36w and 48w for different group of patients were collected and evaluated.
Methods: Changes in serum creatinine, levels, eGFRcr and eGFRCysC were analyzed among groups and in different time-points. Intra-group correlation coefficient and Bland–Altman plot were used to compare the results of eGFRcr and eGFRCysC.
Results: Thirty-seven treated-naïve HIV-patients in combined DTG and TDF group (group 1), 23 in DTG without TDF patients (group 2) and 47 patients on TDF without DTG group (control group, group 3) along with 31 patients whose ART switch to DTG-containing regimens (group 4) were collected. Serum creatinine was significantly elevated in the group 1 and group 2 instead of group 3 from baseline to 48w. Mean decreased change of eGFR calculated by serum creatinine proved the same conclusion. However, there were no differences in serum cystatin C and eGFRCysC between baseline and at 48 weeks in DTG-containing groups. Moreover, the proportion of eGFRcr decreased over 30% was significantly higher in DTG-treatment group.
Conclusion: We demonstrated the clinical benefits of CysC for assessing the glomerular filtration rate when evaluating renal function in HIV-1-infected patients treated with whether DTG combined with TDF or not.
Keywords: HIV, antiretroviral therapy, dolutegravir, renal function, cystatin C, serum creatinine
Introduction
With the advent of antiretroviral therapy (ART) has contributed to protracted survival in patients infected with human immunodeficiency virus 1 (HIV-1), comorbidities with aging and side effects of ART have emerged as new concerns. Early detection of kidney damage is important in selecting appropriate antiretroviral drugs and eliminating potential nephrotoxic drugs for people infected with HIV-1. Tenofovir (TDF) is an important nucleotide reverse transcriptase inhibitor (NRTIs) combined with Lamivudine (3TC) and Efavirenz (EFV) as a first-line treatment for HIV-1-infected patients in China.1 One of the adverse effects of TDF is acute or chronic kidney injury which reported approximately 4–8%, usually occurred within 1 year.2–4 However, in some long-term follow-up studies, only a mild decline in eGFR can be attributed to TDF5,6 while others believed TDF can cause renal damage in long-term.7,8
Recently, DTG(dolutegravir) has been promoted as a newer integrase inhibitor drug, which may inhibit renal creatinine secretion by inhibiting some transporters, including the organic cation transporter 2 and multidrug and toxin extrusion 1, causing a slight increase in serum creatinine level, whereas there were rarely reports of actual renal damage.9,10 Combined DTG regimen or single-tablet regimen containing DTG will increase 10–20% serum creatinine from baseline in randomized clinical trials.9,11,12 Thus, differentiating the cause and clinical significance of increases in serum creatinine may be challenging even though combined TDF and DTG are effective in inhibiting HIV viral replication.
Serum creatinine (Cre) is the most common and easiest clinical marker for assessing kidney function, but it is often affected by age, gender, weight and muscle mass.13 As dolutegravir inhibits renal creatinine secretion, an increase in serum creatinine may be observed in HIV-1-infected individuals treated with dolutegravir, serum creatinine-based estimated GFR (eGFRcr) may be lower than actual GFR. Serum cystatin C can be another marker for estimation of GFR(eGFRCysC), which is produced by nucleated cells at a constant production rate, freely filtered without tubular secretion or reabsorption and catabolized in the proximal tubule, but eGFRCysC may be affected by HIV status including viraemia.14
Overall, it is important to describe the impact of dolutegravir on renal function beyond the controlled clinical trial environment to verify the safety profile of INSTIs and potential renal damage in HIV-infected patients. The rate and significance of increased serum creatinine out of clinical trials and in Chinese HIV population were unknown. In this study, we compared the serum creatinine elevation between combination with DTG and TDF group, DTG without TDF group and TDF without DTG group for control. We also examined the utility of different biomarkers: serum creatinine and cystatin C of kidney function in people infected with HIV-1 treated with dolutegravir.
Methods
Study Design and Data Sources
The medical records for a single HIV-1 patient center at the AIDS Clinical Center, Peking Union Medical Hospital, were examined retrospectively. HIV-positive patients older than 18 years were enrolled irrespective of sex whereas patients younger than 18 years, those who had no records of serum creatinine, who had severe neuropathy or renal transplantation were excluded. The change of serum creatinine and Cystatin C was investigated on treatment-naïve patients who started, DTG combined TDF therapy (group 1), DTG-containing without TDF ART (group 2) and those who started TDF-containing without DTG ART (group 3) as the control, and patients who switch-to DTG-containing ART patients (group 4). In the first year after commencing antiretroviral therapy, patients regularly visit clinic at 4, 12, 24, 36 and 48 weeks. After the first year, patients usually visited our clinic at least every 3 months for monitoring CD4+ cell count, HIV-1 viral load, and other laboratory tests including serum creatinine, ALT and AST, whole blood test, blood sugar level, urinary routine test. Cystatin C was not a regular test included in every patient but examined according to clinical needs.
For related risk factors, we included age, sex, body weight, history of AIDS, route of HIV-1 transmission, baseline laboratory data (CD4+T cell count, HIV viral load, and serum creatinine, urinary routine test), and presence or absence of other Medical conditions (concurrent use of ritonavir-boosted PIs (PI/r), concurrent nephrotoxic drugs such as ganciclovir and sulfamethoxazole/trimethoprim, diabetes mellitus defined by using antidiabetic agents or fasting plasma glucose higher than 126 mg/dl or plasma glucose higher than 200 mg/dl on two different days, hypertension defined by current treatment with antihypertensive agents or two successive measurements of systolic blood pressure (SBP) higher than 140 mmHg or diastolic blood pressure(DBP) higher than 90 mmHg at the clinic, coinfection with hepatitis B defined by positive hepatitis B surface antigen, coinfection with hepatitis C defined by positive HCV-Ab or positive HCV-RNA).
Laboratory Methods and Calculation
All of laboratory tests were routinely finished in our hospitals. Serum creatinine was evaluated in Beckman Coulter reagents used on AU5800 analyzers in clinical laboratories of Peking Union Medical College Hospital. Cystatin C(CysC) was assayed by particle-enhanced turbidimetric assay (PETIA; Beijing Strong Biotechnologies, Inc., Beijing, China). The plasma HIV-1 RNA load was measured using the COBAS Ampliprep/TaqMan 48 real-time RT-PCR Test (Roche, CA, USA) according to the manufacturer’s instructions. Immune profile of peripheral blood lymphocytes was analyzed by three-color flow cytometry (Epics XL flow cytometry; Beckman Coulter, USA).
eGFR was calculated using the CKD-EPI Chinese equation based on standardized serum creatinine, sex, and age,15 but also GFR based on CysC was calculated.16
The equation of GFR calculation was listed as following:
①CKD-EPIscr: eGFR=ax(Scr/b)cx(0.993)age
a: If the patient is black: male:163, female:166; If the patient is not black: male:141, female:144
b: male:0.9; female:0.7; c: (1) female:Scr≤0.7mg/dl, −0.329; Scr>0.7mg/dl,-1.209; (2) male:Scr≤0.9mg/dL,-0.411; Scr>0.9mg/dL,-1.209
②CKD-EPISCysC:eGFR=133x(SCysC/0.8)ax(0.996)agex(0.932, if female)
a:SCysC≤0.8mg/L,-0.499; SCysC>0.8mg/L,-1.328;
The baseline eGFR was estimated for each patient from age, sex, and serum creatinine measurements closest to and preceding the commencement of ART by no more than±14 days. The main consequences were serum creatinine and CysC level change from baseline, 4w, 12w, 24w, 36w till 48 weeks. If observed more than 30% decrement in eGFR relative to the baseline or eGFR lower than 60 mL/min per 1.73 m2, the clinical doctors would change potential nephrotoxic drugs.
Statistical Analysis
Statistical analysis was performed using SPSS software (SPSS® for Windows™ version 22.0, SPSS Inc., Chicago, IL, USA), GraphPad Prism 8.0 (GraphPad Software, Inc. La Jolla, CA, USA) and MedCalc v19.0.4. Data distribution was examined by Kolmogorov–Smirnov test. Reference ranges were presented using mean ± 2 standard deviation for parametric data and 2.5% and 97.5% percentages for non-parametric data. Comparisons among three variables were performed using one-way analysis of variance, while t-test for two groups parametric data and Mann–Whitney test for non-parametric data. Change in creatinine, CysC, eGFR were plotted from the baseline measurement until occurrence of change ART combination before 48 week or until 48 weeks. The effects of treatment and time on eGFR were evaluated using a mixed linear model. In this study, intra-group correlation coefficient, and Bland–Altman were used to compare the results of eGFRcr and eGFRCysC from one collection simultaneously measured. A P-value of less than 0.05 was considered statistically significant.
Results
Basic Characteristics at Enrollment
The characteristics of the patients are shown in Table 1. Total of patients were prescribed dolutegravir, including 37 patients were treated-naïve DTG+TDF-containing (group 1),23 patients treated with DTG-containing but no TDF (group 2) and 31 patients were switched-to DTG (group 4). And 47 patients using 3TC+TDF+EFV were picked up as control group (group 3) which was the first-line treatment in China. In general, the mean age was 36.73±11.32 years, the mean weight was 68.19±10.48 kg. One hundred and thirty (94.2%) patients were male, and eight (5.8%) patients were female. There were no significant differences between the treated-naïve groups with respect to baseline serum creatinine, cystatin C, eGFRcr, eGFRCysC, age, sex, weight, route of transmission, HBV and HCV infection, basic urine routine tests and status of diabetes, hypertension as well as co-current nephrotoxic drugs, only significant differences were detected regarding baseline CD4+T-cell level (group 1 versus group 2 versus group 3: p=0.004.)as well as opportunistic infections (group 1 versus group 2 versus group 3: p=0.018). Considering switch-to DTG group, only the rate of the transmission route was different from control group (group 3 vs group 4: p=0.017). The baseline serum creatinine, cystatin C, eGFRcr, eGFRCysC, and other factors were balanced in group 3 and group 4. Considering key drugs before switching to dolutegravir, usage of NNRTIs was 38.7% (n =12), PIs was 22.5% (n = 7), and INSTIs was32.3% (n = 10). Among them, the INSTI-based ART in 10 patients was totally Raltegravir(RAL), 7 patients using PI-based ART were Lopinavir and ritonavir (LPV/r).
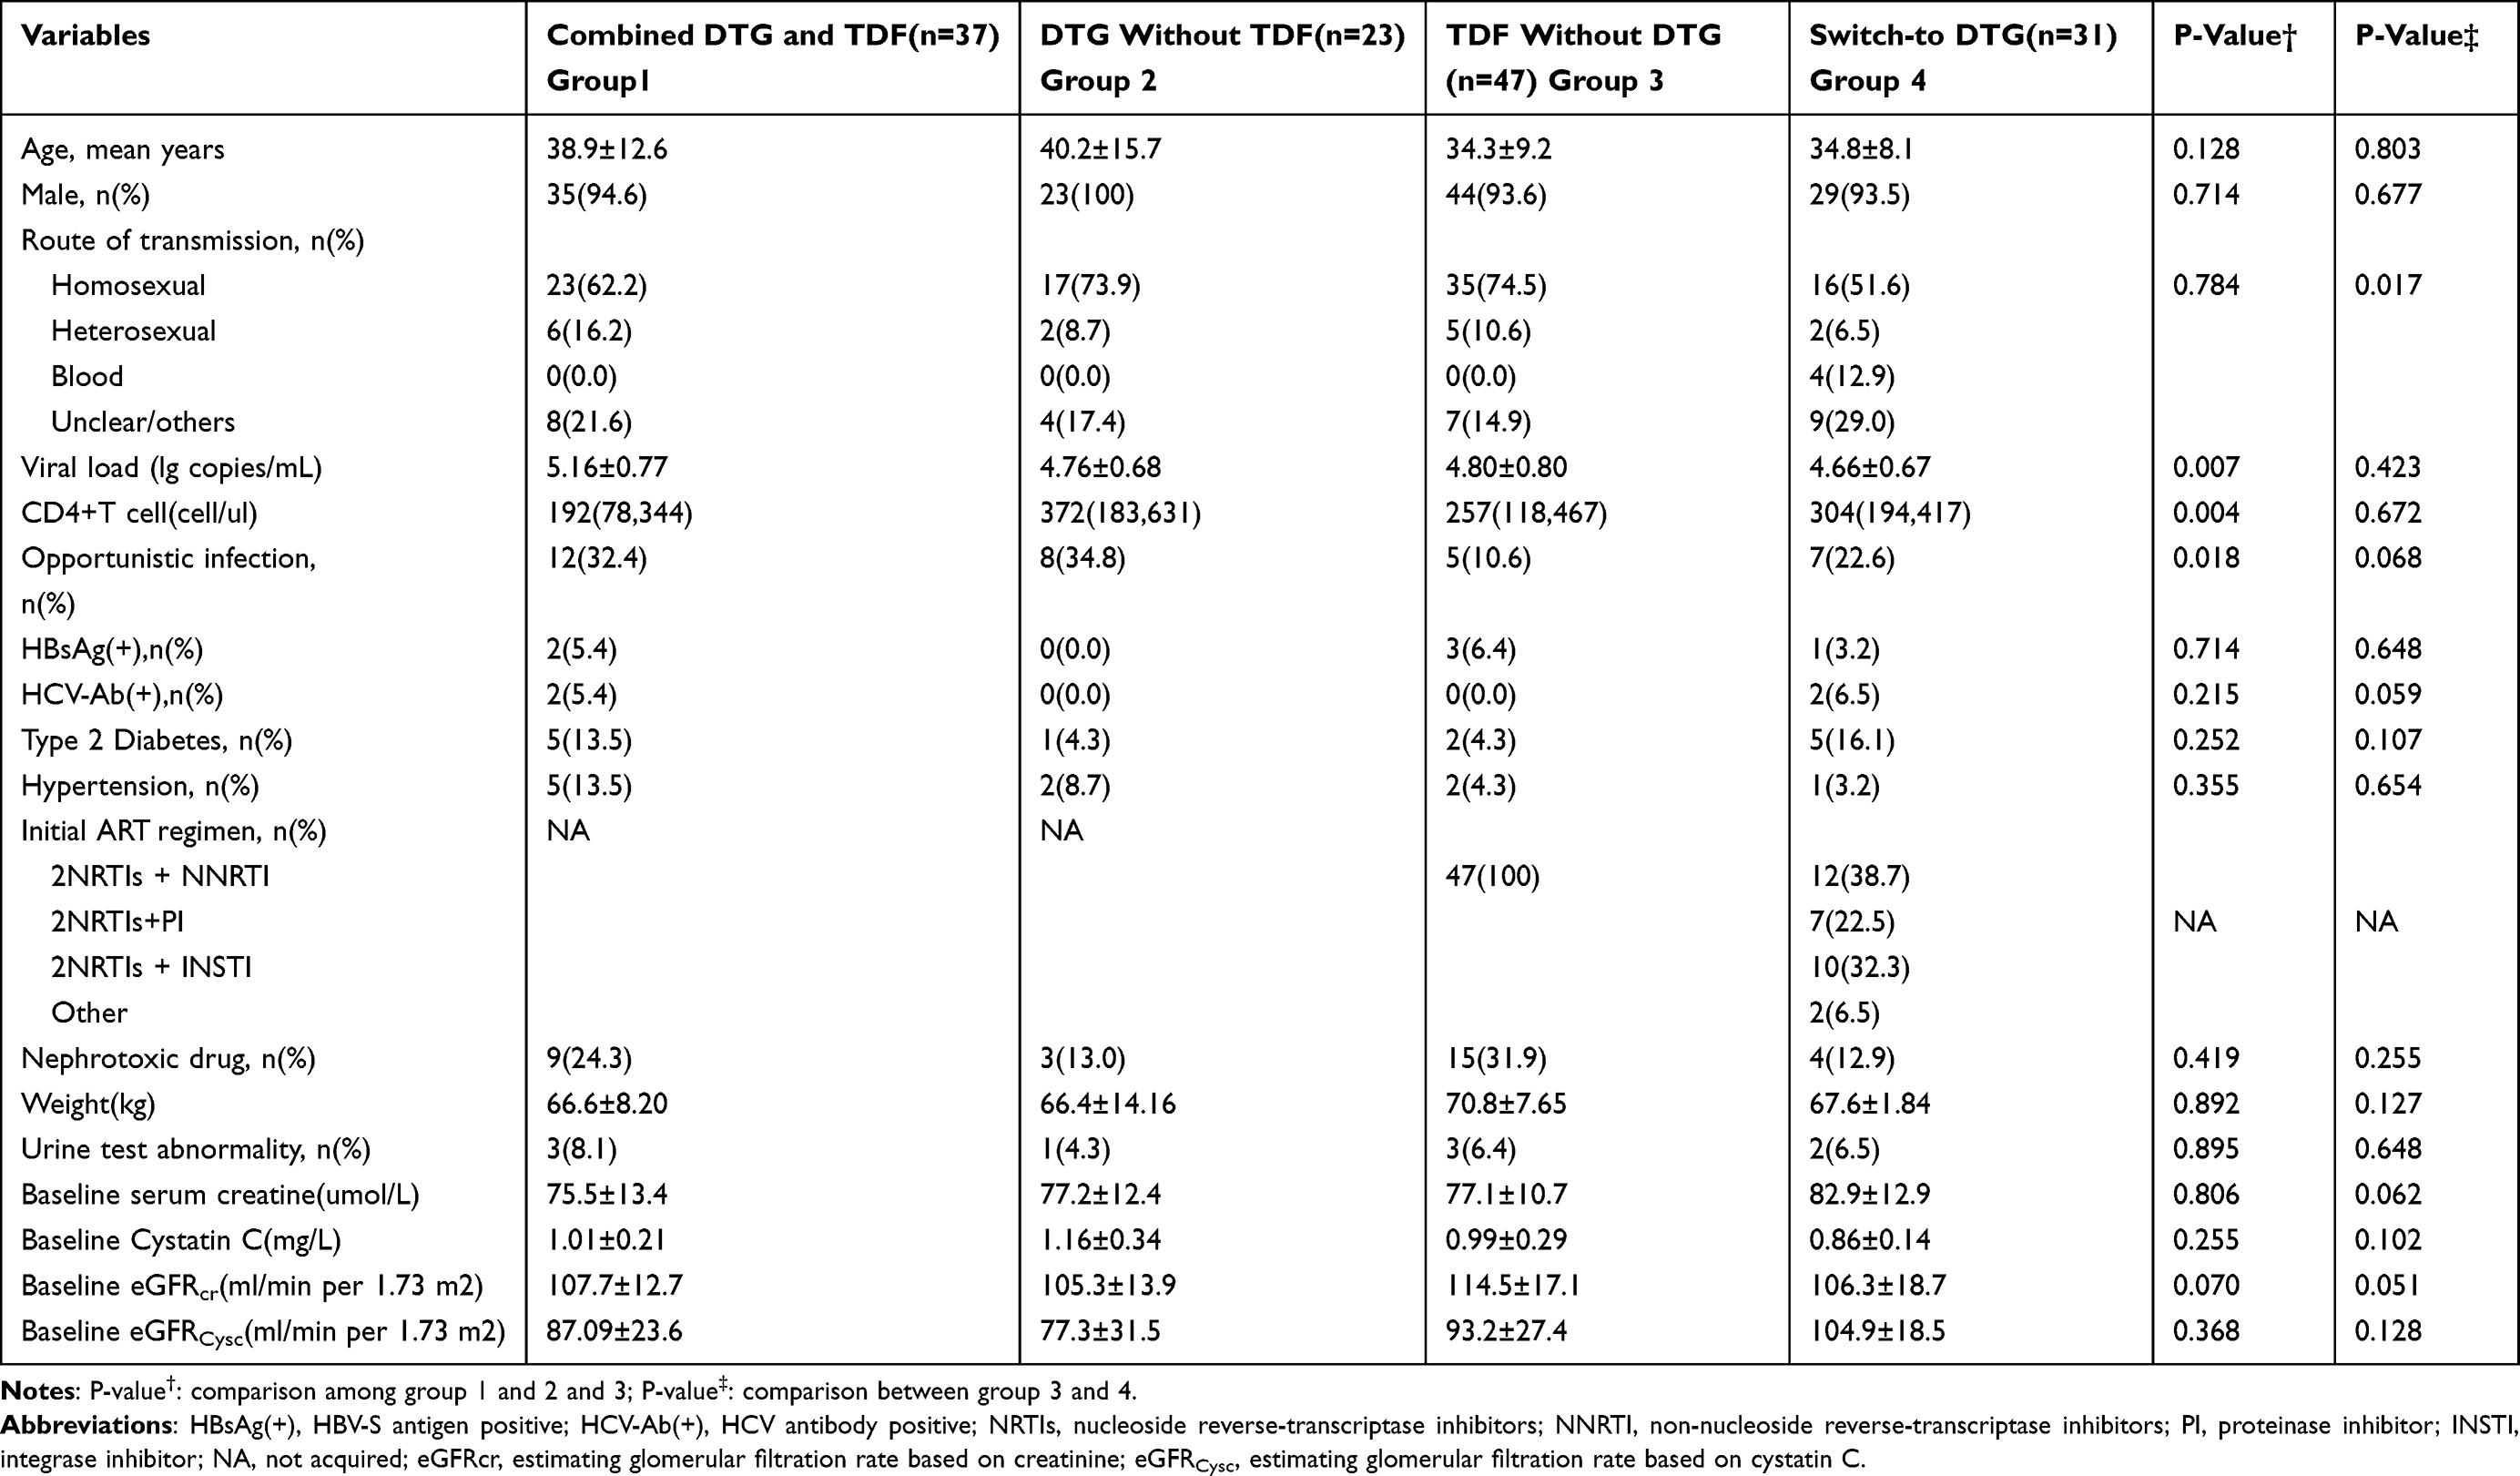 |
Table 1 Baseline Characteristics of These Patients Among Four Groups |
Dynamic of Serum Creatinine and eGFRcr from Baseline to 48 Weeks Among Four Groups
Serum creatinine and calculated eGFRcr levels were compared at baseline, 4-week, 12 week, 24 week, 36 week and 48 week in four groups. Serum creatinine and eGFRcr levels at 4 weeks after therapy were significantly different from the baseline level in DTG-containing groups (group 1, group 2) whether covered up TDF or not, and keep significant difference at 12 weeks, 24 weeks, 36 weeks and 48 weeks (Figure 1A–D). But there was no significant difference occurred at various time-point in control group (Figure 1E and F). Since most of the patients switch-to DTG have experienced long-term treatment, their supervision was not regular as treatment-naïve patients. Even that, the results suggested the significant increased creatinine and decreased eGFRcr at 24 week and 48 week when compared to the baseline (Figure 1G and H). In particular, there were no difference of serum creatinine or eGFRcr level change between time-point of 4w, 12w,24w,36w and 48w in DTG-containing groups.
 |
Figure 1 The dynamics of serum creatinine and eGFRcr among four groups (** <0.01,***<0.001; ns: not significant). (A, C, E and G) showed the mean level of serum creatinine from baseline to 48w. (B, D, F and H) showed the mean estimating glomerular filtration rate based on serum creatinine, and the equation used CKD-EPI, was expressed as equation depicted above. |
Cross-Group Comparison of Creatinine and eGFRcr Levels
A cross-group comparison of creatinine and eGFRcr levels at the different treatment timepoints showed a significant difference between the groups. Apart from pre-treatment serum creatinine and eGFRcr level, creatinine was significant higher and eGFRcr levels was significantly lower in group 1 and group 2 when compared with control group (0w: p=0.99, p=0.85, respectively; 4w,12w,24w, 48w: all of p<0.05; Supplementary Figure 1A and 1C), but no difference between group 1 and group 2 (both p>0.05). We also compared inter-group change of serum creatinine and eGFRcr from baseline till 48 week, there were no difference between group 1 and group 2 but significant increase of serum creatinine and decrease of eGFRcr in comparison with control group (Supplementary Figure 1B and D). As for switch-to DTG-containing group, baseline serum creatinine was slightly higher than control group while eGFRcr level was equal to control group (p=0.0182,p=0.0506, respectively, Supplementary Figure 2A and B). At 24 week and 48 week, the significantly higher-level of creatinine and lower eGFRcr were persisted in switch-to DTG-containing group than control group (see in Supplementary Figure 2).
CysC and eGFRCysC Level Dynamics During the 12 Months of Therapy
An analysis of dynamics of CysC levels across the 12th month of therapy showed no significant difference between group 1 and group 2 (Figure 2A and C:p=0.062, p=0.482 respectively). The eGFR calculated from CysC does not suggest a significant difference among the baseline value, 4w,12w,24w,36w,48 weeks in the above groups (Figure 2B and D; Group 1 and Group 2: p=0.1936,p=0.1282, respectively). In particular, no significant change in the CysC and eGFRCysC level were found in the Switch-to DTG group in all time-point (Figure 2G and H; p=0.4904, p=0.09, respectively). Interestingly, the CysC level has changed significantly in the control group, which initiated HIV treatment with 3TC+TDF+EFV. The CysC decreased from baseline till 4 weeks and 12 weeks (p=0.281, p=0.04, respectively), while the CysC level in the 4 weeks was significantly different from CysC in 12w, 24w, 36w and 48w (Figure 2E: p=0.0022, p=0.0085, p=0.0108, p=0.006, respectively). When compared CysC and eGFRCysC cross-group at different time, we found that mean CysC was lower in control group than TDF+DTG-containing group and DTG-containing group at some follow-up time (Supplementary Figures 3A and C), for instance, significant higher CysC and eGFRCysC in DTG+TDF-containing group and DTG-containing group than control group at 12 week (Supplementary Figure 3A:p=0.0026,p=0.010; Supplementary Figure 3C:p=0.0042,p=0.0049, respectively), which verified the decreased level of Cystatin C in control group. There was no significant difference between DTG+TDF-containing group and DTG-containing group. The median change of CysC and eGFRCysC suggested no difference between three groups (Supplementary Figure 3B and D). Also, CysC dynamics in different time points were described personally (Supplementary Figure 4).
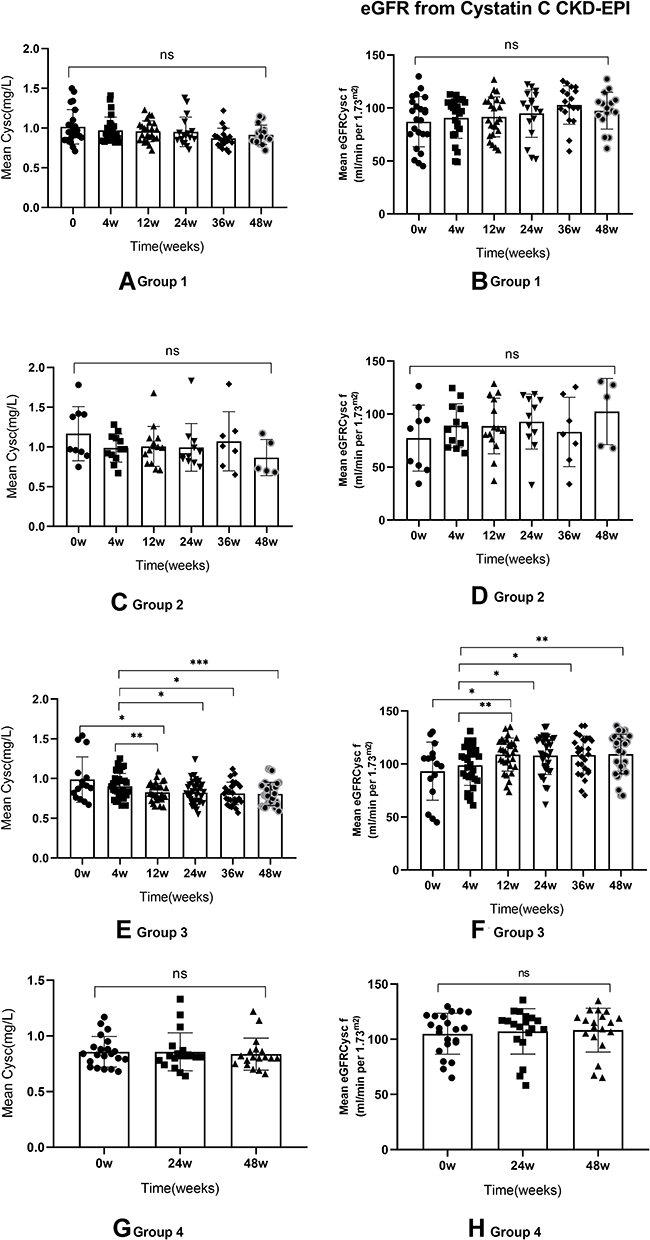 |
Figure 2 The dynamic of CysC and eGFRCysC among four groups (* <0.05; ** <0.01,***<0.001; ns: not significant). (A, C, E and G) showed the mean level of cystatin C from baseline to 48w. (B, D, F and H) showed the mean estimating glomerular filtration rate based on cystatin C, and the equation used CKD-EPI, was expressed as equation depicted above. |
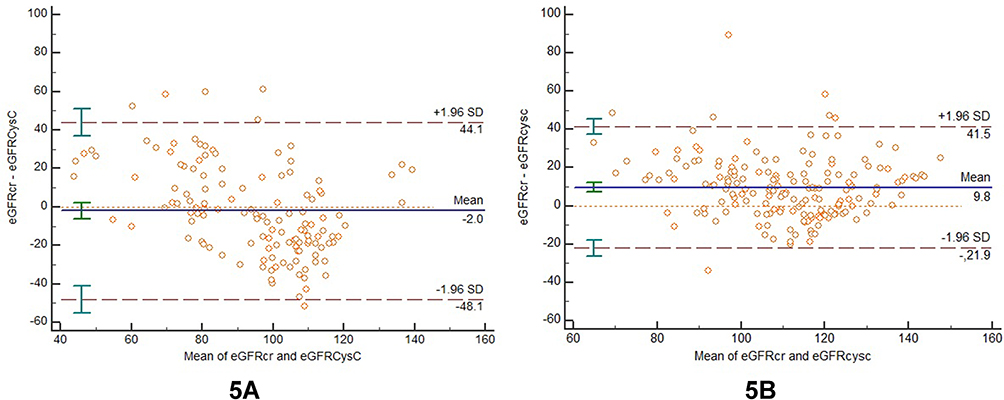 |
Figure 3 Bland–Altman of consistency between eGFRcr and eGFRCysC among DTG-treatment group (5A, group 1 and group 2) and control group (5B). The horizontal axe is the mean value of eGFRcr and eGFRCysC results and the vertical axe is the difference value of eGFRcr and eGFRCysC. The solid blue lines represent the mean value of the difference. The top and bottom dotted lines are the 95% limits of agreement (95% LoA). |
The Significant eGFRcr Reduction Was Higher in DTG-Treatment Group
Considering >30% eGFRcr decrease than pretreatment or eGFRcr lower than 60 mL/min per 1.73 m2 were meaningful in clinical practice, we divided them into different level of eGFRcr decrease in four groups (Table 2). The results suggested significant higher percentage of patients had decreased eGFRcr in DTG+TDF group and DTG without TDF group when compared with the control group. In particular, no significant difference was found between combination DTG with TDF group and DTG without TDF group when their eGFRcr decrement around 10–20% (p=0.881; p=0.445, respectively). However, a significant higher proportion of patients who had decreased eGFRcr>30% were found in combination DTG with TDF group when compared with group 2 and group 3 (p=0.014; p<0.001, respectively).
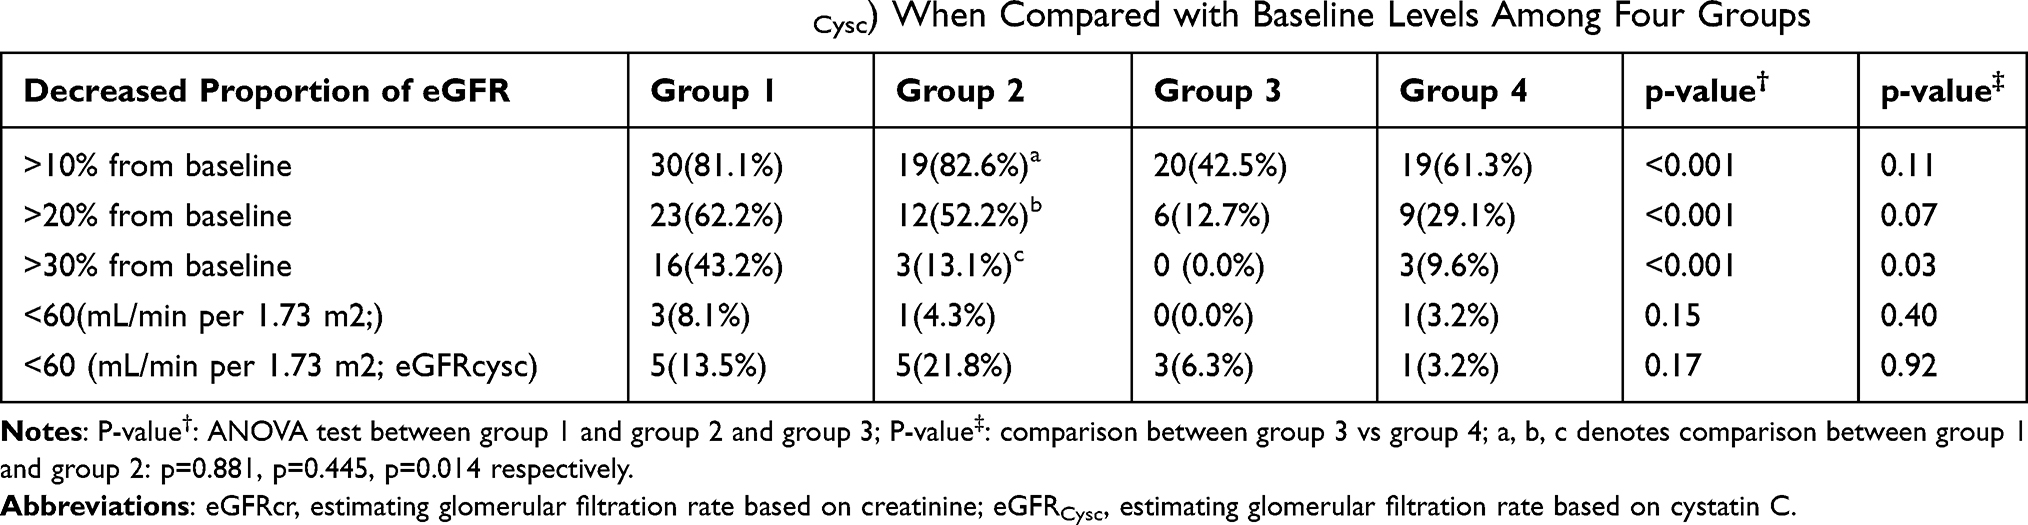 |
Table 2 Decreased Proportion of eGFRcr (or eGFRCysc) When Compared with Baseline Levels Among Four Groups |
In addition, the number of patients whose eGFRcr<60 mL/min per 1.73 m2 were 3 (8.1%), 1 (4.3%), 0 (0.0%), 1 (3.2%) in group 1, group 2, group 3, group 4 respectively (group 1 vs group 2 vs group 3: p=0.15; group 4 vs group 3: p=0.40, respectively). In group 1, eGFRcr<60 mL/min per 1.73 m2 among three patients occurred at 4w, 36w, 48w who had no history of diabetes or hypertension or co-current nephrotoxic drugs. In group 2, the only one patient had a history of hypertension while the patient in group 4 had no spectacular history but with baseline serum level upper limit of normal.
Individuals with eGFRCysC <60 mL/min per 1.73 m2 were also identified. Five, five, three, and one subjects from group 1 to group 4, respectively, met these criteria. However, 4/5,4/5,3/3,0/1 subjects had documents for baseline <60 mL/min per 1.73 m2 instead of significant decrements after treatment. The left one person in group 1 had a history of nephrotoxic drugs and eGFRCysC returned towards the “normal” range over the study period and another patient in group 2 had a history of hypertension. Besides, there were three patients who had obviously abnormal basic urine routine tests (urinary protein>3g) in group 1, group 2 and group 4 when they started ART due to their commodities such as diabetes. However, there were no deterioration of urinary protein and qualitative determination of urinary protein when they were in follow-up. The other patients who have abnormal basic urine routine tests (usually urinary protein 0.3–1g) transiently showed no sign of continuous worsen renal function during ART-treatment.
Measurement of eGFRcr and eGFRCysC Were Less Consistent in DTG-Treatment Patients
Bland–Altman diagram and Intra-class correlation coefficient (ICC) were used to assess consistency of eGFRcr and eGFRCysC from the same sample. Considering relatively small sample size collected in DTG-treatment patients, we gathered patients who used DTG (group 1 and group 2) as a whole when comparing with control group (group 3). The ICC value in DTG-treatment patients was 0.6339 (95% CI: 0.4829 to 0.7408), lower than control group, which value was 0.7588 (95% CI 0.6742 to 0.8215). It usually considers consistency to be better when the ICC value is over 0.75. Bland–Altman diagram showed average bias and variation of “bias” visually (Figure 3A and B). The mean difference was −3.1 mL/min per 1.73 m2 and 9.8 mL/min per 1.73 m2 in DTG-treatment group and control group, respectively. The bias was less significant in clinical practice. As can be seen from the figure, 5.34% of the points (7/131) are beyond 95% LoA (− 48.1~ 44.1) in DTG-treatment group (Figure 3A), while 4.06% of the points (7/172) are beyond 95% LoA (− 21.9~ 41.5) in control group (Figure 3B).
Discussion
In our study, two types of biomarkers of kidney function were evaluated in HIV-positive patients who received different ART regimens over a 48-week follow-up period. ART is highly effective in virologic suppression of HIV infection and early onset of ART reduces mortality. Whereas, some antiretroviral drugs, like TDF-associated nephrotoxicity, have potential to accelerate decline in estimated glomerular filtration rate (eGFR) and cause proximal tubular dysfunction.5,17 The newly developed integrase inhibitor dolutegravir was reported to elevate serum creatinine mildly regardless of combination with other ART medications or two-drug therapy.18,19 Therefore, elevated serum creatinine or decreased eGFRcr during treatment should be properly interpreted and treatment should be censured accordingly.
Our results suggested that DTG-containing therapeutic regimens presented higher serum creatinine elevation and decreased eGFRcr than TDF-containing group until 48 weeks, which was consistent with results from randomized clinical trials.9,18–20 In healthy people, Koteff et al demonstrated that administration of DTG decreased serum creatinine clearance rate(CLcr) by 10–14%.21 Venter et al18 compared tenofovir alafenamide fumarate/ emtricitabine/dolutegravir (TAF/FTC/DTG) group, TDF/FTC/DTG group and TDF/FTC/EFV found that at 48 week, creatinine clearance rate was significant lower in DTG-containing group (median −16 mL/min) and lower in the TAF-base (median −13mL/min) group than in the TDF-based (median −2.5mL/min) group. Similarly, the combined 48-week results from the DTG randomized clinical trials showed reductions in creatinine clearance DTG (−16.5 mL/min), implying that the effects on renal tubular may be common.9
In our results of group 1 and group 2, eGFRcr decreased significantly at 4 week but no significant decline after 4 weeks, which may mainly due to the inhibition of organic cation transporter 2 (OCT2) by DTG instead of tenofovir. We found that TDF co-administered with lamivudine (3TC) and efavirenz (EFV) have shown no effect on serum creatinine and eGFRcr until 48 weeks and the proportion of mild eGFRcr change were minor than DTG-containing therapeutic groups. In consistency, clinical trials have shown initial reductions in eGFRcr of 10–15% in patients in whom TDF combined with cobicistat(COBI)-boosted protease could reach a new steady state after 4 weeks, with no further decline up to 2 year.22 Whereas TDF [co-administered with emtricitabine (FTC) and efavirenz (EFV)] have shown no effect on serum creatinine and eGFRcr to 48 weeks in ART-naïve patients.23,24 Besides, higher percentage of severe (>30% eGFRcr decrease or eGFRcr lower than 60 mL/min per 1.73 m2) eGFRcr decrement was observed in DTG+TDF containing group and DTG-containing group than control group. Although we have not observed any actual event of kidney damage in patients, it will interfere with the clinical judgment of “real or fake” renal function change. In this way, we need either seek for reliable but convenient renal biomarkers for clinical judgement or try to build new set-point of “baseline” serum creatinine or eGFRcr level, for example, approximately 4 weeks after initiation of these drugs.
The study in Japanese suggested that no differences in cystatin C and eGFRCysc between baseline and at 48 weeks after DTG administration and eGFRCysC was more accurate than eGFRcr (40% accuracy compared to 93%).25 Another study showed with a similar result of +8.6 μmol/L increased serum creatinine values but no significant change in the cystatin C value variation and associated estimated GFR.26 These findings were consistent with our study, which did not reveal any changes in longitudinal cystatin C and cystic eGFR within 48 weeks of treatment with DTG. Bland–Altman diagram and Intra-class correlation coefficient of eGFRcr and eGFRCysC proved the less consistent results in DTG-treatment patients rather than TDF-treatment patients. However, we must take into account that the level of cystatin C may have been minimally affected by chronic inflammation caused by HIV infection or higher viral load,27 as CysC and eGFRCysC in control group had a slight but significant change from 4 week to 48 week in our results which is not consistent with serum creatinine and eGFRcr.
In real-world comparison study, Casado et al28 evaluated kidney function in patients treated by one or two inhibitors of the tubular secretion of creatinine with serum creatinine and cystatin C at 48 week. Another cross-sectional study compared the means of eGFRCysC and eGFRCr on patients switch to DTG and concluded that cystatin C was probably more relevant from a clinical perspective.29 Although these studies may have larger sample size and more type of regimens (inhibitors of OCT2), our study compared serum creatinine and Cystatin C in a more comprehensive manner, and calculated eGFR based on them in the transversal and longitudinal treatment of HIV by DTG and/or TDF. In addition, our results may thus be particularly interesting as we were able to compare cystatin C-based formulas with creatinine-based formulas to estimate GFR in patients treated naïve with DTG and switch-to DTG. Finally, we included patients with PI-based ART (LPV/r) before switch-to DTG-based regimen, which may have potential effect on renal function when combined with TDF on the literature data.30–32 Whether the “overlap” effect would last until switch-to ART regimen remained unknown. Besides, patients with chronic disease before ART treatment, such as uncontrolled diabetes, hypertension, have a higher risk of progression of kidney disease and their kidney function observation were included. For instance, DTG may worsen diabetes management in HIV-infected patients because its chelating effect of mg2+ may undermine insulin action.33,34 Their kidney function should be monitored more closely and in combination with more renal biomarkers to decide on appropriate antiretroviral therapy.
The limitations of this study include this study was single-center, retrospective design and a relatively small sample size, and we could not document the laboratory parameters strictly like randomized clinical trials. Moreover, we did not include more biomarkers for weighing renal function, for example, albumin, Beta-2-microglobulin (β2-MG), Urinary Albumin to Creatinine Ratio, Microalbuminuria/Creatinine, which may be sensitive but less convenient for monitoring. Finally, we could not confirm our results by measuring iohexol clearance, the gold standard method to assess the GFR.
In conclusion, we found that change of serum creatinine level in DTG-containing ART in clinical practice needs for attention due to a part of elevation can be attributed to DTG effect on renal serum creatinine secretion, especially combined with tenofovir or events having potential damage to the renal function. And it is more stable using Cystatin C and eGFRCysC levels for assessing glomerular filtration rate than merely serum creatinine and eGFRcr when evaluating renal function in DTG-treatment patients.
Abbreviations
DTG, dolutegravir; TDF, tenofovir disoproxil fumarate; 3TC, lamivudine; EFV, efavirenz; CysC, cystatin C; FTC, emtricitabine; LPV/r, lopinavir and ritonavir; ART antiretroviral treatment; TAF, tenofovir alafenamide fumarate; SBP, systolic blood pressure; DBP, diastolic blood pressure; eGFRcr, estimated glomerular filtration rate based on serum creatinine; eGFRCysc, estimated glomerular filtration rate based on cystatin C; COBI, cobicistat; CLcr, serum creatinine clearance rate; NRTIs, nucleoside reverse-transcriptase inhibitors; NNRTI, non-nucleoside reverse-transcriptase inhibitors; PI, proteinase inhibitor; INSTI, integrase inhibitor. HBsAg(+), HBV-S antigen positive; HCV-Ab(+), HCV antibody positive; β2-MG, Beta-2-microglobulin.
Acknowledgments
We thank all participants for their contributions to this study and all laboratory researchers did the experiments, data collectors integrated the information.
Funding
This work was supported by the National Key Technologies R&D Program for the 13th Five-year Plan (2017ZX10202101-001) and Key Clinical Specialties Program of Beijing, China. The funding bodies played no role in the design of the study, data collection, data analysis, interpretation of data, or writing of the manuscript.
Disclosure
The authors declare that they have no competing interests.
References
1. AIDS and Hepatitis C Professional Group,Society of Infectious Diseases,Chinese Medical Association;Chinese Center for Disease Control and Prevention.The Guidelines for diagnosis and treatment of AIDS in China(version of 2018). Chin J Infect Dis. 2018,36(12):705-724.
2. Chikwapulo B, Ngwira B, Sagno JB, Evans R. Renal outcomes in patients initiated on tenofovir disoproxil fumarate-based antiretroviral therapy at a community health centre in Malawi. Int J STD AIDS. 2018;29(7):650–657. doi:10.1177/0956462417749733
3. Mulenga L, Musonda P, Mwango A, et al. Effect of baseline renal function on tenofovir-containing antiretroviral therapy outcomes in Zambia. Clin Infect Dis. 2014;58(10):1473–1480. doi:10.1093/cid/ciu117
4. Kamkuemah M, Kaplan R, Bekker LG, Little F, Myer L. Renal impairment in HIV-infected patients initiating tenofovir-containing antiretroviral therapy regimens in a primary healthcare setting in South Africa. Trop Med Int Health. 2015;20(4):518–526. doi:10.1111/tmi.12446
5. Kinai E, Hanabusa H. Progressive renal tubular dysfunction associated with long-term use of tenofovir DF. AIDS Res Hum Retroviruses. 2009;25(4):387–394. doi:10.1089/aid.2008.0202
6. Jones R, Stebbing J, Nelson M, et al. Renal dysfunction with tenofovir disoproxil fumarate-containing highly active antiretroviral therapy regimens is not observed more frequently: a cohort and case-control study. J Acquir Immune Defic Syndr. 2004;37(4):1489–1495. doi:10.1097/01.qai.0000138983.45235.02
7. Laprise C, Baril JG, Dufresne S, Trottier H. Association between tenofovir exposure and reduced kidney function in a cohort of HIV-positive patients: results from 10 years of follow-up. Clin Infect Dis. 2013;56(4):567–575. doi:10.1093/cid/cis937
8. Nishijima T, Kawasaki Y, Tanaka N, et al. Long-term exposure to tenofovir continuously decrease renal function in HIV-1-infected patients with low body weight: results from 10 years of follow-up. AIDS. 2014;28(13):1903–1910. doi:10.1097/QAD.0000000000000347
9. Raffi F, Rachlis A, Stellbrink HJ, et al. Once-daily dolutegravir versus raltegravir in antiretroviral-naive adults with HIV-1 infection: 48 week results from the randomised, double-blind, non-inferiority SPRING-2 study. Lancet. 2013;381(9868):735–743. doi:10.1016/S0140-6736(12)61853-4
10. Walmsley SL, Antela A, Clumeck N, et al. Dolutegravir plus Abacavir-lamivudine for the treatment of HIV-1 infection. N Engl J Med. 2013;369(19):1807–1818. doi:10.1056/NEJMoa1215541
11. Walmsley S, Baumgarten A, Berenguer J, et al. Brief report: dolutegravir plus abacavir/lamivudine for the treatment of HIV-1 infection in antiretroviral therapy-naive patients: week 96 and week 144 results from the SINGLE randomized clinical trial. J Acquir Immune Defic Syndr. 2015;70(5):515–519. doi:10.1097/QAI.0000000000000790
12. Stellbrink HJ, Reynes J, Lazzarin A, et al. Dolutegravir in antiretroviral-naive adults with HIV-1: 96-week results from a randomized dose-ranging study. AIDS. 2013;27(11):1771–1778. doi:10.1097/QAD.0b013e3283612419
13. Rapoport A, Husdan H. Endogenous creatinine clearance and serum creatinine in the clinical assessment of kidney function. Can Med Assoc J. 1968;99(4):149–156.
14. Longenecker CT, Scherzer R, Bacchetti P, Lewis CE, Grunfeld C, Shlipak MG. HIV viremia and changes in kidney function. AIDS. 2009;23(9):1089–1096. doi:10.1097/QAD.0b013e32832a3f24
15. Levey AS, Stevens LA, Schmid CH, et al. A new equation to estimate glomerular filtration rate. Ann Intern Med. 2009;150(9):604–612. doi:10.7326/0003-4819-150-9-200905050-00006
16. Inker LA, Schmid CH, Tighiouart H, et al. Estimating glomerular filtration rate from serum creatinine and cystatin C. N Engl J Med. 2012;367(1):20–29. doi:10.1056/NEJMoa1114248
17. Suzuki S, Nishijima T, Kawasaki Y, et al. Effect of tenofovir disoproxil fumarate on incidence of chronic kidney disease and rate of estimated glomerular filtration rate decrement in HIV-1-infected treatment-naive asian patients: results from 12-year observational cohort. AIDS Patient Care STDS. 2017;31(3):105–112. doi:10.1089/apc.2016.0286
18. Venter WDF, Moorhouse M, Sokhela S, et al. Dolutegravir plus two different prodrugs of tenofovir to treat HIV. N Engl J Med. 2019;381(9):803–815. doi:10.1056/NEJMoa1902824
19. Wijting IE, Rokx C, Zillikens MC, et al. Changes in renal, bone, lipid, and inflammation markers in HIV-1 patients after combination antiretroviral therapy simplification to dolutegravir monotherapy. Int J STD AIDS. 2019;30(11):1042–1048. doi:10.1177/0956462419848962
20. Sculier D, Wandeler G, Yerly S, et al. Efficacy and safety of dolutegravir plus emtricitabine versus standard ART for the maintenance of HIV-1 suppression: 48-week results of the factorial, randomized, non-inferiority SIMPL’HIV trial. PLoS Med. 2020;17(11):e1003421. doi:10.1371/journal.pmed.1003421
21. Koteff J, Borland J, Chen S, et al. A Phase 1 study to evaluate the effect of dolutegravir on renal function via measurement of iohexol and para-aminohippurate clearance in healthy subjects. Br J Clin Pharmacol. 2013;75(4):990–996. doi:10.1111/j.1365-2125.2012.04440.x
22. Rockstroh JK, DeJesus E, Henry K, et al. A randomized, double-blind comparison of coformulated elvitegravir/cobicistat/emtricitabine/tenofovir vs ritonavir-boosted atazanavir plus coformulated emtricitabine and tenofovir for initial treatment of HIV-1 infection: analysis of week 96 results. J Acquir Immune Defic Syndr. 2013;62(5):483–486. doi:10.1097/QAI.0b013e318286415c
23. Post FA, Moyle GJ, Stellbrink HJ, et al. Randomized comparison of renal effects, efficacy, and safety with once-daily Abacavir/lamivudine versus tenofovir/emtricitabine, administered with efavirenz, in antiretroviral-naive, HIV-1-infected adults: 48-week results from the ASSERT study. J Acquir Immune Defic Syndr. 2010;55(1):49–57. doi:10.1097/QAI.0b013e3181dd911e
24. Sax PE, DeJesus E, Mills A, et al. Co-formulated elvitegravir, cobicistat, emtricitabine, and tenofovir versus co-formulated efavirenz, emtricitabine, and tenofovir for initial treatment of HIV-1 infection: a randomised, double-blind, Phase 3 trial, analysis of results after 48 weeks. Lancet. 2012;379(9835):2439–2448. doi:10.1016/S0140-6736(12)60917-9
25. Yukawa S, Watanabe D, Uehira T, Shirasaka T. Clinical benefits of using inulin clearance and cystatin C for determining glomerular filtration rate in HIV-1-infected individuals treated with dolutegravir. J Infect Chemother. 2018;24(3):199–205. doi:10.1016/j.jiac.2017.10.015
26. Palich R, Tubiana R, Abdi B, et al. Plasma cystatin C as a marker for estimated glomerular filtration rate assessment in HIV-1-infected patients treated with dolutegravir-based ART. J Antimicrob Chemother. 2018;73(7):1935–1939. doi:10.1093/jac/dky112
27. Longenecker CT, Kitch D, Sax PE, et al. Reductions in plasma cystatin C after initiation of antiretroviral therapy are associated with reductions in inflammation: ACTG A5224s. J Acquir Immune Defic Syndr. 2015;69(2):168–177. doi:10.1097/QAI.0000000000000557
28. Casado JL, Monsalvo M, Vizcarra P, Fontecha M, Serrano-Villar S, Moreno S. Evaluation of kidney function in HIV-infected patients receiving an antiretroviral regimen containing one or two inhibitors of the tubular secretion of creatinine. HIV Med. 2019;20(10):648–656. doi:10.1111/hiv.12784
29. Galizzi N, Galli L, Poli A, Spagnuolo V, Castagna A, Gianotti N. Glomerular filtration rate estimated by cystatin C formulas in HIV-1 patients treated with dolutegravir, rilpivirine or cobicistat. New Microbiol. 2018;41(4):256–261.
30. Goicoechea M, Liu S, Best B, Sun S, Jain S, Kemper C; California Collaborative Treatment Group, T. Greater tenofovir-associated renal function decline with protease inhibitor-based versus nonnucleoside reverse-transcriptase inhibitor-based therapy. J Infect Dis. 2008;197(1):102–108. doi:10.1086/524061
31. Mwafongo A, Nkanaunena K, Zheng Y, et al.; AIDS Clinical Trial Group (ACTG) A5208 Team. Renal events among women treated with tenofovir/emtricitabine in combination with either lopinavir/ritonavir or nevirapine. AIDS. 2014;28(8):1135–1142. doi:10.1097/QAD.0000000000000202
32. Buchacz K, Young B, Baker RK, et al. Renal function in patients receiving tenofovir with ritonavir/lopinavir or ritonavir/atazanavir in the HIV Outpatient Study (HOPS) cohort. J Acquir Immune Defic Syndr. 2006;43(5):626–628. doi:10.1097/01.qai.0000242461.35768.45
33. Hailu W, Tesfaye T, Tadesse A. Hyperglycemia after dolutegravir-based antiretroviral therapy. Int Med Case Rep J. 2021;14:503–507. doi:10.2147/IMCRJ.S323233
34. McLaughlin M, Walsh S, Galvin S. Dolutegravir-induced hyperglycaemia in a patient living with HIV. J Antimicrob Chemother. 2018;73(1):258–260. doi:10.1093/jac/dkx365
 © 2022 The Author(s). This work is published and licensed by Dove Medical Press Limited. The
full terms of this license are available at https://www.dovepress.com/terms
and incorporate the Creative Commons Attribution
- Non Commercial (unported, 3.0) License.
By accessing the work you hereby accept the Terms. Non-commercial uses of the work are permitted
without any further permission from Dove Medical Press Limited, provided the work is properly
attributed. For permission for commercial use of this work, please see paragraphs 4.2 and 5 of our Terms.
© 2022 The Author(s). This work is published and licensed by Dove Medical Press Limited. The
full terms of this license are available at https://www.dovepress.com/terms
and incorporate the Creative Commons Attribution
- Non Commercial (unported, 3.0) License.
By accessing the work you hereby accept the Terms. Non-commercial uses of the work are permitted
without any further permission from Dove Medical Press Limited, provided the work is properly
attributed. For permission for commercial use of this work, please see paragraphs 4.2 and 5 of our Terms.