")
Back to Journals » Clinical Ophthalmology » Volume 10
Comparison of Goldmann applanation tonometry and Pascal dynamic contour tonometry in relation to central corneal thickness and corneal curvature
Authors Andreanos K, Koutsandrea C, Papaconstantinou D, Diagourtas A , Kotoulas A, Dimitrakas P, Moschos MM
Received 17 June 2016
Accepted for publication 26 July 2016
Published 9 December 2016 Volume 2016:10 Pages 2477—2484
DOI https://doi.org/10.2147/OPTH.S115203
Checked for plagiarism Yes
Review by Single anonymous peer review
Peer reviewer comments 2
Editor who approved publication: Dr Scott Fraser
Konstantinos Andreanos, Chryssanthi Koutsandrea, Dimitris Papaconstantinou, Andreas Diagourtas, Andreas Kotoulas, Panagiotis Dimitrakas, Marilita M Moschos
First Department of Ophthalmology, University of Athens, “G. Gennimatas” General Hospital of Athens, Athens, Greece
Purpose: The aim of the study was to assess the influence of central corneal thickness (CCT) and corneal curvature in tonometry measurements taken by Goldmann applanation tonometry (GAT) and Pascal dynamic contour tonometry (DCT).
Methods: This was a prospective study of 185 eyes from 97 subjects, attending outpatient ophthalmology appointments, who underwent intraocular pressure measurements by GAT and Pascal DCT. CCT and corneal curvature were obtained using ultrasound pachymetry and Orbscan topography, respectively. All measurements were carried out among males and females during the period 2009–2012. Apart from the usual descriptive and exploratory data analysis, one-way analysis of variance and agreement analysis were performed, linear as well as intraclass correlation coefficients were estimated, and multiple scatter and Bland–Altman plots were produced.
Results: Mean IOP measurements obtained were 17.21±4.10 mmHg by DCT and 13.23±4.07 mmHg by GAT. Mean difference between the GAT and DCT measurements was 3.88±2.8 mmHg. Mean CCT and corneal curvature were 522.78±52 µm and 43.83±2.9823 D, respectively.
Conclusion: Intraocular pressure measured by GAT was consistently lower when compared with DCT, and this difference was greatest with thinner CCT. Flat corneas seem to influence GAT measurements compared to DCT.
Keywords: glaucoma, Goldmann, Pascal, tonometry
Introduction
Accurate determination of intraocular pressure (IOP) is fundamental in the diagnosis, monitoring, and treatment of glaucoma. Goldmann applanation tonometry (GAT) is considered the golden standard for IOP measurements. However, it is known to be affected by changes in corneal thickness, structure, and curvature.1 To achieve precise measurements independent of these corneal properties, research has developed alternative tonometry methods.
Pascal dynamic contour tonometery (DCT) claims to be relatively unaffected by corneal biomechanical properties. The manufacturer states that unlike Goldmann tonometry, the Pascal DCT sensor tip does not applanate the cornea and that its concave shape causes a relaxation of the cornea, which helps minimize any influence on measurements that are attributed to various corneal properties. DCT also evaluates ocular pulse amplitude, which is the difference between the average systolic and diastolic IOPs.
The purpose of this study was to compare IOP measurements obtained by GAT and DCT and to assess the relationship between measurements, central corneal thickness (CCT), and corneal curvature.
Subjects and methods
This was a prospective study of 97 subjects performed at the glaucoma department of the 1st University Ophthalmological Clinic in Athens. The study was approved by the General Hospital of Athens G.Gennimatas Scientific Board and was conducted in accordance with the principles of the Declaration of Helsinki. Written informed consent was obtained from all participants.
One hundred and eighty-five eyes of 97 subjects were enrolled in the study. Ophthalmological examination included medical history, automated refraction, best-corrected visual acuity, corneal topography, slit-lamp biomicroscopy, fundoscopy, IOP measurement, and CCT calculation.
Corneal curvature was determined using the Orbscan IIZ Corneal Analysis System (Bausch and Lomb, Rochester, NY, USA). In particular, corneal parameters regarding the 3 mm, 5 mm zone, minimum, maximum, and simulated keratometry readings were obtained. IOP measurements were obtained by GAT and DCT in a randomized order with a 10-minute interval. All measurements were taken by one experienced examiner.
GAT measurements were performed on a slit lamp (Haag-Streit AG, Koeniz, Switzerland) with a tonometer calibrated according to the manufacturer’s instructions. Topical anesthesia and fluorescein were instilled on the eye, and measurements were taken under a cobalt blue–filtered light. Three GAT readings were obtained for each eye, with a 5-minute interval, and mean IOP was recorded.
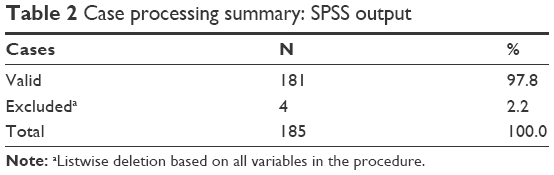
DCT measurements were taken using the Pascal digital tonometer (Ziemer Ophthalmic Systems Group Co., Port, Switzerland) mounted on a slit lamp. The device consists of a sensor tip with a 10.5 mm radius of curvature, a concave surface, and a miniaturized pressure sensor integrated into the center of the contact surface. Once the external pressure becomes equal with the IOP, the sensor begins to acquire readings. The IOP, ocular pulse amplitude, and a quality score (Q) indicating the reliability of the measurement are digitally displayed. According to the manufacturer’s guidelines, Q1 and Q2 measurements are considered “excellent”, Q3 are considered “acceptable”, and Q4 and Q5 readings are regarded as “not acceptable”. The average of two IOP measurements and only Q1 and Q2 quality scores were considered for further statistical analysis in this study. According to our criteria, only 181 of 185 had acceptable Pascal IOP measurements (these four patients had measurements with a quality score Q3 or worse).
Twenty minutes after IOP measurement, CCT was determined using a handheld ultrasound pachymeter (OcuScan RXP Ophthalmic Ultrasound System; Alcon Laboratories, Fort Worth, TX, USA). Two measurements were obtained. The average value of those measurements was evaluated in the statistical analysis of the study. Only measurements with standard deviation <2.0 were taken into consideration.
The statistical analysis focused on the two observed continuous variables representing the Pascal and Goldmann performance values as well as their differences (derived as deviations between Pascal and Goldmann measurements). For the purpose of the analysis, three levels of CCT (<500, 500–560, and 561+) and three levels of mean curvature (<42.00, 42.00–44.99, and 45.00+) were considered.
The association between the Pascal and Goldmann measurements was assessed on the basis of the Spearman linear correlation coefficients. Multiple scatter plots were also created to delineate graphically patterns and relationships. Additionally, an agreement analysis was performed, the Bland–Altman plot (Figure 1) was produced, and intraclass correlation coefficient (ICC) was estimated.
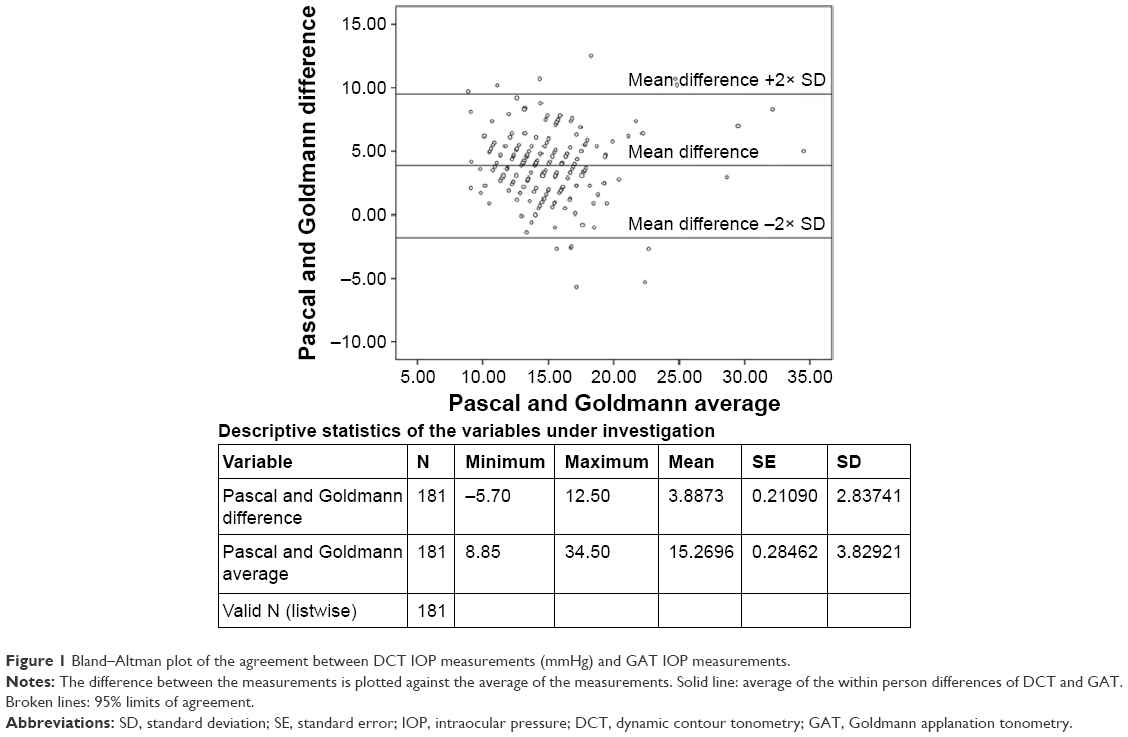 |
Figure 1 Bland–Altman plot of the agreement between DCT IOP measurements (mmHg) and GAT IOP measurements. |
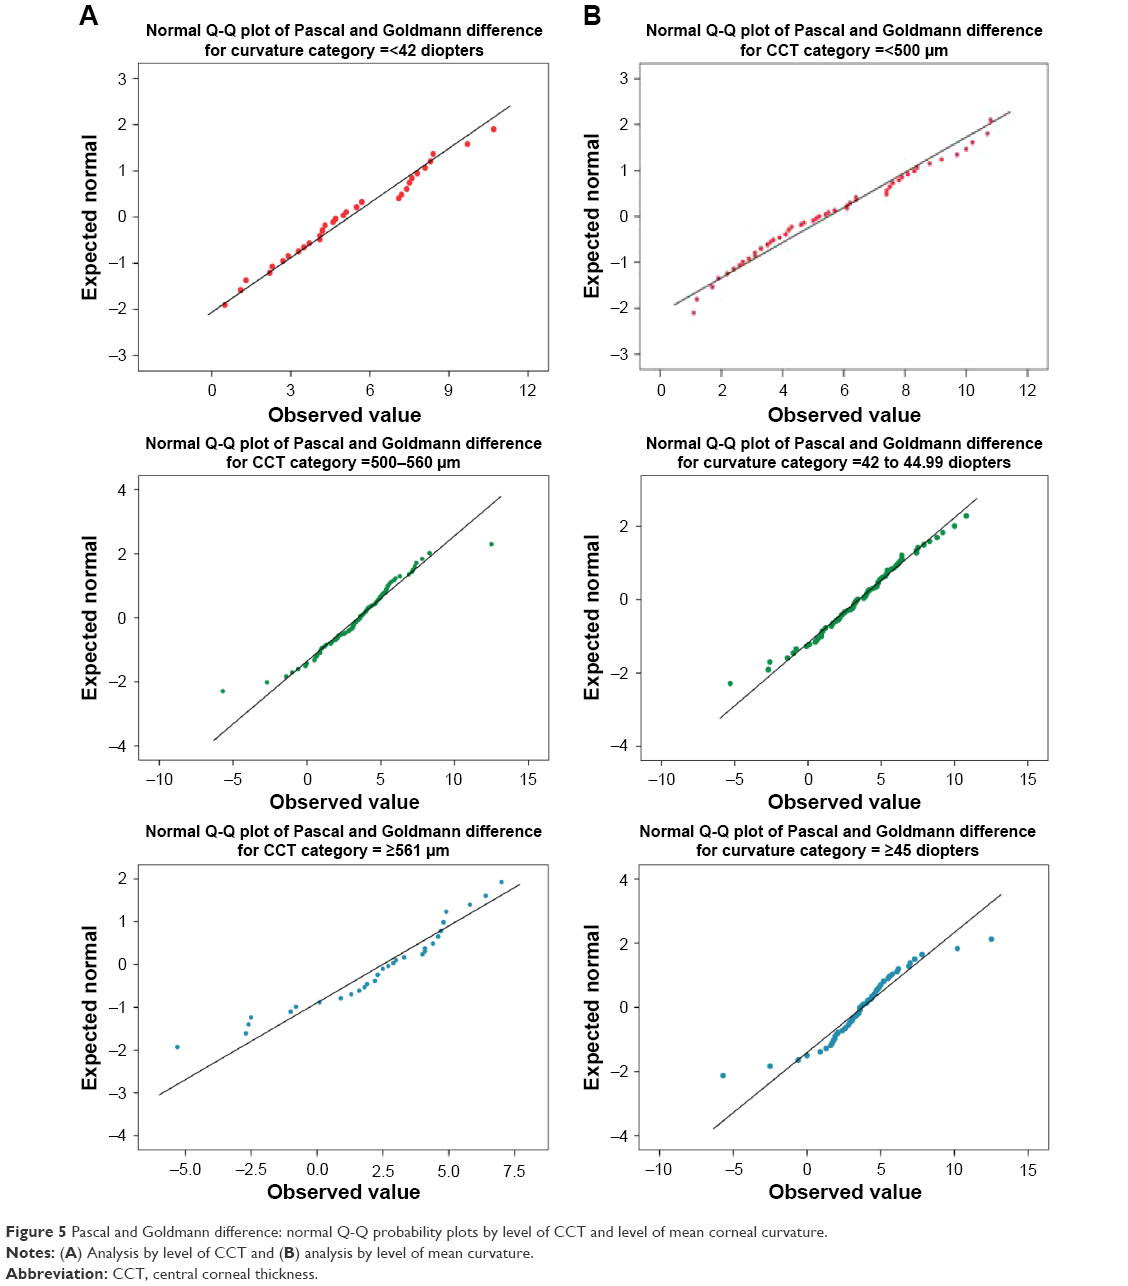
One-way analysis of variance (ANOVA, F-test) was performed to test whether the means between the Pascal and Goldmann differences differ or not across the CCT and mean curvature classes. For the factor levels considered (CCT: <500, 500–560, 561+; curvature: <42.00, 42.00–44.99, 45.00+), the fulfillment of the assumptions concerning normality of the observations was assessed using the normal probability plot and the Kolmogorov–Smirnov statistic, whereas the homoscedasticity assumption was appraised on the basis of the Levene’s test. Additionally, to make multiple comparisons between factor levels, the Tukey’s honest significant difference test was employed. For all tests and measurements, the statistical significance was set at the 0.05. The statistical analysis was carried out using SPSS version 21 (IBM Corporation, Armonk, NY, USA).
Results
Descriptive
The mean Pascal and Goldmann measurements were 17.2 and 13.2, respectively; their relative variance, measured by the coefficient of variation, differed considerably with the measurements derived using the GAT to exhibit higher relative variance (Table 1). Of the 185 eyes, almost 49% had CCT between 500 and 560 μm and mean curvature between 42 and 45 D. CCT <500 μm and mean curvature <42 D were seen in 29.7% and 19.5% of cases, respectively. Across all CCT and mean curvature levels, the mean and median values of the measurements obtained using the Pascal DCT were higher than those obtained using the GAT. Pascal measurements showed relatively lower skewness as well (Figures 2 and 3).
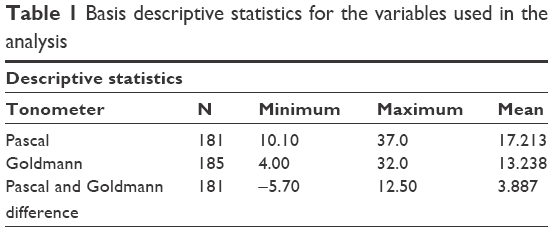 | Table 1 Basis descriptive statistics for the variables used in the analysis |
 | Figure 2 Box plots of Pascal and Goldmann measurements by CCT groups. Circles represent outlier values and asterisks represent extreme outlier values. |
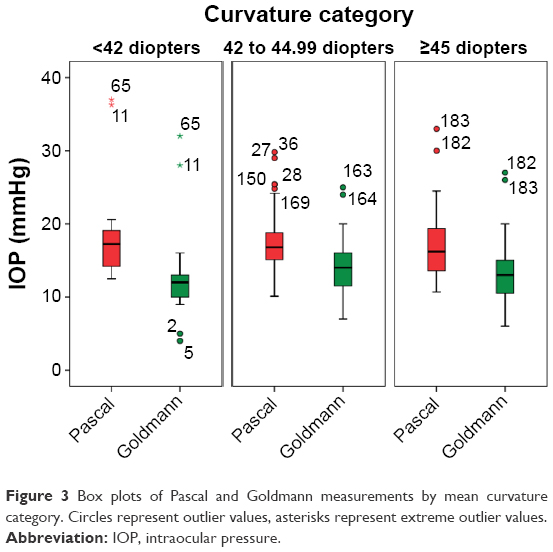 | Figure 3 Box plots of Pascal and Goldmann measurements by mean curvature category. Circles represent outlier values, asterisks represent extreme outlier values. |
Correlation
Taking into account all the observations, the correlation coefficient between the Pascal and Goldmann measurements was positive, high (=0.759), and statistically significant. However, more interesting results were obtained when the sample was cross-classified by level of CCT and level of mean curvature. Figure 4 shows the respective correlation coefficients for all combinations of the CCT and mean curvature levels. It is interesting to note that:
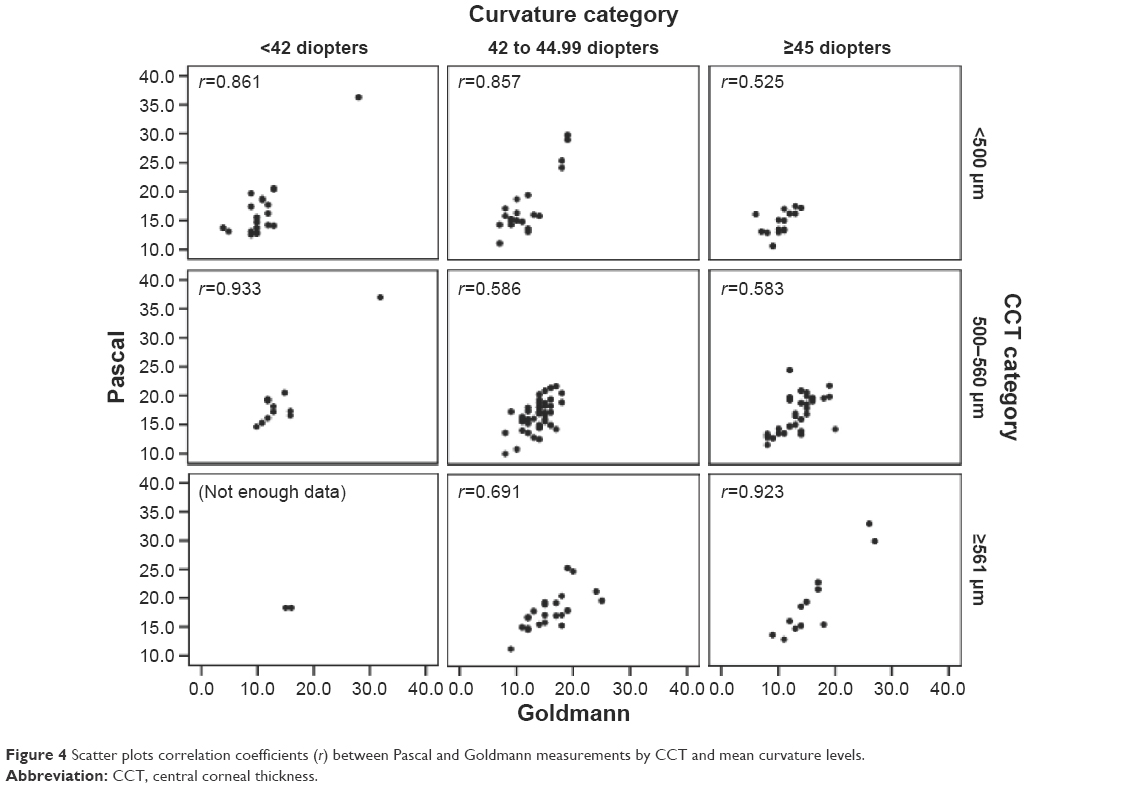 | Figure 4 Scatter plots correlation coefficients (r) between Pascal and Goldmann measurements by CCT and mean curvature levels. |
- There was a very high correlation coefficient (r=0.933) among eyes with mean curvature <42 D and CCT between 500 and 560 μm as well as among eyes with mean curvature >45 D and CCT >560 μm (r=0.923).
- There was a fairly high correlation but definitely of lower intensity in eyes of CCT <500 μm and mean curvature<42 D (r=0.861) as well as among eyes of CCT <500 μm and mean curvature between 42 and 45 D (r=0.857).
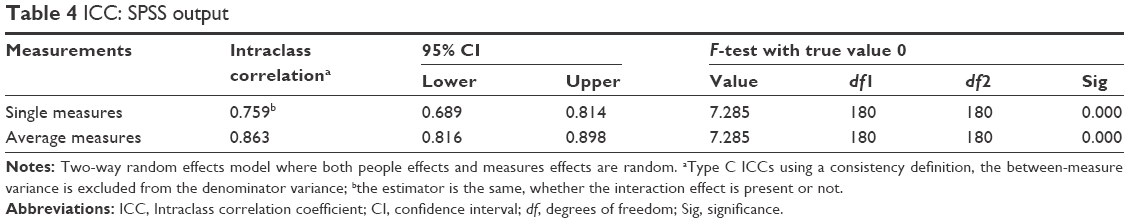
To complete our correlation analysis, we also estimated the ICC, is found that ICC was 0.863, which suggests agreement between average measurements (Tables 2–4).
 | Table 2 Case processing summary: SPSS output |
 | Table 3 Reliability statistics: SPSS output |
 | Table 4 ICC: SPSS output |
ANOVA
Differentiations by level of CCT
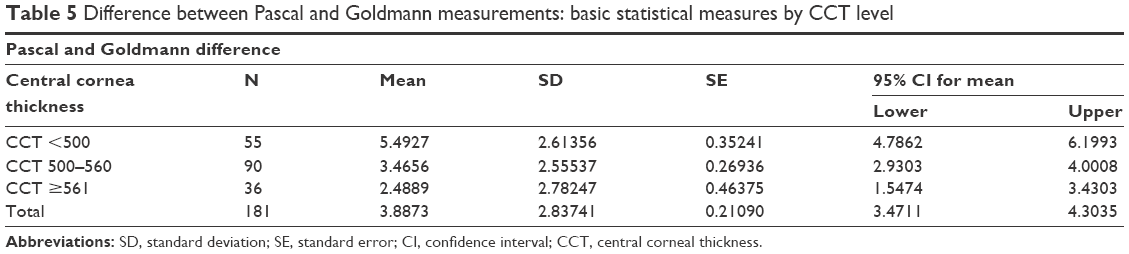
The average difference between Pascal and Goldmann measurements (Pascal_Goldmann_difference) was highest (5.4927) among eyes with CCT measurements <500 μm, which gradually reduced to 2.48247 for eyes with higher CCT (Table 5). The values of response variable were normally distributed and showed homogeneous variances (Figure 5). ANOVA revealed that the differences in the mean values by CCT levels were statistically significant. This result is mainly due to differences between low CCT and other level categories; in other words, measurements of tonometers Pascal and Goldman vary widely among eyes of CCT <500.
 | Table 5 Difference between Pascal and Goldmann measurements: basic statistical measures by CCT level |
 | Figure 5 Pascal and Goldmann difference: normal Q-Q probability plots by level of CCT and level of mean corneal curvature. |
Differentiations by level of mean curvature
The average deviation between Goldmann and Pascal measurements was higher (5.22) in eyes demonstrating mean corneal curvature <42 D and lower in eyes with mean curvature between 42 and 45 D (=3.45) and curvature >45 D (3.76) (Table 6). The deviations between Goldmann and Pascal measurements by mean curvature levels were normally distributed and had homogeneous variances (Figure 5). The differences in their mean values by curvature levels were statistically significant. The result is mainly due to differences between low levels of mean curvature and other categories, ie, for mean curvature values <42 D, the Pascal and Goldmann measurements vary widely.
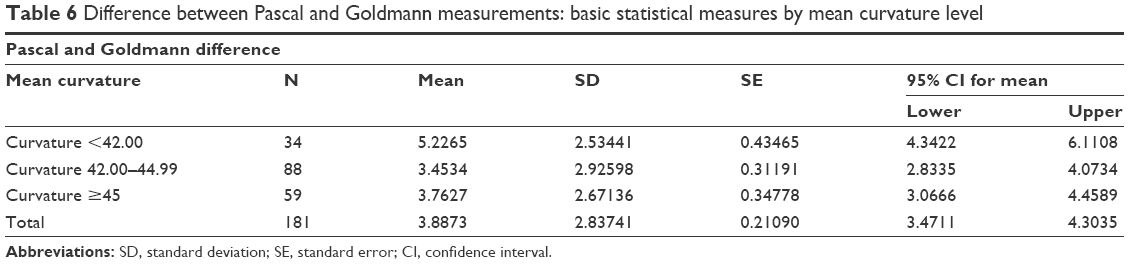 | Table 6 Difference between Pascal and Goldmann measurements: basic statistical measures by mean curvature level |
Discussion
Several studies have demonstrated the influence that corneal biomechanical properties have on GAT.1–7 It is well known that GAT underestimates IOP in thin corneas and overestimates IOP in thick corneas. Applanation tonometry measures IOP by subjecting the eye to a force that flattens the cornea. It assumes that the Imbert-Fick law is applicable to the eye. This law states that the pressure within a sphere is approximately equal to the external force needed to flatten a portion of the sphere divided by the area of the sphere that is flattened.8 It is applicable to surfaces that are perfectly spherical, elastic, and infinitely thin. However, the cornea has a finite thickness and the eye is not a perfectly elastic structure.
In our study, IOP as measured by GAT was lower than DCT by an average of 3.88±2.83. This is similar to several studies findings, in spite of different mean pressure differences.9–12 Kniestedt et al,9 performing manometry in cadaver eyes, showed that GAT IOP measurements were on average lower by almost 4 mmHg than DCT IOP measurements, the latter being closer to true IOP. Ozcura et al10 reported DCT measurements 4.06 mmHg higher than GAT measurements in normal eyes and 4.69 mmHg higher than GAT measurements in glaucomatous eyes. In their study, Francis et al11 observed that IOP as measured by GAT was lower than DCT by an average of 1.7±3.1 mmHg.
Several studies showed a significantly lower correlation of CCT with DCT than with GAT.13–19 This is especially true for studies comparing the two methods in eyes after refractive surgery.13,14 Siganos et al13 found that GAT tended to underestimate IOP in all patients after laser in situ keratomileusis, whereas DCT did not. In a sample of normal subjects, Jordao et al15 found a strong correlation between CCT and GAT, and a weak correlation between DCT and CCT. On the other hand, Halkiadakis et al20 did not find any correlation between CCT with GAT and DCT in a population of glaucomatous and ocular hypertensive patients.
In the current study, the average difference between Pascal and Goldmann measurements was highest (5.4927) among eyes with CCT measurements <500 μm and gradually reduced to 2.48247 for eyes with higher CCT.
The importance of CCT in glaucoma was further emphasized in the Ocular Hypertension Glaucoma Study, which demonstrated that CCT was a major predictive factor for the conversion of ocular hypertension into glaucoma.21,22 This fact, together with the CCT differences found between ocular hypertensive cornea and those of patients diagnosed with normotensive glaucoma as well as the inefficiency of nomograms developed for correcting the effect of pachymetry in GAT measurements have determined the need of seeking new tonometry methods independent of CCT and other corneal biomechanical parameters.
DCT employs a contoured tip, which conforms the cornea to its inner curvature, theoretically placing it into a neutral shape such that no bending or tangential forces are acting on the area of cornea–tip contact. In this state, the forces acting on both the inside (IOP, rigidity) and outside (capillary, appositional) of the cornea are equal, and this pressure is measured by a small sensor inside the contour of the tonometer tip.
Many published studies have suggested correction factors based on CCT and GAT, but the effects of corneal curvature on IOP measurements by GAT remain uncertain.23–27 Orssengo and Pye25 discussed the deformation of a central cornea flattened by pressure of the prism and bulging outward from the middle to the peripheries due to the inner pressure of the eye. However, other studies could not find any significant correlation between corneal curvature and IOP.26,27
In this study, we found that the average deviation between Goldmann and Pascal measurements was higher (5.22) in flat corneal curvature (<42 D) and lower in eyes with mean curvature between 42 and 45 D (3.45) and curvature >45 D (3.76). It seems that applanation of a flatter cornea can drastically change IOP readings compared to conforming the cornea, which does not influence IOP measurements. In contrast to other studies results, we conclude that flat corneal curvature (<42 D) influences the accuracy of GAT measurements.28–30
To recapitulate, our study, in line with several other studies, demonstrates the limits of GAT in IOP measurements. As expected, we found significantly positive correlation between CCT and IOP measurements using the GAT. Likewise, GAT measurements were influenced by flat corneas. On the other hand, Pascal DCT measurements seem unaffected by corneal biomechanical properties.
Conclusion
Considering the fact that post-refractive-surgery patients with glaucoma or ocular hypertension will become more frequent within the near future, the need for accurate IOP measurements will arise. Since DCT performs more independently of the corneal characteristics than GAT, it may be adequate as a new gold standard.
Disclosure
The authors alone are responsible for the content and preparation of this manuscript. The authors report no conflicts of interest in this work.
References
Whitacre MM, Stein RA, Hassanein K. The effect of corneal thickness on applanation tonometry. Am J Ophthalmol. 1993;115(5):592–596. | ||
Martinez-de-la-Casa JM, Garcia-Feijoo J, Vico E, et al. Effect of corneal thickness on dynamic contour, rebound, and Goldmann tonometry. Ophthalmology. 2006;113(12):2156–2162. | ||
Stodtmeister R. Applanation tonometry and correction according to corneal thickness. Acta Ophthalmol Scand. 1998;76(3):319–324. | ||
Wolfs RC, Klaver CC, Vingerling JR, Grobbee DE, Hofman A, De Jong PT. Distribution of central corneal thickness and its association with intraocular pressure: the Rotterdam Eye Study. Am J Ophthalmol. 1997;123:767–772. | ||
Ehlers N, Bramsen T, Sperling S. Applanation tonometry and central corneal thickness. Acta Ophthalmol. 1975;53(1):34–43. | ||
Copt RP, Thomas R, Mermoud A. Corneal thickness in ocular hypertension, primary open-angle glaucoma and normal tension glaucoma. Arch Ophthalmol. 1999;117(1):14–16. | ||
Shah S, Chatterjee A, Mathai M, et al. Relationship between corneal thickness and measured intraocular pressure in a general ophthalmology clinic. Ophthalmology. 1999;106(11):2154–2160. | ||
Goldmann H, Schmidt T. Applanation tonometry. Ophthalmologica. 1957;134:221–242. | ||
Kniestedt C, Michelle N, Stamper RL. Dynamic contour tonometry: a comparative study on human cadaver eyes. Arch Ophthalmol. 2004;122(9):1287–1293. | ||
Özcura F, Yildirim N, Şahin A, Çolak E. Comparison of Goldmann applanation tonometry, rebound tonometry and dynamic contour tonometry in normal and glaucomatous eyes. Int J Ophthalmol. 2015;8(2):299–304. | ||
Francis BA, Hsieh A, Lai MY, et al. Effects of corneal thickness, corneal curvature, and intraocular pressure level on goldmann applanation tonometry and dynamic contour tonometry. Ophthalmology. 2007;114(1):20–26. | ||
Ku JK, Danesh-Meyer HV, Craig JP, Gamble GD, McGhee CN. Comparison of intraocular pressure measured by Pascal dynamic contour tonometry and Goldmann applanation tonometry. Eye. 2006;20:191–198. | ||
Siganos DS, Papastergiou GI, Moedas C. Assessment of the Pascal dynamic contour tonometer in monitoring intraocular pressure in unoperated eyes and eyes after LASIK. J Cataract Refract Surg. 2004;30(4):746–751. | ||
Aristeidou AP, Labiris G, Katsanos A, Fanariotis M, Foudoulakis NC, Kozobolis VP. Comparison between Pascal dynamic contour tonometer and Goldmann applanation tonometer after different types of refractive surgery. Graefes Arch Clin Exp Ophthalmol. 2011;249(5):767–773. | ||
Jordão ML, Lupinacci AP, Ferreira EL, Enomoto IJ, Costa VP. Influence of age, central corneal thickness, and quality score on dynamic contour tonometry. Eye (Lond). 2009;23(6):1364–1369. | ||
Doyle A, Lachkar Y. Comparison of dynamic contour tonometry with Goldmann applanation tonometry over a wide range of central corneal thickness. J Glaucoma. 2005;14(4):288–292. | ||
Lee J, Lee CH, Choi J, et al. Comparison between dynamic contour tonometry and Goldmann applanation tonometry. Korean J Ophthalmol. 2009;23(1):27–31. | ||
Kotecha A, White ET, Shewry JM, Garway-Heath DF. The relative effects of corneal thickness and age on Goldmann applanation tonometry and dynamic contour tonometry. Br J Ophthalmol. 2005;89(12):1572–1575. | ||
Lanza M, Borrelli M, De Bernardo M, Filosa ML, Rosa N. Corneal parameters and difference between Goldmann applanation tonometry and dynamic contour tonometry in normal eyes. J Glaucoma. 2008;17(6):460–464. | ||
Halkiadakis I, Patsea E, Chatzimichali K, et al. Comparison of dynamic contour tonometry with Goldmann applanation tonometry in glaucoma practice. Acta Ophthalmol. 2009;87(3):323–328. | ||
Kass MA, Heuer DK, Higginbotham EJ, et al. The Ocular Hypertension Treatment Study: a randomized trial determines that topical ocular hypotensive medication delays or prevents the onset of primary open-angle glaucoma. Arch Ophthalmol. 2002;120(6):701–713. | ||
Gordon MO, Beiser JA, Brandt JD, et al. The Ocular Hypertension Treatment Study: baseline factors that predict the onset of primary open-angle glaucoma. Arch Ophthalmol. 2002;120(6):714–720. | ||
Pache M, Wilmsmeyer S, Lautebach S, Funk J. Dynamic contour tonometry versus Goldmann applanation tonometry: a comparative study. Graefes Arch Clin Exp Ophthalmol. 2005;243(8):763–767. | ||
Schneider E, Grehn F. Intraocular pressure measurement comparison of dynamic contour tonometry and goldmann applanation tonometry. J Glaucoma. 2006;15(1):2–6. | ||
Orssengo GJ, Pye DC. Determination of the true intraocular pressure and modulus of elasticity of the human cornea in vivo. Bull Math Biol. 1999;61(3):551–572. | ||
Paranhos A Jr, Paranhos FR, Prata JA Jr, Omi CA, Mello PA, Shields MB. Influence of keratometric readings on comparative intraocular pressure measurements with Goldmann, Tono-Pen, and noncontact tonometers. J Glaucoma. 2000;9(3):219–223. | ||
Eysteinsson T, Jonasson F, Sasaki H, et al. Central corneal thickness, radius of the corneal curvature and intraocular pressure in normal subjects using non-contact techniques: Reykjavik Eye Study. ActaOphthalmolScand. 2002;80(1):11–15. | ||
Erickson DH, Goodwin D, Rollins M, Belaustegui A, Anderson C. Comparison of dynamic contour tonometry and Goldmann applanation tonometry and their relationship to corneal properties, refractive error, and ocular pulse amplitude. Optometry. 2009;80(4):169–174. | ||
Mangouritsas G, Mpourtzoukos S, Mantzounis A, Alexopoulos L. Comparison of Goldmann and Pascal tonometryin relation to corneal hysteresis and central corneal thickness in non-glaucomatous eyes. Clin Ophthalmol. 2011;5:1071–1077. | ||
Ceruti P, Morbio R, Marraffa M, Marchini G. Goldmann applanation tonometry and dynamic contour tonometry in healthy and glaucomatous eyes. Eye (Lond). 2009;23(2):262–269. |
 © 2016 The Author(s). This work is published and licensed by Dove Medical Press Limited. The full terms of this license are available at https://www.dovepress.com/terms.php and incorporate the Creative Commons Attribution - Non Commercial (unported, v3.0) License.
By accessing the work you hereby accept the Terms. Non-commercial uses of the work are permitted without any further permission from Dove Medical Press Limited, provided the work is properly attributed. For permission for commercial use of this work, please see paragraphs 4.2 and 5 of our Terms.
© 2016 The Author(s). This work is published and licensed by Dove Medical Press Limited. The full terms of this license are available at https://www.dovepress.com/terms.php and incorporate the Creative Commons Attribution - Non Commercial (unported, v3.0) License.
By accessing the work you hereby accept the Terms. Non-commercial uses of the work are permitted without any further permission from Dove Medical Press Limited, provided the work is properly attributed. For permission for commercial use of this work, please see paragraphs 4.2 and 5 of our Terms.