Back to Journals » Diabetes, Metabolic Syndrome and Obesity » Volume 14
Comparison of Clinical Characteristics Between Obese and Non-Obese Patients with Nonalcoholic Fatty Liver Disease (NAFLD)
Authors Li Y, Chen Y, Tian X, Zhang S , Jiao J
Received 30 January 2021
Accepted for publication 8 April 2021
Published 6 May 2021 Volume 2021:14 Pages 2029—2039
DOI https://doi.org/10.2147/DMSO.S304634
Checked for plagiarism Yes
Review by Single anonymous peer review
Peer reviewer comments 2
Editor who approved publication: Dr Konstantinos Tziomalos
Yifang Li, Yanzhen Chen, Xing Tian, Shanshan Zhang, Jian Jiao
Department of Gastroenterolgy & Hepatology, China-Japan Union Hospital, Jilin University, Changchun, 130033, People’s Republic of China
Correspondence: Jian Jiao
Department of Gastroenterology & Hepatology, China-Japan Union Hospital, Jilin University, Changchun, People’s Republic of China
Tel +86 13756009567
Fax +86 0431-84995850
Email [email protected]
Objective: Non-alcoholic fatty liver disease (NAFLD), previously thought to predominantly affect obese individuals, has also been shown to occur in subjects who have a relatively normal body mass index (BMI). Due to the normal BMI, non-obese NAFLD are easily to be ignored and eventually lead to potential liver injuries.
Methods: A population-based cross-sectional study was conducted on 1608 cases with normal serum alanine aminotransferase (ALT) levels who were divided into an obese group (BMI ≥ 25 kg/m2) and a non-obese group (BMI < 25 kg/m2). NAFLD was diagnosed by ultrasound and Fibro Scan examination. Non-obese populations were divided into NAFLD group (CAP ≥ 240 db/m) and non-NAFLD group (CAP < 240 db/m). The incidence of NAFLD in the obese and non-obese populations and constituent ratios of genders, age, and serum levels of triglycerides (TG), cholesterol (CHOL), and blood glucose were compared. Risk factors of NAFLD in non-obese people were analyzed by multivariate logistics regression.
Results: The occurrence of NAFLD was higher in the obese group than in the non-obese group, regardless of gender (P < 0.001). In the non-obese group, the occurrence of NAFLD in female patients was lower than that in male (P=0.001). The occurrence of NAFLD increased with age, with 50– 59 years being the peak age of incidence in both male and female. The peak age of NAFLD occurrence in non-obese male patients was more delayed than that in obese male patients. BMI (OR=1.311, P=0.000) and TG (OR=2.545, P=0.000) were risk factors for NAFLD in the non-obese population.
Conclusion: Compared with obese population, the incidence of NAFLD in non-obese population was relatively low and more frequently in male than in female, the peak age of NAFLD occurrence in non-obese male patients was also delayed. BMI and TG should still be controlled to avoid the occurrence of NAFLD although the BMI of such patients is normal.
Keywords: obese, non-obese, non-alcoholic liver disease, gender, characteristic
Introduction
Non-alcoholic fatty liver disease (NAFLD), previously thought to predominantly affect obese individuals,1 has also been shown to occur in subjects who have a relatively normal body mass index (BMI), a condition referred to as non-obese or lean NAFLD,2 and is occult and therefore easily ignored in clinical examinations.3 Studies have reported that the incidence rate of NAFLD in non-obese population is 7–20% in the West and 5–26% in the East,4 however, current studies on NAFLD are mainly focused on obese patients, and there is a lack of research on non-obese patients, the clinical characters and the risk factors of non-obese NAFLD remain poorly defined, sexual dimorphism, advanced age or postmenopausal status, and serum levels of lipid profile and blood glucose levels may be involved.5 Considering the body figures are different between the Eastern and the western, this paper takes BMI ≥25 kg/m2 as the definition of obesity according to the recommendation of World Health Organization for the Eastern,6 the clinical characteristics between obese and non-obese patients with NAFLD were compared and the difference in the risk factors for NAFLD between non-obese male and female patients were also analyzed, the aim is to provide better understandings for non-obese NAFLD.
Materials and Methods
Patients and Laboratory Assessment
Overall, 1608 cases with normal serum alanine aminotransferase (ALT) levels undergoing routine physical examination in the Physical Examination Center of the China-Japan Union Hospital (Jilin University, China) were screened for NAFLD by abdominal ultrasound and Fibro Scan examination. The main characteristics of 1608 cases undergoing routine physical examination are shown in Table 1.
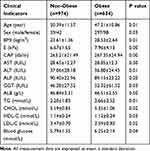 |
Table 1 Main Characteristics of 1608 Cases Undergoing Routine Physical Examination |
Histories of alcohol consumption and medications used within the last three months were investigated. Serum antibody levels of hepatitis virus A, B, C, and E were assessed. Alcohol consumption, virus infection, autoimmune liver disease, coronary artery disease (CAD), acute inflammatory conditions, acute and chronic liver diseases, pregnancy, organ failure, rheumatological disorders, hypothyroidism, malignancy and currently undergoing therapy were the exclusion criteria. Fatty liver was diagnosed by ultrasonographic examination indicating fatty infiltration in the liver and controlled attenuation parameter≥240 db/m. They were evaluated and reported by the same physician to avoid bias. The detailed diagnostic criteria were in accordance with the guidelines for NAFLD management formulated by the Chinese National Workshop on Fatty Liver Disease in 2010.7 The research was conducted ethically in accordance with the World Medical Association Declaration of Helsinki and was approved by the Ethics Committee of China-Japan Union Hospital, Jilin University (2016ks009). Participation was voluntary and all respondents completed informed consent.
Fasting venous blood was taken in the morning (fasting for more than 8 hours and no high-fat diet one day before blood collection) for testing. Triglyceride (TG), total cholesterol (CHOL), low-density lipoprotein cholesterol (LDL-C), high-density lipoprotein cholesterol (HDL-C), alanine transaminase (ALT), aspartate aminotransferase (AST), Alkaline phosphatase (ALP), Gamma-glutamyl transferase (GGT), Albumin (ALB) and fasting blood glucose levels were detected by HITACHI-7180 automatic biochemical analyzer.
Study Design
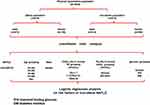
This is a population-based cross-sectional study. According to the World Health Organization standard for Asian populations6 based on the risk of developing type 2 diabetes and cardiovascular disease, we divided the 1608 cases into an obese group (BMI≥25 kg/m2) and a non-obese group (BMI<25 kg/m2). The incidence of NAFLD in the obese and non-obese populations and its relationship with clinical indicators, including gender, age, and serum levels of triglycerides (TG), cholesterol (CHOL), and blood glucose, were compared. The schematic design is presented in Figure 1.
Non-obese populations were divided into NAFLD group (CAP≥240 db/m) and non-NAFLD group (CAP<240 db/m) according to the results of abdominal ultrasound and Fibro Scan examination, the main characteristics of the NAFLD group and the non-NAFLD group in non-obese people are shown in Table 2.
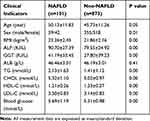 |
Table 2 Main Characteristics of NAFLD Group and Non-NAFLD Group in Non-Obese Population |
Statistical Analysis
All data were expressed as mean ± standard deviation (SD). t-tests were used for numerical variables, and χ2 tests were used for categorical variables. Variables with P<0.05 on univariate analysis entered a multiple logistic regression model. P values <0.05 were considered statistically significant, and the statistical software used was SPSS.22. Logistic expression analysis was used to select the risk factors of NAFLD in the non-obese population.
Results
Gender Distribution of NAFLD in Non-Obese and Obese Populations
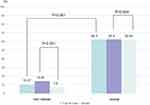
The occurrence of NAFLD was higher in the obese group than in the non-obese group (P<0.001), regardless of gender. The occurrence of NAFLD in female patients in the non-obese group was lower than that in male patients (male 14.25%, female 7.5%, P=0.001), while in the obese group, no difference could be found between the genders (male 62.4%, female 62.03%, P=0.934) (Figure 2).
Age Distribution of NAFLD in Non-Obese and Obese Populations
The occurrence of NAFLD increased with age, with 50–59 years being the peak age of incidence in all groups. In patients aged 30–39 years, the proportion of NAFLD in the obese group was higher than that in the non-obese group (P = 0.005), while there was no difference in the incidence of NAFLD between the obese and non-obese groups with increasing age, and no difference in gender could be found (Figure 3).
In the non-obese population, the NAFLD incidence in male patients increased significantly in the age range of 40–49 years and 50–59 years, while in female patients, the incidence peaked in the age range of 50–59 years (Figure 3A).
In the obese population, the incidence of NAFLD in male patients remained basically the same across the three age groups: 30–39 years, 40–49 years, and 50–59 years; the incidence peaked in female patients in the age range of 50–59 years (Figure 3B).
Distribution of TG Levels in Non-Obese and Obese Populations
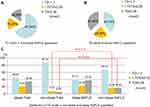
In order to control CHOL, LDL-C and other factors, the effect of TG on NAFLD was studied more accurately. CHOL and LDL-C of patients in each TG group were controlled within the normal range. The proportion of TG level distribution in obese and non-obese patients with NAFLD was slightly different. The proportion of elevated TG (TG≥2.26 mmol/L), marginal elevated TG (1.7mmol/L≤ TG ≤ 2.25 mmol/L), and normal TG (TG<1.7 mmol/L) in obese patients with NAFLD was roughly average, 40.15%,22.39%,37.45% respectively, while the majority of the non-obese patients with NAFLD showed normal TG levels,67.44%,16.28%,16.28%, respectively (Figure 4A and B).
In a separate comparison between the obese and non-obese populations, there was no statistical difference in the distribution of TG levels between obese patients with NAFLD and the total obese population, while the proportions of elevated TG (16.28%) and edge elevated TG (16.28%) in non-obese patients with NAFLD were statistically higher than those in the total non-obese population (5.29%,7.37%)(P=0.005, P=0.019). This indicates that elevated TG and edge elevated TG may be closely related to the occurrence of NAFLD in the non-obese population (Figure 4C).
CHOL Levels and Occurrence of NAFLD in Non-Obese and Obese Populations
In order to better study the effect of CHOL on NAFLD, the TG of patients in each CHOL group was controlled within the normal range. There was no statistical difference found in the distribution of CHOL levels between the obese and non-obese populations or between those with and without NAFLD (Figure 5).
 |
Figure 5 CHOL levels and occurrence of NAFLD in non-obese and obese population. No statistical difference found in the distribution of CHOL levels between obese and non-obese population (p>0.05). |
Constituent Ratio of Different Blood Glucose Levels in Non-Obese and Obese Populations
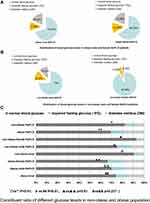
In this study, blood glucose levels were stratified into 3 groups: normal blood glucose, impaired fasting glucose, and diabetes mellitus.
Among obese patients with NAFLD, no difference was found in the distribution of blood glucose levels between male and female patients, the prevalence rates of male in the normal blood glucose group, the impaired fasting glucose group and the diabetes group were 70.03%,11.78%,18.18%, respectively, and the prevalence rates of female were 66.33%,14.29%,19.39%, respectively (Figure 6A).
Among non-obese patients with NAFLD, the majority of female patients had normal blood glucose (92.68%), and the constituent ratio of blood glucose levels in male patients was similar to that in obese patients with NAFLD,75%,13.3%,11.67%, respectively (Figure 6B).
When all cases were grouped according to male/female, obese/non-obese, and NAFLD/non-NAFLD, the proportions of normal blood glucose were higher in the non-obese population, the non-obese NAFLD group, and non-obese female patients with NAFLD than those in the obese population, the obese NAFLD group, and obese female patients with NAFLD (P<0.01); however, this pattern were not found among male patients with NAFLD (p=0.237). The constituent ratio of blood glucose levels in patients with NAFLD was similar to that in the total population (Figure 6C).
Risk Factors for NAFLD in Non-Obese Populations
In non-obese population, the differences of baseline characteristics between the NAFLD group (CAP≥240 db/m) and non-NAFLD group (CAP<240 db/m) were analyzed by multivariate logistics regression analysis, the results of parameters, including age, gender, BMI, TG, CHOL and blood glucose levels, showed that BMI (OR=1.311, P=0.000) and TG (OR=2.545, P=0.000) were risk factors for NAFLD in the non-obese population (Table 3).
 |
Table 3 Results of Regression Analysis of NAFLD in Non-Obese NAFLD Patients |
Discussion
NAFLD has become the most critical chronic liver disease in the world currently. The increase in NAFLD has become a significant public health concern because NAFLD is associated with increased mortality from liver-related and liver-unrelated causes.10–12 The pathogenesis of NAFLD is not clear, and there is no effective drug for preventing the development of NAFLD to date.8 As a manifestation of the systemic metabolic syndrome, NAFLD is closely related to the metabolism of glucose and lipids and is often seen in obese populations. However, there are many non-obese populations who are diagnosed with NAFLD during clinic examinations, and the mechanism behind the occurrence of non-obese NAFLD is even less understood.9 The largest community-based study from the East was conducted in Korea. Kwon et al13 reported the prevalence of non-obese NAFLD (BMI<25 kg/m2) to be 12.6% in 29,994 subjects presenting for a general medical examination. Patients with lean NAFLD are generally asymptomatic and their liver disease remains undiagnosed or incidentally detected by imaging. Compared to obese patients with NAFLD, patients with lean NAFLD have a lower body weight and waist circumference. Studies have reported that patients with lean NAFLD tend to be younger, male, have higher hemoglobin levels, lower blood pressure, fasting glucose and glycated hemoglobin (HbA1c) levels.14–16 Exploring the clinical characteristics of non-obese NAFLD may reflect how its pathogenesis is different from that of obese NAFLD.
NAFLD is defined as a sexually dimorphic disease, a characteristic that has attracted much attention in recent years. Increasing evidence shows that gender and age are related to the pathogenesis and progression of NAFLD.17 The incidence of NAFLD in postmenopausal women seems to be higher than that in premenopausal women, which shows a similar age relationship to that in male patients with NAFLD. A decrease in estrogen levels and a decline in ovarian function may be related to this phenomenon.18 Gutierrez-Grobe et al reported that the prevalence of NAFLD in premenopausal, postmenopausal, and polycystic ovarian syndrome women suggests that NAFLD is more prevalent in postmenopausal women and women with polycystic ovarian syndrome than in premenopausal women.19 Estrogen levels may have a protective effect against NAFLD in women. Studies on animal models also showed that estrogen deficiency aggravated the deterioration of non-alcoholic steatohepatitis in mice with NAFLD.20 Limited studies have also shown that hormone replacement therapy may have a beneficial effect on NAFLD.21 However, it is not clear whether these characteristics exist in non-obese patients with NAFLD. Our results showed that the occurrence of NAFLD was higher in the obese group than in the non-obese group, regardless of gender. However, in non-obese individuals, the incidence of NAFLD in female patients was significantly lower than that in male patients, suggesting that the protective effect of estrogen against NAFLD is more obvious in non-obese populations.
NAFLD incidence in different age groups also showed the possible role of estrogen. In the study of Japanese population,22 Kenichi Nishioji found that the prevalence of NAFLD peaked earlier in non-obese males than in females, and this difference may be related to the effect of hormones on body metabolism. The occurrence of NAFLD increased with age, with 50–59 years of age being the peak age of incidence in all groups. In the obese population, the incidence of NAFLD in male patients remained basically the same across the three age groups of 30–39 years, 40–49 years, and 50–59 years, while in the non-obese population, the NAFLD incidence in male patients was higher in the age groups of 40–49 years and 50–59 years. The incidence of NAFLD in female patients peaked in the age range of 50–59 years in both the obese and non-obese populations. These results show that the onset age of NAFLD is less in obese male populations. The incidence of NAFLD increasing in female patients around the age of 50–59 years may be due to the onset of menopause.
Elevated lipid and blood glucose are believed to be closely related to obesity and NAFLD, and some non-obese populations have elevated blood glucose and lipid levels that may lead to NAFLD. To prevent the interaction between different lipid components, we chose cases with normal CHOL and LDL-C levels for TG analysis. Similarly, we chose cases with normal TG and LDL-C levels for CHOL analysis. In accordance with the stratification standard of dyslipidemia,23 we divided the TG levels into three groups: normal TG (TG<1.7 mmol/L), marginal elevated TG (1.7≤TG≤2.25 mmol/L), and elevated TG (TG≥2.26 mmol/L). The results showed that the proportion of TG level distribution in the obese and non-obese populations was different. The proportion of normal TG levels in the obese population was significantly lower than that in the non-obese population, and a similar pattern was also found in patients with NAFLD. As expected, there is a significant proportion of people with normal TG levels in non-obese patients with NAFLD. This suggests that the “elevated” and “marginal elevated” TG levels may be closely related to the occurrence of NAFLD in non-obese populations, while NAFLD can also occur in non-obese patients with normal TG levels. Therefore, non-obese populations with normal TG levels should also be monitored for NAFLD, especially those with “elevated” and “marginal elevated” TG levels. It is worth noting that no statistical difference was found either in the distribution of CHOL levels between the obese and non-obese participants or between the patients with and without NAFLD.
Elevated blood glucose level is also one of the manifestations of metabolic abnormality. Constituent ratios of different glucose levels between obese and non-obese, NAFLD and non-NAFLD, and male and female participants were analyzed. We found that, in general, the proportion of people with abnormal blood glucose in the obese population was higher than that in the non-obese population. The constituent ratio of different glucose levels in patients with NAFLD was similar to that in the total population. There was no sex-related difference in the constituent ratio of different blood glucose levels in obese patients with NAFLD. Normal blood glucose levels were found in 65%-70% of patients with NAFLD. In non-obese patients with NAFLD, the composition ratios of blood glucose levels in male patients were similar to those in obese patients with NAFLD, while they were significantly different in female patients, with less than 10% of non-obese females showing abnormal blood glucose levels. This suggests that female patients with normal blood glucose should be monitored for NAFLD more closely than male patients.
Finally, we analyzed the risk factors for NAFLD in the non-obese population. The results showed that BMI and TG were still risk factors for NAFLD in the non-obese population. Most studies believe that there is a close correlation between NAFLD and BMI.30 The higher the BMI, the higher the incidence of metabolic syndrome and the greater the probability of NAFLD, high BMI is an independent risk factor for NAFLD. Our results showed that BMI was still a risk factor for NAFLD in non-obese patients even though their BMI <25 kg/m2. These findings remind us that reasonable dietary and physical activity status should also be advocated in people with normal BMI, which is helpful to prevent the development of NAFLD. In addition, high-fat diet is closely related to fatty liver, normal hepatocytes contain about 4%-7% of lipids, of which TG accounts for about 1/2. Fatty liver can be caused when the content of TG in the liver increases. Our data showed that the average level of TG in NAFLD group was higher than that of non-NAFLD in non-obese population. It’s very interesting that we found the “edge elevated“ TG level (1.7 mmol/L≤TG≤2.25 mmol/L) may be closely related to the occurrence of NAFLD in non-obese population. Results above remind us that attention should also be paid to monitor NAFLD in those people with normal TG and BMI in favor of early intervention. Certainly, genetic and other factors may also be related to the occurrence of NAFLD in non-obese people.
In summary, compared with obese population, the incidence of NAFLD in non-obese population was relatively low and more frequently in male than in female, the peak age of NAFLD occurrence in non-obese male patients was also delayed. BMI and TG should still be controlled to avoid the occurrence of NAFLD although the BMI of such patients is normal. Due to the normal BMI, non-obese NAFLD may be ignored by patients and can result in potential liver lesions and disease progression; therefore, more attention should be paid. However, BMI fails to address body fat distribution.24 Visceral abdominal adiposity, which is associated with the metabolic syndrome, is thought to be a key link to NAFLD, it plays a far more important role than subcutaneous fat in the pathogenesis of insulin resistance.25–27 We expected the study of the relationship between visceral obesity and non-obese NAFLD patients. More importantly, there is no dispute that NAFLD is closely related to several endocrine factors (hormone, glycolipid metabolism), and the concept of “endocrine NAFLD” has been once proposed,28,29 which may be a new direction for future research on the mechanism and treatment of NAFLD.
Statement of Ethics
The research was conducted ethically in accordance with the World Medical Association Declaration of Helsinki and was approved by the Ethics Committee of China-Japan Union Hospital, Jilin University (2016ks009). Participation was voluntary and all respondents completed informed consent.
Disclosure
The authors declare that they have no competing interests.
References
1. Wattacheril J. Extrahepatic Manifestations of Nonalcoholic Fatty Liver Disease. Gastroenterol Clin North Am. 2020;49(1):141–149. doi:10.1016/j.gtc.2019.10.002
2. Wang AY, Dhaliwal J, Mouzaki M. Lean non-alcoholic fatty liver disease. Clin Nutr. 2019;38(3):975–981. doi:10.1016/j.clnu.2018.08.008
3. Tu LN, Showalter MR, Cajka T, et al. Metabolomic characteristics of cholesterol-induced non-obese nonalcoholic fatty liver disease in mice. Sci Rep. 2017;7(1):6120. doi:10.1038/s41598-017-05040-6
4. Ahadi M, Molooghi K, Masoudifar N, Namdar AB, Vossoughinia H, Farzanehfar M. A review of non-alcoholic fatty liver disease in non-obese and lean individuals [published online ahead of print, 2020 Nov 20]. J Gastroenterol Hepatol. 2020. doi:10.1111/jgh.15353
5. Schiffer L, Kempegowda P, Arlt W, O’Reilly MW. MECHANISMS IN ENDOCRINOLOGY: the sexually dimorphic role of androgens in human metabolic disease. Eur J Endocrinol. 2017;177(3):R125–R143. doi:10.1530/EJE-17-0124
6. WHO Expert Consultation. Appropriate body-mass index for Asian populations and its implications for policy and intervention strategies [published correction appears in Lancet]. Lancet. 2004;363(9403):157–163. doi:10.1016/S0140-6736(03)15268-3
7. Jian-gao F; Chinese Liver Disease Association. Guidelines for management of nonalcoholic fatty liver disease: an updated and revised edition. Zhonghua Gan Zang Bing Za Zhi. 2010;18(3):163–166.
8. Friedman SL, Neuschwander-Tetri BA, Rinella M, Sanyal AJ. Mechanisms of NAFLD development and therapeutic strategies. Nat Med. 2018;24(7):908–922. doi:10.1038/s41591-018-0104-9
9. Liu CJ. Prevalence and risk factors for non-alcoholic fatty liver disease in Asian people who are not obese. J Gastroenterol Hepatol. 2012;27(10):1555–1560. doi:10.1111/j.1440-1746.2012.07222.x
10. Adams LA, Lymp JF, St Sauver J, et al. The natural history of nonalcoholic fatty liver disease: a population-based cohort study. Gastroenterology. 2005;129(1):113–121. doi:10.1053/j.gastro.2005.04.014
11. Ekstedt M, Franzén LE, Mathiesen UL, et al. Long-term follow-up of patients with NAFLD and elevated liver enzymes. Hepatology. 2006;44(4):865–873. doi:10.1002/hep.21327
12. Targher G, Byrne CD, Tilg H. NAFLD and increased risk of cardiovascular disease: clinical associations, pathophysiological mechanisms and pharmacological implications. Gut. 2020;69(9):1691–1705. doi:10.1136/gutjnl-2020-320622
13. Kwon YM, Oh SW, Hwang SS, Lee C, Kwon H, Chung GE. Association of nonalcoholic fatty liver disease with components of metabolic syndrome according to body mass index in Korean adults. Am J Gastroenterol. 2012;107(12):1852–1858. doi:10.1038/ajg.2012.314
14. Younossi ZM, Stepanova M, Negro F, et al. Nonalcoholic fatty liver disease in lean individuals in the United States. Medicine. 2012;91(6):319–327. doi:10.1097/MD.0b013e3182779d49
15. Akyuz U, Yesil A, Yilmaz Y. Characterization of lean patients with nonalcoholic fatty liver disease: potential role of high hemoglobin levels. Scand J Gastroenterol. 2015;50(3):341–346. doi:10.3109/00365521.2014.983160
16. Vos B, Moreno C, Nagy N, et al. Lean non-alcoholic fatty liver disease (Lean-NAFLD): a major cause of cryptogenic liver disease. Acta Gastroenterol Belg. 2011;74(3):389–394.
17. Lee JY, Shin DW, Oh JW, et al. Non-alcoholic fatty liver disease as a risk factor for female sexual dysfunction in premenopausal women. PLoS One. 2017;12(8):e0182708. doi:10.1371/journal.pone.0182708
18. Ballestri S, Nascimbeni F, Baldelli E, Marrazzo A, Romagnoli D, Lonardo A. NAFLD as a sexual dimorphic disease: role of gender and reproductive status in the development and progression of nonalcoholic fatty liver disease and inherent cardiovascular risk. Adv Ther. 2017;34(6):1291–1326. doi:10.1007/s12325-017-0556-1
19. Gutierrez-Grobe Y, Ponciano-Rodríguez G, Ramos MH, Uribe M, Méndez-Sánchez N. Prevalence of non alcoholic fatty liver disease in premenopausal, postmenopausal and polycystic ovary syndrome women. The role of estrogens. Ann Hepatol. 2010;9(4):402–409. doi:10.1016/S1665-2681(19)31616-3
20. Matsushita N, Hassanein MT, Martinez-Clemente M, et al. Gender difference in NASH susceptibility: roles of hepatocyte Ikkβ and Sult1e1. PLoS One. 2017;12(8):e0181052. doi:10.1371/journal.pone.0181052
21. Venetsanaki V, Polyzos SA. Menopause and non-alcoholic fatty liver disease: a review focusing on therapeutic perspectives. Curr Vasc Pharmacol. 2019;17(6):546–555. doi:10.2174/1570161116666180711121949
22. Nishioji K, Sumida Y, Kamaguchi M, et al. Prevalence of and risk factors for non-alcoholic fatty liver disease in a non-obese Japanese population, 2011–2012. J Gastroenterol. 2015;50(1):95–108. doi:10.1007/s00535-014-0948-9
23. Joint committee for guideline revision. 2016 Chinese guidelines for the management of dyslipidemia in adults. J Geriatr Cardiol. 2018;15(1):1–29. doi:10.11909/j.issn.1671-5411.2018.01.011
24. Cusi K. Role of obesity and lipotoxicity in the development of nonalcoholic steatohepatitis: pathophysiology and clinical implications. Gastroenterology. 2012;142(4):711–725.e6. doi:10.1053/j.gastro.2012.02.003
25. Yim JY, Kim D, Lim SH, et al. Sagittal abdominal diameter is a strong anthropometric measure of visceral adipose tissue in the Asian general population. Diabetes Care. 2010;33(12):2665–2670. doi:10.2337/dc10-0606
26. Kuk JL, Lee S, Heymsfield SB, Ross R. Waist circumference and abdominal adipose tissue distribution: influence of age and sex. Am J Clin Nutr. 2005;81(6):1330–1334. doi:10.1093/ajcn/81.6.1330
27. McLaughlin T, Lamendola C, Liu A, Abbasi F. Preferential fat deposition in subcutaneous versus visceral depots is associated with insulin sensitivity. J Clin Endocrinol Metab. 2011;96(11):E1756–E1760. doi:10.1210/jc.2011-0615
28. Lonardo A, Mantovani A, Lugari S, Targher G. NAFLD in some common endocrine diseases: prevalence, pathophysiology, and principles of diagnosis and management. Int J Mol Sci. 2019;20(11):2841. doi:10.3390/ijms20112841
29. Lonardo A, Carani C, Carulli N, Loria P. ‘Endocrine NAFLD’ a hormonocentric perspective of nonalcoholic fatty liver disease pathogenesis. J Hepatol. 2006;44(6):1196–1207. doi:10.1016/j.jhep.2006.03.005
30. Naderian M, Kolahdoozan S, Sharifi AS, et al. Assessment of Lean patients with non-alcoholic fatty liver disease in a middle income country; prevalence and its association with metabolic disorders: a cross-sectional study. Arch Iran Med. 2017;20(4):211–217.
 © 2021 The Author(s). This work is published and licensed by Dove Medical Press Limited. The full terms of this license are available at https://www.dovepress.com/terms.php and incorporate the Creative Commons Attribution - Non Commercial (unported, v3.0) License.
By accessing the work you hereby accept the Terms. Non-commercial uses of the work are permitted without any further permission from Dove Medical Press Limited, provided the work is properly attributed. For permission for commercial use of this work, please see paragraphs 4.2 and 5 of our Terms.

