Back to Journals » Infection and Drug Resistance » Volume 16
Comparative Study on Tuberculosis Drug Resistance and Molecular Detection Methods Among Different Mycobacterium Tuberculosis Lineages
Authors He CJ, Wan JL, Luo SF, Guo RJ, Paerhati P, Cheng X, Duan CH, Xu AM
Received 30 May 2023
Accepted for publication 24 August 2023
Published 7 September 2023 Volume 2023:16 Pages 5941—5951
DOI https://doi.org/10.2147/IDR.S423390
Checked for plagiarism Yes
Review by Single anonymous peer review
Peer reviewer comments 2
Editor who approved publication: Prof. Dr. Héctor Mora-Montes
Chuan-Jiang He,1,2 Jiang-Li Wan,2 Sheng-Fang Luo,2 Rui-Jie Guo,2 Pawuziye Paerhati,2 Xiang Cheng,2 Chao-Hui Duan,1,* Ai-Min Xu2,*
1Department of Laboratory Medicine, Sun Yat-Sen Memorial Hospital, Sun Yat-Sen University, Guangzhou, 510120, People’s Republic of China; 2Department of Laboratory Medicine, The First People’s Hospital of Kashgar, Kashgar, 844000, People’s Republic of China
*These authors contributed equally to this work
Correspondence: Ai-Min Xu, The First People’s Hospital of Kashgar, No. 66, Yingbin Avenue, Kashgar, Xinjiang, 844000, People’s Republic of China, Tel +86 0998-2970071, Email [email protected]
Purpose: This study aims to compare drug resistance and detection efficacy across different Mycobacterium tuberculosis lineages, offering insights for precise treatment and molecular diagnosis.
Methods: 161 strains of Mycobacterium tuberculosis (M.tb) were tested for drug resistance using Phenotypic Drug Susceptibility Testing (pDST), High-Resolution Melting analysis (HRM), and Whole Genome Sequencing (WGS) methods. The main focus was on evaluating the accuracy of different methods for detecting resistance to rifampicin (RIF), isoniazid (INH), and streptomycin (SM).
Results: Among the 161 strains of M.tb, 83.85% (135/161) were fully sensitive to RIF, INH, and SM according to pDST, and the rate of multidrug resistance was 4.35% (7/161). The drug resistance rates of lineage 2 M.tb to the three drugs (26/219, 11.87%) were significantly higher than those of non-lineage 2 M.tb (12/264, 4.45%) (P< 0.05). Compared with pDST, WGS had a sensitivity of 100%, 94.12%, and 92.31% and a specificity of 100%, 99.31%, and 98.65% for RIF, INH, and SM, respectively, with no significant difference. The sensitivity of HRM for RIF, INH, and SM was 87.50%, 52.94%, and 76.92%, respectively, while the specificity was 96.08%, 99.31%, and 99.32%, respectively. The sensitivity of HRM for detecting INH resistance was significantly lower than that of pDST (P=0.039). Compared with HRM, WGS increased the sensitivity of RIF, INH, and SM by 12.50%, 41.18%, and 15.38%, respectively.
Conclusion: There are significant differences in drug resistance rates among different lineages of M.tb, with lineage 2 having higher rates of RIF, INH, and SM resistance than lineages 3 and 4. The sensitivity of HRM is far lower than that of pDST, and currently, the accuracy of HRM is not sufficient to replace pDST. WGS has no significant difference in detecting drug resistance compared with pDST but can identify new anti-tuberculosis drug-resistant mutations, providing effective guidance for clinical decision-making.
Keywords: Mycobacterium tuberculosis, whole-genome sequencing, lineage, drug resistance, sensitivity, specificity
Introduction
According to the World Health Organization report 2022, the incidence rate of tuberculosis in China is 7.4%, with a year-on-year increase of 1.6%. China ranks third globally in terms of tuberculosis cases, with the top three countries being developing nations.1 It is worth noting that the tuberculosis mortality rate in China has been steadily declining in recent years, which is a positive trend. The incidence rate of multidrug-resistant tuberculosis in China is 7.3%, ranking fourth globally.1 This indicates that multidrug-resistant tuberculosis is still a serious problem in China, and more robust measures need to be taken for detection, prevention, control, and treatment. Additionally, the Kashgar region in Xinjiang is one of the areas with the highest tuberculosis incidence rate in China, reaching 312.7 cases per 100,000 people.2 This calls for special attention to tuberculosis prevention and control efforts in that region, including strengthening early detection, diagnosis, and the promotion of effective treatment measures, as well as intensifying efforts to prevent and control multidrug-resistant tuberculosis. This will help achieve better tuberculosis control and reduce disease transmission.
The M.tb complex can be divided into 9 lineages, with Lineage 8 and Lineage 9 being newly discovered in recent years.3,4 People with different genetic backgrounds may exhibit different tendencies in terms of transmission, virulence, infection sites, and pathogenicity toward different tuberculosis lineages.5,6 Multiple lineages may also coexist in the same geographical area. Research has shown that drug resistance varies among different lineages, influenced by the host, with Lineage 2 being more prone to developing antibiotic resistance.7 In China, Lineage 2 is the most prevalent lineage among tuberculosis bacteria, accounting for the majority of tuberculosis cases. Lineage 3 and Lineage 4 also have a certain presence, particularly in the Kashgar region of Xinjiang, where Lineage 2, Lineage 3, and Lineage 4 are highly prevalent.8 Therefore, conducting in-depth research on these characteristics holds significant importance for optimizing prevention, control, and treatment strategies for tuberculosis in this specific region.
Currently, there are three commonly used methods for drug resistance testing in tuberculosis: culture-based drug sensitivity testing, such as pDST;9 molecular diagnostic techniques to detect differences and mutations in tuberculosis drug resistance-related gene sequences, such as HRM and Xpert MTB/RIF;10 and whole-genome sequencing to detect known or unknown mutations in drug resistance-related genes.11 In China, the incidence and drug resistance rates of tuberculosis have always been high, and phenotypic culture-based drug resistance monitoring has been ongoing for many years12 and is still considered the gold standard for tuberculosis diagnosis and drug susceptibility testing.13 This method determines drug sensitivity by co-culturing tuberculosis bacteria with anti-tuberculosis drugs. However, it has the disadvantages of low efficiency, usually taking several days to generate results, and being susceptible to contamination.14,15 Chen conducted drug susceptibility analysis on 167 strains of multidrug-resistant tuberculosis and found that the overall drug resistance rate, excluding INH and RIF, was 95.81%. The phenomenon of cross-resistance between drugs of the same type was also quite severe.16
HRM analysis is a technique that uses Polymerase Chain Reaction (PCR) to detect sequence variations and mutations in a sample. It achieves this by monitoring fluorescence changes during DNA duplex unwinding. It is a rapid and sensitive diagnostic and drug resistance screening technique, which is particularly suitable for countries burdened with a high incidence of tuberculosis. It is often considered a good alternative to DST in clinical practice.17 However, due to the influence of primer design, HRM may have limited sensitivity and detection capabilities, and it cannot cover all variations in M.tb strains.18 Chao used HRM to detect 7746 positive cultures of M.tb in Kashgar, and the results showed resistance rates of 3.58% for RIF, 2.84% for INH, and 0.93% for RIF + INH. After pDST testing on 1684 strains of M.tb, the resistance rates for RIF and INH were 4.04% and 8.73% respectively. There was a significant difference between HRM and pDST in detecting INH resistance.19 Whole-genome sequencing (WGS) is the most comprehensive method, capable of detecting all known drug-resistant mutations and discovering new ones.20 WGS has been confirmed as a replacement for culture-based DST for first-line drugs.11 It is suitable for drug resistance analysis, lineage analysis, and transmission chain analysis of M.tb. WGS can also assess the pathogenicity, virulence, and immune response differences among different tuberculosis lineages, providing more accurate information for precision treatment in clinical practice.21
In summary, although culture-based drug susceptibility testing and molecular diagnostic techniques such as HRM have their own advantages in detecting tuberculosis drug resistance, whole-genome sequencing (WGS) is the most comprehensive and accurate method. It covers all known and unknown drug-resistant mutations and provides more information about M.tb strains. Therefore, there is a preference for using whole-genome sequencing for tuberculosis drug resistance testing. However, it should be noted that WGS requires complex operations and has higher costs, requiring support from skilled laboratory technicians and data analysts.22
The objective of this study is to assess and compare the sensitivity and specificity of three different detection methods, namely WGS, HRM and pDST, under different lineages of M.tb. Furthermore, we aim to investigate the variations in RIF, INH, and SM resistance among different lineages of M. tb, as well as the characteristics of drug-resistant genetic mutations in the bacteria. By doing so, we aim to enhance the efficiency of drug resistance testing for tuberculosis, uncover the variations in drug resistance across different lineages of M. tb, and gain deeper insights into the characteristics of genetic mutations associated with drug resistance in tuberculosis. This will provide scientific evidence for the prevention, control, and treatment of tuberculosis, ultimately reducing the transmission of the disease and increasing the cure rate.
Materials and Methods
Samples
From January 2018 to November 2019, a total of 161 clinical culture positive strains of M.tb were gathered from designated tuberculosis treatment hospitals in six counties of Kashgar, Xinjiang, China. These hospitals include Kashgar First People’s Hospital, Shufu County People’s Hospital, Shule County People’s Hospital, Payzawat County People’s Hospital, Yengisar County People’s Hospital, Shache County People’s Hospital, and Poskam County People’s Hospital. Clinical data for each patient was meticulously collected and organized. The inclusion criteria for participants were as follows: individuals aged 18 years and above, presence of tuberculosis-related symptoms such as cough, sputum production, and low-grade fever, clinical presentation or imaging findings suggestive of possible pulmonary tuberculosis infection, and confirmation through positive culture of M.tb. All patients underwent clinical detection for etiology (smear, molecular, culture), drug sensitivity, and interferon-gamma release assay (γ-IGRA) results. The study was conducted in accordance with the Helsinki Declaration and ethical regulations, and was approved by the hospital ethics committee. Informed consent was obtained from each patient.
Drug Susceptibility Testing
The drug susceptibility testing is performed on tuberculosis samples that meet the inclusion criteria using the following methods: (1) Sample collection: Collection of sputum samples or other relevant clinical specimens for subsequent testing and analysis. (2) Acid-fast bacillus smear: Direct detection of acid-fast bacilli in sputum samples using acid-fast staining to confirm their presence. (3) HRM analysis: Extraction and amplification of nucleic acids from sputum samples using PCR technology to detect the presence of M.tb and determine its lineage. (4) Bacterial culture: Inoculation of sputum samples onto culture plates containing appropriate culture media to cultivate M.tb. Observation and recording of colony morphology and growth characteristics. (5) Drug susceptibility testing: Testing the drug susceptibility of cultured strains of M.tb to different anti-tuberculosis drugs, including RIF, INH, SM, and Ethambutol (EMB), using methods such as phenotypic drug susceptibility testing. (6) γ-IGRA testing: Evaluation of the immune response of patients to M.tb using the γ-IGRA method.
Phenotypic Drug Sensitivity Detection
Drug sensitivity detection was conducted using the BDBACTEC™ MGIT™ 960 automatic mycobacterium detection system. The MGIT-960SIRE series kits were utilized to detect the four drug sensitivities of RIF, INH, EMB, and SM. The reagent instructions were followed during the operation. The concentrations of RIF, INH, EMB, and SM were set at 1.0 μg/mL, 0.10 μg/mL, 5.0 μg/mL, and 1.0 μg/mL, respectively. However, the number of EMB-resistant strains was too low to be included in the final analysis.
HRM Drug Sensitivity Detection
The high-resolution dissolution curve method was utilized for drug sensitivity detection, following the manufacturer’s instructions. The SLAN96S real-time fluorescent PCR instrument was used in conjunction with the HRM kit (Xiamen Zhishan Biotechnology Co., Ltd.) to detect mutations of RIF, INH, SM, and EMB. The detection region of RIF resistance-related genes was rpoB507-533 (81bp) resistance determining region, while the detection regions of INH resistance-related genes were katG315 site, ahpC promoter (−44~-30 and −15~3 sites), inhA94 codon, and inhA promoter region (−17~-8) site. The detection region of SM resistance-related genes was rpsL43, rpsL88, and rrs513-517 mutations. The detection area of genes related to EMB resistance was the mutation of codons 306, 406, and 497 of the emhB gene. However, the number of EMB-resistant strains was too low to be included in the final analysis.
WGS Drug Resistance Data Analysis
For M.tb resistance analysis, the paired-end sequencing Fastq file obtained from MGISEQ-2000RS sequencing was used with SAM-TB23 (http://samtb.szmbzx.com), TB profiler24 (https://tbdr.lshtm.ac.uk/), and MTBseq25 software (https://github.com/ ngs-fzb/MTBseq_source). MTBseq is a local analysis method based on Linux servers, while SAM-TB and TB profiler are online analysis methods. The default parameters were used for MTBseq analysis, and drug resistance prediction was performed on all samples in sequence by commanding MTBseq --step TBfull. The SAM-TB and TB profiler analysis methods imported paired Fastq files into web pages with default parameters to automatically generate drug resistance data reports. The SAM-TB analysis process had a high degree of visualization and could simultaneously predict and analyze the resistance and sensitivity of first and second-line tuberculosis drugs. The drug resistance analysis consisted of four steps: data filtering and comparison, mutation detection, mutation annotation, and drug sensitivity prediction. Combining the TB drug resistance prediction results of the three analysis tools and the WHO’s MTBC drug sensitivity test molecular target directory,26 the drug resistance site mutation information of all samples was combined and counted.
Statistic Analysis
In this study, GraphPad Prism 8.0 statistical software and VassarStats online analysis tool were used for statistical analysis. It is expressed by the conversion of the count data, the utilization rate or the composition ratio. Chi-square tests, Fisher’s exact probability method, and paired Chi-square tests were used to compare the differences between the different groups, and all P-values were tested using a two-tail test, while also taking into account the possibility of positive and negative associations. When the P-value was less than 0.05, we considered the results to be statistically significant. In the Chi-square test, we analyzed the disaggregated data and assessed whether there were significant differences between the different groups. When the sample size is small or the frequency of some expected cells is low, we use Fisher’s exact probability method to evaluate whether the association between variables is significant. Paired Chi-square tests are used to compare two related groups or to analyze the same group over time.
Results
Comparison of Drug Resistance Rates in M.tb Phenotype Drug Sensitivity Tests of Different Lineages
Our research team previously published an article on the WGS sequencing and lineage classification of tuberculosis strains that included 161 clinical isolates. These were categorized into three major lineages: lineage 2 (73/161, 45.34%), lineage 3 (52/161, 32.30%), and lineage 4 (36/161, 22.36%).8 A total of 161 strains of M.tb culture underwent pDST using four drugs, and, regrettably, only one of those strains showed resistance to EMB. Given the small sample size, this strain was excluded from the analysis. Amongst the remaining 3 drugs (RIF, INH, SM), 26 strains showed 38 phenotypic drug resistances. Impressively, the pDST results showed that 83.85% (135/161) of the strains were exquisitely sensitive to all three drugs. Only one strain exhibited rare, single resistance to RIF, while another 8 strains were single-resistant to either INH or SM. The incidence of multidrug-resistant tuberculosis among the cohort was 4.35% (7/161), with lineage 2 being responsible for an astonishing 71.4% (5/7) of these cases (Table 1).
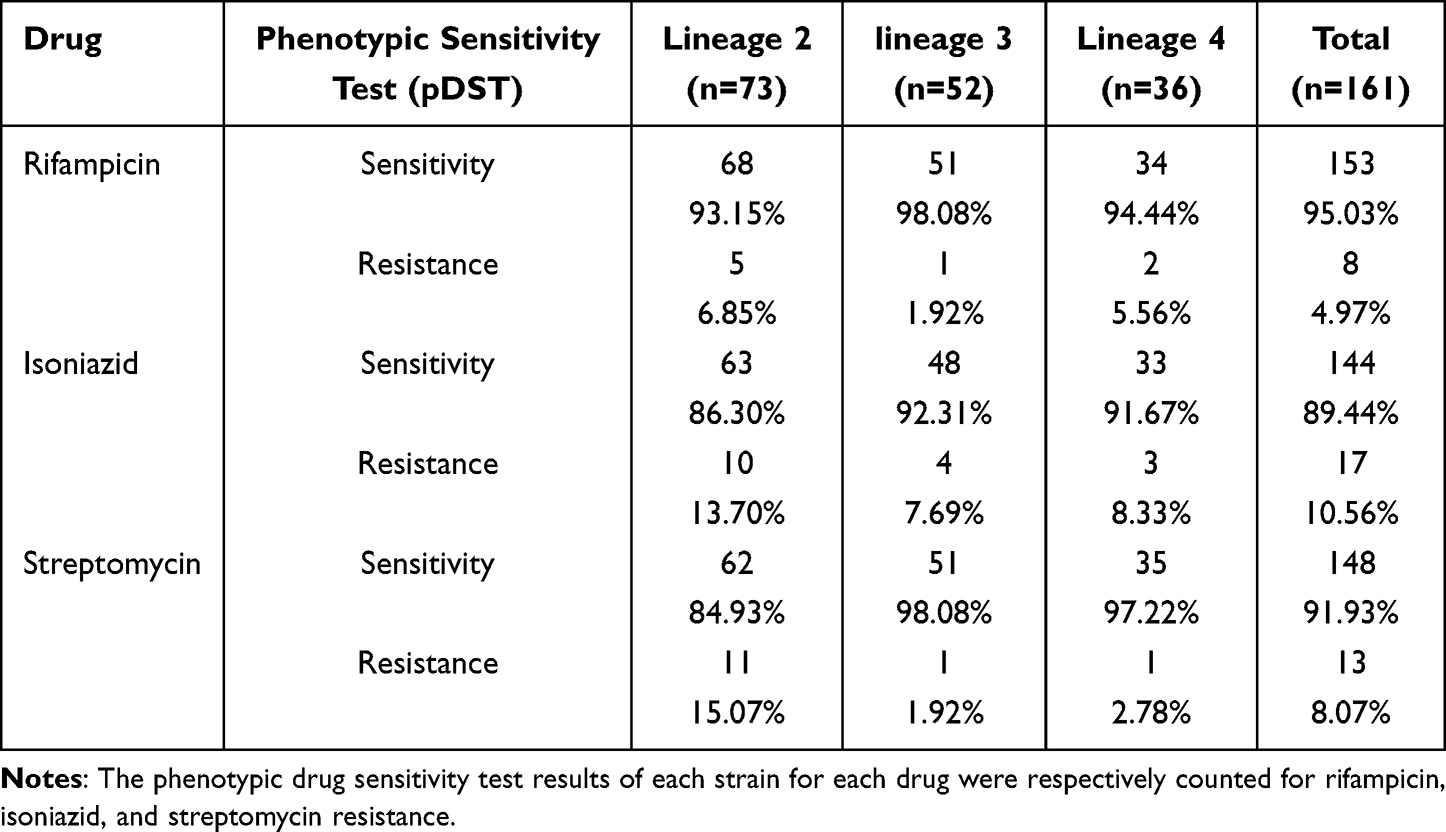 |
Table 1 Number and Proportion of Susceptibility and Resistance to pDST of Three Drugs in Different Lineages of M.tb |
The overall resistance rate to RIF was 4.97% (8/161), with lineage 2, lineage 3, and lineage 4 having resistance rates of 6.85% (5/73), 1.92% (1/52), and 5.56% (2/36), respectively. The resistance rate in lineage 2 to RIF (6.85%) was higher than that in non-lineage 2 strains (lineage 3 and lineage 4) (3.41%, 3/88), but this difference was not significant (P>0.05). The overall resistance rate to INH was 10.56% (17/161), with lineage 2, lineage 3, and lineage 4 having resistance rates of 13.7% (10/73), 7.69% (4/52), and 8.33% (3/36), respectively (Table 1). The resistance rate in lineage 2 to INH (13.7%) was higher than that in non-lineage 2 strains (7.95%, 7/88), but this difference was not significant (P>0.05) (Table 2). The overall resistance rate to SM was 8.07% (13/161), with lineage 2, lineage 3, and lineage 4 having resistance rates of 15.07% (11/73), 1.92% (1/52), and 2.78% (1/36), respectively (Table 1). The resistance rate in lineage 2 to SM (15.07%) was significantly higher than that in non-lineage 2 strains (2.27%, 2/88) (P<0.05) (Table 2). The total resistance rate in lineage 2 to all three drugs (RIF, INH, and SM) was 11.87% (26/219), significantly higher than the non-lineage 2 strains (4.45%, 12/264) (P<0.05).
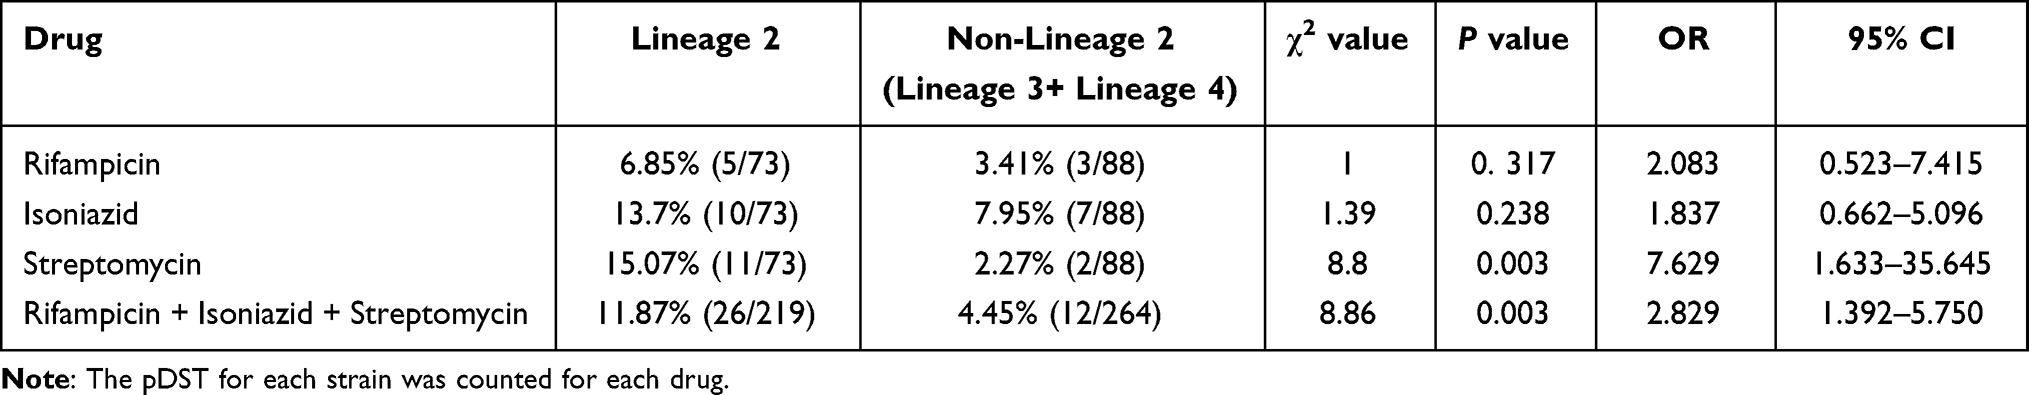 |
Table 2 Comparison of Resistance Rates to Three Drugs in Lineage 2 and Non-Lineage 2 M.tb |
Analysis of Three Drug Resistance Related Gene Mutations Based on WGS
The WGS drug resistance analysis of the 161 M.tb strains showed a detection rate of drug resistance of 16.77% (27/161), which was almost identical to the pDST results (16.15%, 26/161). Specifically, the predicted drug resistance to RIF showed perfect agreement with the phenotypic drug resistance results. Among the 8 resistant strains, 9 resistance mutations were detected, which included Rifampicin-resistance Determining Region (RRDR) mutations in the rpoB gene, with one multidrug-resistant strain carrying a double mutation of rpoB p.Ser450Leu and rpoC p.Gly332Arg. Of note, Ser450Leu was the most common mutation, accounting for 4 out of 9 mutations (44.4%). Other mutations in the RRDR codon included Leu430Pro, Leu452Pro, and His445Leu. In this study, there were no shared drug-resistance mutations between lineage 2 and lineage 4.
The katG p.Ser315Thr and fabG1 c.-15C>T mutations were detected in INH-resistant strains across all lineages, with over half of the INH-resistant strains (63.16%, 12/18) having mutations in the katG gene, including 9 cases with changes in the 315th amino acid of the katG gene (katG p.Ser315Asn and katG p.Ser315Thr), as well as katG p.Asp419His and katG p.Trp191Arg. Other resistance gene mutations included fabG1 c.-15C>T, fabG1 c.-8T>C, and ahpC c.-81C>T. One strain had both katG p.Trp191Arg and ahpC c.-81C>T mutations. One INH-resistant strain did not have any mutations detected in the resistance-related genes such as katG, inhA, fabG1, and ahpC (Figure 1).
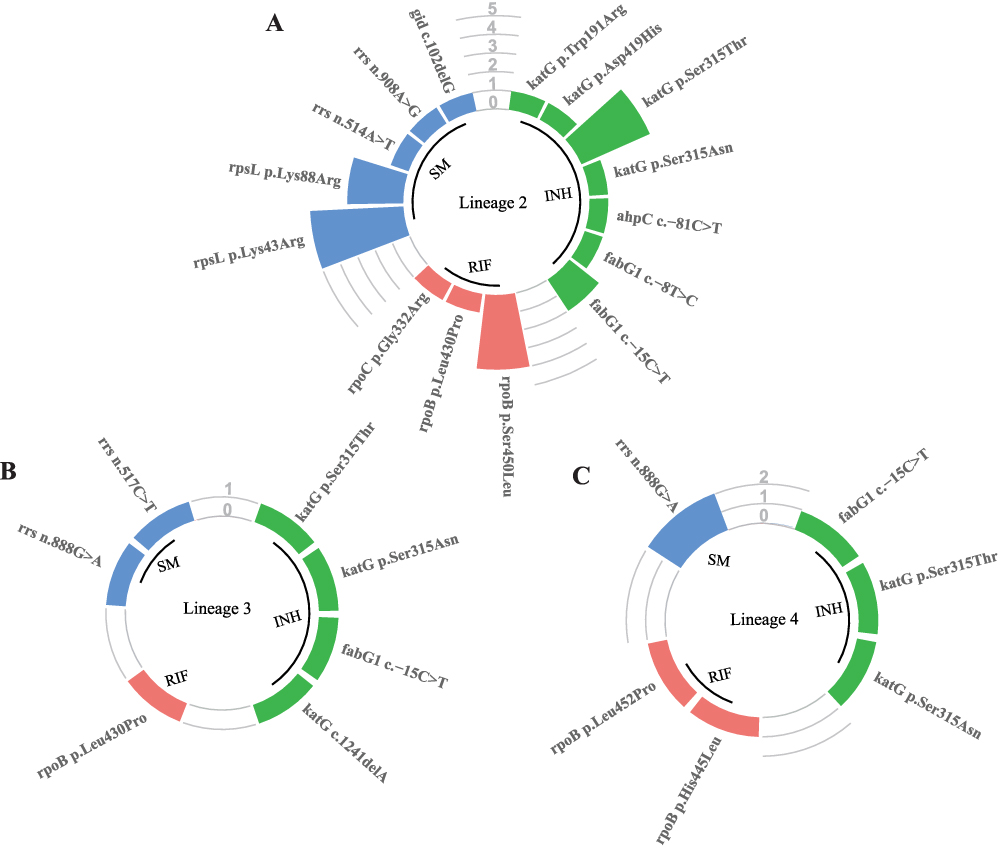 |
Figure 1 Distribution of mutations in three drug resistance-associated genes in different lineages of M.tb. Notes: (A–C) are circular bar charts representing drug-resistant mutations and deletions in lineage 2, lineage 3, and lineage 4, respectively. The number of mutations in the katG, fabG1, and ahpC genes related to INH resistance is indicated in green; the number of mutations in the rpoB and rpoC genes related to RIF resistance is indicated in red; and the number of mutations in the rpsL, rrs, and gid genes related to SM resistance is indicated in blue. |
Fifteen mutations in SM-resistant genes were detected in 14 M.tb strains, with only 12 of them being confirmed to be phenotypically resistant by MGIT 960. One strain was phenotypically resistant but was not found to have any mutations in the known resistance-related genes such as rpsL, rrs, and gid by WGS. One strain had both rrs n.908A>G and gid c.102delG mutations. The mutation sites in lineage 2 were completely different from those in lineage 3 and lineage 4. The main mutation types in lineage 2 were rpsL p.Lys43Arg (33.33%, 5/15) and rpsL p.Lys88Arg (20.00%, 3/15), while the mutations in rrs genes were the main types in lineage 3 and lineage 4. In lineage 2, the mutations in genes related to SM resistance were accompanied by mutations in 50% (5/10) of the genes related to INH resistance (Figure 1).
In addition, two M.tb strains were found to have the thyA p.His75Asn and thyX c.-16C>T mutations, which may cause resistance to Aminosalicylic acid. Another M.tb strain had the fbiA p.Lys250* mutation associated with resistance to the new anti-tuberculosis drug Delamanid.
Comparison of Drug Resistance Detection Accuracy Between WGS, HRM, and pDST
The WGS drug resistance predictions of the three drugs were highly consistent with the pDST results. Using pDST as a reference standard, gene mutations were analyzed using WGS data to predict RIF, INH, and SM resistance, with sensitivities of 100%, 94.12%, and 92.31%, and specificities of 100%, 99.31%, and 98.65% respectively (Table 3). There was no significant difference in sensitivity and specificity between the two methods (P>0.05).
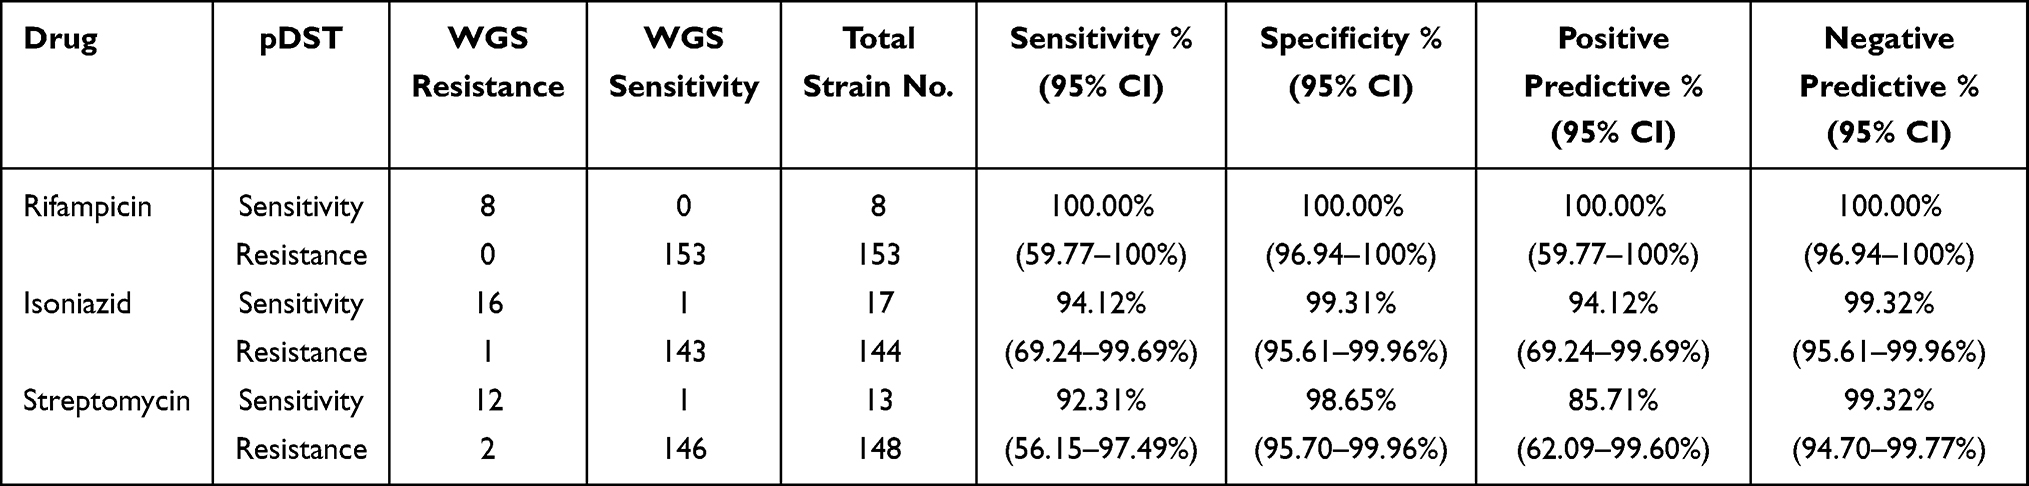 |
Table 3 Resistance Prediction Performance of WGS Compared with pDST |
Using pDST as the reference standard, the sensitivity and specificity of HRM detection of the three drug resistance-related mutations were: 87.50% and 96.08% for RIF, 52.94% and 99.31% for INH, and 76.92% and 99.32% for SM. The positive predictive value of HRM detection for RIF resistance genes was only 53.85%, indicating a high rate of false positives (Table 4). HRM detection of INH had a sensitivity of only 52.94%, indicating a high rate of false negatives. As there are many genes related to INH resistance, the coverage of the HRM method for these genes may be insufficient (eg, WGS-detected mutations in fabG1 c.-15C>T, fabG1 c.-8T>C, ahpC c.-81C>T, katG p.Asp419His, and katG p.Trp191Arg were not covered). The HRM prediction of INH resistance was significantly lower than that of pDST (P=0.039).
 |
Table 4 Resistance Prediction Performance of HRM Compared with pDST |
Compared to HRM, WGS also detected RIF resistance due to rpoC gene mutations, INH resistance due to fabG1 gene mutations, and SM resistance due to gid gene mutations, which were not included in the HRM detection range. The sensitivity of detecting all drug resistance-related gene mutations was higher with WGS than with HRM, with varying rates of improvement in sensitivity for different drugs: 12.50% for RIF, 41.18% for INH, and 15.38% for SM (Figure 2).
 |
Figure 2 Rate of increase in sensitivity of WGS compared to HRM for detection of drug resistance-associated mutations. |
Discussion
Previous studies have shown that clinical strains of M.tb in the Kashgar region can be divided into three main lineages and eleven sub-lineages, with proportions ranging from 22% to 46%. Importantly, there were no significant differences in the proportions of these lineages, indicating a diverse source of M.tb strains in the region rather than dominance by a single lineage. This suggests a complex mixture of high-prevalence lineages from neighboring countries (such as lineages 3 from India) and locally adapted sub-lineages.27 Therefore, clinicians must consider the variation in M.tb lineages when determining appropriate treatment regimens.
This study used pDST to analyze the variation in drug resistance between different M.tb lineages. The results showed that strains belonging to lineage 2 had a significantly higher overall drug resistance rate to three key drugs (RIF, INH, and SM) compared to non-lineage 2 strains, with rates of 11.87% and 4.45%, respectively (P < 0.05). These findings are consistent with previous reports from neighboring countries like Pakistan and India, which showed that lineage 2 strains exhibit higher levels of drug resistance.27,28 Additionally, this study successfully detected all MDR clinical strains using pDST and WGS, achieving an overall detection rate of 4.35% (7/161). Among them, lineage 2 strains dominated, accounting for 71.4% (5/7), which is in line with previous reports emphasizing the importance of lineage 2 in MDR strains.29 These findings highlight the importance of considering lineage-specific patterns of drug resistance when formulating treatment strategies for M.tb infection.
Studies have shown that the sensitivity of HRM for detecting RIF resistance strains ranges from 83% to 91%, while the specificity ranges from 87% to 100%. Similarly, for INH resistance strains, the sensitivity ranges from 83.3% to 98.6%, and the specificity ranges from 85.7% to 100%.30,31 In this study, the sensitivity and specificity of HRM for detecting INH resistance were 87.50% and 96.08%, respectively. However, the positive predictive value was only 53.85%, indicating a high false-positive rate. This may be attributed to the presence of silent mutations in the rpoB 81bp resistance-determining region. The sensitivity for detecting INH resistance-related genes was only 52.94% due to limitations of the HRM assay used in this study, which can only detect specific mutation sites such as katG315, ahpC promoter region (−44~-30 and −15~3), inhA94 codon, and inhA promoter region (−17~-8).32 It cannot detect the widespread mutations in the fabG1 gene in the Kashgar region. This difference may explain the lower rate of INH resistance detection by HRM compared to traditional drug susceptibility testing.19
This study found that mutations associated with RIF resistance accounted for only 84% of all RIF resistance mutations.33 Previous studies have shown that the most common causes of RIF resistance in M.tb are mutations in the katG gene (50–70%) and mabA-inhA promoter region (20–50%).34 Through WGS, it was determined that the major RIF resistance gene mutations were primarily located in the katG gene (61.11%, 11/18) and fabG1 gene (27.78%, 5/18). All lineages exhibited the katG p.Ser315Thr and fabG1 c.-15C>T mutations, but no mutations were detected in the inhA gene. This suggests that drug resistance genes and mutation sites in M.tb strains may vary in different regions. For SM resistance, major mutations usually occur in the rpsL and rrs genes. Mutations in rpsL typically lead to moderate to high-level resistance, while mutations in rrs are associated with moderate resistance.35 A strain of M.tb with simultaneous mutations in the rrs (n.908A>G) and gid (c.102delG) genes was also discovered. Furthermore, WGS revealed a heterogeneous drug-resistant strain with approximately 50% wild-type alleles and mutant alleles at the rrs n.888 site. It is noteworthy that WGS sequencing requires culturing M.tb, which may exclude strains with low mutation rates and potentially impact the accuracy of drug resistance prediction and treatment outcomes.
The sensitivity of WGS for detecting and studying relevant gene mutations related to drug resistance was significantly higher than that of HRM for INH, RIF, and SM detection. However, due to the limited sample size in this study, it is unclear whether these differences have statistical significance. Additionally, WGS identified drug-resistant mutations that were not detected by pDST or HRM. For example, a mutation in the fbiA gene (p.Lys250*) was found in an M.tb strain resistant to the novel anti-tuberculosis drug bedaquiline. WGS demonstrates excellent scalability in detecting M.tb drug resistance and holds special value in monitoring resistance to new anti-tuberculosis drugs.
With the increasing use of routine WGS in clinical testing and the integration of more sequencing data with pDST analysis, several advantages have emerged. First, this method enhances the accuracy of identifying genes associated with drug resistance, improving the precision of WGS-based drug resistance prediction. Second, it helps discover new genes associated with drug resistance. Additionally, WGS can optimize pDST using validated drug resistance gene mutations to determine the minimum inhibitory concentration, thus improving the efficiency of clinical pDST. With advances in DNA extraction and sequencing technologies, direct WGS analysis of clinical samples is gradually becoming possible. This represents a leap in innovation for drug resistance detection methods and plays an unparalleled role in combating drug-resistant tuberculosis.
Conclusions
This study employed multiple methods to evaluate the drug resistance of different branches of tuberculosis and compared the sensitivity and accuracy of existing detection methods. Techniques such as pDST, HRM, and WGS were used to detect drug-resistant gene mutations and compared with clinical treatment choices.
The study revealed significant differences in drug resistance among different branches of tuberculosis. Lineage 2 exhibited higher overall resistance rates to RIF, INH, and SM compared to Lineages 3 and 4. The sensitivity of the existing HRM method was significantly lower than pDST, and currently, HRM’s detection accuracy is still insufficient to replace pDST. HRM, however, is faster and easier to operate and can be used in combination with pDST as a screening method to aid clinical treatment choices. WGS showed similar accuracy in detecting drug resistance compared to pDST and can identify resistance mutations to new anti-tuberculosis drugs such as delamanid, thereby providing better guidance for clinical decisions. Compared to commercial HRM, WGS significantly improved the sensitivity of detecting drug-resistant gene mutations, but due to a limited sample size, this study could not demonstrate the statistical significance of this improvement, thus limiting the generalizability of the conclusions. Additionally, there is relatively limited data on new anti-tuberculosis drugs, which may impose certain limitations on result interpretation and application.
To prevent tuberculosis from re-emerging in China, it is necessary to strengthen the diagnosis and treatment of tuberculosis cases. Firstly, it is recommended to widely adopt advanced detection techniques such as pDST, HRM, and WGS to improve the accuracy of drug resistance detection. Secondly, early screening for tuberculosis should be enhanced, particularly regular screening for high-risk populations, to timely detect and treat infected individuals. Furthermore, public education should be strengthened to enhance people’s understanding and awareness of tuberculosis prevention, including the correct use of medications, adherence to treatment plans, and maintaining good hygiene habits.
Data Sharing Statement
All data generated or analyzed during this study are included in this published article. The datasets generated and analyzed during the current study are available from the NGDC database (https://ngdc.cncb.ac.cn/). The assigned accession of the submission is CRA005180. The data can be found at the following links https://bigd.big.ac.cn/gsa/browse/CRA005180.
Ethics Approval and Informed Consent
All experiments in this present study were approved by the ethics committee of the First People’s Hospital of Kashgar (approval number: 2020. No. (58)). Study was performed in accordance with the Declaration of Helsinki and relevant regulations (ethics approval and consent to participate). In addition, informed consent was obtained from each patient.
Acknowledgments
Thanks to Wenbo Zhao, and Chaoyang Chen of Xinjiang Dingju Biotechnology Co., Ltd. for their technical support in whole-genome sequencing and data analysis.
Author Contributions
Chuanjiang He, Chaohui Duan He and Aimin Xu: Conception, design or planning of the study, acquisition of the data, analysis of the data, interpretation of the results, drafting of the manuscript. Jiangli Wan and Shengfang Luo: Conception, design or planning of the study, drafting of the manuscript. Ruijie Guo, Pawuziye Paerhati and Xiang Cheng: Acquisition of the data, Conception, design or planning of the study, interpretation of the results. All authors made a significant contribution to the work reported, whether that is in the conception, study design, execution, acquisition of data, analysis and interpretation, or in all these areas; took part in drafting, revising or critically reviewing the article; gave final approval of the version to be published; have agreed on the journal to which the article has been submitted; and agree to be accountable for all aspects of the work.
Funding
This work was supported by Special Programme for Young Medical Science and Technology Talents in Health and Wellness in Xinjiang Autonomous Region (Grant Number: WJWY-202003), Xinjiang Uygur Autonomous Region Science and Technology Department-Tianshan Innovation Team (Grant Number: 2021D14003) and Natural Science Foundation of Xinjiang Uygur Autonomous Region, (Grant Number: 2020D01C013).
Disclosure
The authors report no conflicts of interest in this work.
References
1. Bagcchi S. WHO’s global tuberculosis report 2022. Lancet Microbe. 2023;4(1):e20. doi:10.1016/S2666-5247(22)00359-7
2. He X, Cao M, Mahapatra T, et al. Burden of tuberculosis in Xinjiang between 2011 and 2015: a surveillance data-based study. PLoS One. 2017;12(11):e0187592. doi:10.1371/journal.pone.0187592
3. Sanoussi CN, Affolabi D, Rigouts L, et al. Genotypic characterization directly applied to sputum improves the detection of Mycobacterium africanum West African 1, under-represented in positive cultures. PLoS Negl Trop Dis. 2017;11:e0005900. doi:10.1371/journal.pntd.0005900
4. Menardo F, Rutaihwa LK, Zwyer M, et al. Local adaptation in populations of Mycobacterium tuberculosis endemic to the Indian Ocean Rim. F1000 Res. 2021;10:60. doi:10.12688/f1000research.28318.2
5. Reed MB, Pichler VK, Mcintosh F, et al. Major mycobacterium tuberculosis lineages associate with patient country of origin. J Clin Microbiol. 2009;47:1119–1128. doi:10.1128/JCM.02142-08
6. Gagneux S. Host-pathogen coevolution in human tuberculosis. Philos Trans R Soc Lond B Biol Sci. 2012;367:850–859. doi:10.1098/rstb.2011.0316
7. Oppong YEA, Phelan J, Perdigão J, et al. Genome-wide analysis of Mycobacterium tuberculosis polymorphisms reveals lineage-specific associations with drug resistance. BMC Genomics. 2019;20(1):252. doi:10.1186/s12864-019-5615-3
8. Xu AM, He CJ, Cheng X, et al. Distribution and identification of Mycobacterium tuberculosis lineage in Kashgar prefecture. BMC Infect Dis. 2022;22(1):312. doi:10.1186/s12879-022-07307-4
9. Svadzian A, Sulis G, Gore G, et al. Differential yield of universal versus selective drug susceptibility testing of patients with tuberculosis in high-burden countries: a systematic review and meta-analysis. BMJ Glob Health. 2020;5(10):e003438. doi:10.1136/bmjgh-2020-003438
10. Sanchez-Padilla E, Merker M, Beckert P, et al. Detection of drug-resistant tuberculosis by Xpert MTB/RIF in Swaziland. N Engl J Med. 2015;372(12):1181–1182. doi:10.1056/NEJMc1413930
11. Allix-Béguec C, Arandjelovic I, Bi L, et al. Prediction of susceptibility to first-line tuberculosis drugs by DNA sequencing. N Engl J Med. 2018;379(15):1403–1415.
12. Zhao Y, Xu S, Wang L, et al. National survey of drug-resistant tuberculosis in China. N Engl J Med. 2012;366(23):2161–2170. doi:10.1056/NEJMoa1108789
13. Rigouts L, Miotto P, Schats M, et al. Fluoroquinolone heteroresistance in Mycobacterium tuberculosis: detection by genotypic and phenotypic assays in experimentally mixed populations. Sci Rep. 2019;9(1):11760. doi:10.1038/s41598-019-48289-9
14. Dicks KV, Stout JE. Molecular diagnostics for mycobacterium tuberculosis infection. Annu Rev Med. 2019;70:77–90. doi:10.1146/annurev-med-040717-051502
15. Horne DJ, Kohli M, Zifodya JS, et al. Xpert MTB/RIF and Xpert MTB/RIF Ultra for pulmonary tuberculosis and rifampicin resistance in adults. Cochrane Database Syst Rev. 2019;6(6):CD009593. doi:10.1002/14651858.CD009593.pub4
16. Chen R, Li MC, Zhao LL, et al. Analysis on drug sensitivity spectrum of 167 multidrug-resistant Mycobacterium tuberculosis in China. Zhonghua Liu Xing Bing Xue Za Zhi. 2020;41(5):764–769. Chinese. doi:10.3760/cma.j.cn112338-20191121-00823
17. Anthwal D, Gupta RK, Bhalla M, et al. Direct detection of rifampin and isoniazid resistance in sputum samples from tuberculosis patients by high-resolution melt curve analysis. J Clin Microbiol. 2017;55(6):1755–1766. doi:10.1128/JCM.02104-16
18. Pakbin B, Basti AA, Khanjari A, et al. Development of high-resolution melting (HRM) assay to differentiate the species of Shigella isolates from stool and food samples. Sci Rep. 2022;12(1):473. doi:10.1038/s41598-021-04484-1
19. Chao YQ, Zhang SX, J LI, et al. Drug resistance characteristics and transmission mechanism of Mycobacterium tuberculosis in Kashgar. Bull Dis Con Prev. 2022;37(05):5–7+11.
20. Mohamed S, Koser CU, Salfinger M, et al. Targeted next-generation sequencing: a Swiss army knife for mycobacterial diagnostics? Eur Respir J. 2021;57(3):2004077. doi:10.1183/13993003.04077-2020
21. Niemann S, Supply P. Diversity and evolution of Mycobacterium tuberculosis: moving to whole-genome-based approaches. Cold Spring Harb Perspect Med. 2014;4(12):a021188. doi:10.1101/cshperspect.a021188
22. Satta G, Lipman M, Smith GP, et al. Mycobacterium tuberculosis and whole-genome sequencing: how close are we to unleashing its full potential? Clin Microbiol Infect. 2018;24(6):604–609. doi:10.1016/j.cmi.2017.10.030
23. Liu D, Huang F, Zhang G. et al. Whole-genome sequencing for surveillance of tuberculosis drug resistance and determination of resistance level in China. Clin Microbiol Infect. 2022;28731.e9–e15. doi:10.1016/j.cmi.2021.09.014
24. Phelan JE, O’Sullivan DM, Machado D, et al. Integrating informatics tools and portable sequencing technology for rapid detection of resistance to anti-tuberculous drugs. Genome Med. 2019;11(1):41. doi:10.1186/s13073-019-0650-x
25. Kohl TA, Utpatel C, Schleusener V, et al. MTBseq: a comprehensive pipeline for whole genome sequence analysis of Mycobacterium tuberculosis complex isolates. PeerJ. 2018;6:e5895. doi:10.7717/peerj.5895
26. Walker TM, Miotto P, Koser CU, et al. The 2021 WHO catalogue of Mycobacterium tuberculosis complex mutations associated with drug resistance: a genotypic analysis. Lancet Microbe. 2022;3(4):e265–e273. doi:10.1016/S2666-5247(21)00301-3
27. Shanmugam SK, Kumar N, Sembulingam T, et al. Mycobacterium tuberculosis lineages associated with mutations and drug resistance in isolates from India. Microbiol Spectr. 2022;10(3):e0159421. doi:10.1128/spectrum.01594-21
28. Hoffner S, Sahebi L, Ansarin K, et al. Mycobacterium tuberculosis of the Beijing genotype in Iran and the world health organization eastern Mediterranean region: a meta-analysis. Microb Drug Resist. 2018;24(6):693–698. doi:10.1089/mdr.2017.0160
29. Ford CB, Shah RR, Maeda MK, et al. Mycobacterium tuberculosis mutation rate estimates from different lineages predict substantial differences in the emergence of drug-resistant tuberculosis. Nat Genet. 2013;45(7):784–790. doi:10.1038/ng.2656
30. Arefzadeh S, Azimi T, Nasiri MJ, et al. High-resolution melt curve analysis for rapid detection of rifampicin resistance in Mycobacterium tuberculosis: a single-centre study in Iran. New Microbes New Infect. 2020;35:100665. doi:10.1016/j.nmni.2020.100665
31. Parsa S, Yaghoubi A, Izadi N, et al. Detection of isoniazid and rifampin resistance in mycobacterium tuberculosis clinical isolates from sputum samples by high-resolution melting analysis. Curr Microbiol. 2022;79(9):257. doi:10.1007/s00284-022-02960-z
32. Sun WN, Zhang JX, Zhang XS, et al. Efficacy comparison of two molecular drug sensitivity methods and phenotypic drug sensitivity testindetecting drug resistance of Mycobacterium tuberculosis. Chin J Antitubercul. 2022;44(10):1016–1021.
33. Seifert M, Catanzaro D, Catanzaro A, et al. Genetic mutations associated with isoniazid resistance in Mycobacterium tuberculosis: a systematic review. PLoS One. 2015;10(3):e0119628. doi:10.1371/journal.pone.0119628
34. Charan AS, Gupta N, Dixit R, et al. Pattern of InhA and KatG mutations in isoniazid monoresistant Mycobacterium tuberculosis isolates. Lung India. 2020;37(3):227–231. doi:10.4103/lungindia.lungindia_204_19
35. Jagielski T, Ignatowska H, Bakula Z, et al. Screening for streptomycin resistance-conferring mutations in Mycobacterium tuberculosis clinical isolates from Poland. PLoS One. 2014;9(6):e100078. doi:10.1371/journal.pone.0100078
 © 2023 The Author(s). This work is published and licensed by Dove Medical Press Limited. The
full terms of this license are available at https://www.dovepress.com/terms
and incorporate the Creative Commons Attribution
- Non Commercial (unported, 3.0) License.
By accessing the work you hereby accept the Terms. Non-commercial uses of the work are permitted
without any further permission from Dove Medical Press Limited, provided the work is properly
attributed. For permission for commercial use of this work, please see paragraphs 4.2 and 5 of our Terms.
© 2023 The Author(s). This work is published and licensed by Dove Medical Press Limited. The
full terms of this license are available at https://www.dovepress.com/terms
and incorporate the Creative Commons Attribution
- Non Commercial (unported, 3.0) License.
By accessing the work you hereby accept the Terms. Non-commercial uses of the work are permitted
without any further permission from Dove Medical Press Limited, provided the work is properly
attributed. For permission for commercial use of this work, please see paragraphs 4.2 and 5 of our Terms.
Recommended articles
A New Test for the Advanced Diagnosis of Lateral Elbow Tendinopathy with Concomitant Intrasubstance Tear: Failure to Resist Extension Effort (the Free Test)
Greene C, Droppelmann G, García N, Jorquera C, Verdugo A
Orthopedic Research and Reviews 2022, 14:495-503
Published Date: 30 December 2022
Molecular Epidemiology of Clinical Mycobacterium tuberculosis Isolates from Southern Xinjiang, China Using Spoligotyping and 15-Locus MIRU-VNTR Typing
Yin C, Mijiti X, Liu H, Wang Q, Cao B, Anwaierjiang A, Li M, Liu M, Jiang Y, Xu M, Wan K, Zhao X, Li G, Xiao H
Infection and Drug Resistance 2023, 16:1313-1326
Published Date: 8 March 2023
Evaluating the Sensitivity, Specificity, and Accuracy of ChatGPT-3.5, ChatGPT-4, Bing AI, and Bard Against Conventional Drug-Drug Interactions Clinical Tools
Al-Ashwal FY, Zawiah M, Gharaibeh L, Abu-Farha R, Bitar AN
Drug, Healthcare and Patient Safety 2023, 15:137-147
Published Date: 20 September 2023
Mycobacterium tuberculosis Sub-Lineage 4.2.2/SIT149 as Dominant Drug-Resistant Clade in Northwest Ethiopia 2020–2022: In-silico Whole-Genome Sequence Analysis
Mekonnen D, Munshea A, Nibret E, Adnew B, Getachew H, Kebede A, Gebrewahid A, Herrera-Leon S, Amor Aramendia A, Benito A, Abascal E, Jacqueline C, Aseffa A, Herrera-Leon L
Infection and Drug Resistance 2023, 16:6859-6870
Published Date: 26 October 2023
Proposal and Verification of New Revised Criteria for ABPA/ABPM Diagnosis
Cai R, Ge H, Liu B, Tang Y, Wang J, Chen X, Liu B, Hu X, Deng S, Li H, Dai L, Tang J, Wu C, Gong X, Wang G, Li X, Feng J
Journal of Asthma and Allergy 2025, 18:467-477
Published Date: 3 April 2025