Back to Journals » Journal of Hepatocellular Carcinoma » Volume 9
Comparative Response of HCC Cells to TKIs: Modified in vitro Testing and Descriptive Expression Analysis
Authors Sagmeister P, Daza J ![]() , Ofner A, Ziesch A, Ye L, Ben Khaled N, Ebert M, Mayerle J, Teufel A, De Toni EN
, Ofner A, Ziesch A, Ye L, Ben Khaled N, Ebert M, Mayerle J, Teufel A, De Toni EN ![]() , Munker S
, Munker S
Received 30 December 2021
Accepted for publication 21 April 2022
Published 9 July 2022 Volume 2022:9 Pages 595—607
DOI https://doi.org/10.2147/JHC.S356333
Checked for plagiarism Yes
Review by Single anonymous peer review
Peer reviewer comments 4
Editor who approved publication: Dr Laura A. Dawson
Paula Sagmeister,1,* Jimmy Daza,2,* Andrea Ofner,1 Andreas Ziesch,1 Liangtao Ye,1,3,4 Najib Ben Khaled,1,3 Matthias Ebert,2,5 Julia Mayerle,1 Andreas Teufel,2,5 Enrico N De Toni,1,3 Stefan Munker1,3
1Department of Medicine II, LMU Munich, Munich, Bavaria, Germany; 2Department of Medicine II, Medical Faculty Mannheim, Heidelberg University, Mannheim, Baden Wurttenberg, Germany; 3Liver Center Munich, LMU Munich, Munich, Bavaria, Germany; 4Center of Digestive Disease, Sun Yat-Sen University, Shenzhen, Guangdong, People’s Republic of China; 5Center for Preventive Medicine and Digital Health Baden-Württenberg (CPDBW), Heidelberg University, Mannheim, Baden Wurttenberg, Germany
*These authors contributed equally to this work
Correspondence: Paula Sagmeister, Email [email protected]
Introduction: Although the treatment paradigm for hepatocellular carcinoma (HCC) has recently shifted in favour of checkpoint inhibitor (CPI)-based treatment options, the tyrosine kinase inhibitors (TKI) currently approved for the treatment of HCC are expected to remain the cornerstone of HCC treatment alone or in combination with CPIs. Despite considerable research efforts, no biomarker capable of predicting the response to specific TKIs has been validated. Thus, personalized approaches to HCC may aid in determining optimal treatment lines for 2nd and 3rd lines. To identify new biomarkers, we examined differential sensitivity and investigated potential transcriptomic predictors.
Methods: To this aim, the sensitivity of nine HCC cell lines to sorafenib, lenvatinib, regorafenib, and cabozantinib was evaluated by a prolonged treatment scheme to determine their respective growth rate inhibition concentrations (GR50). Subgroups discriminated by GR50 values underwent differential expression and gene set enrichment analysis (GSEA).
Results: The nine cell lines showed broadly different sensitivities to different TKIs. GR50 values of sorafenib and regorafenib clustered closer in all cell lines, whereas treatments with lenvatinib and cabozantinib showed diversified GR50 values. GSEA showed the activation of specific pathways in sensitive vs non-sensitive cell lines. A signature consisting of 14 biomarkers (GAGE12H, GJB6, PTCHD3, PRH1-PRR4, C6orf222, HBB, C17orf99, GOLGA6A, CRYAA, CCL23, RP11-347C12.3, RP11-514O12.4, FAM180B, and TMPRSS4) discriminates the cell lines’ response into three distinct treatment profiles: 1) equally sensible to sorafenib, regorafenib and cabozantinib, 2) sensible to lenvatinib, and 3) more sensible to regorafenib than sorafenib.
Conclusion: We observed diverse responses to either of the four TKIs. Subgroup analysis of TKI effectiveness showed distinct transcriptomic profiles and signaling pathways associated with responsiveness. This prompts more extensive studies to explore and validate pharmacogenomic and transcriptomic strategies for a personalized treatment approach, particularly after the failure of CPI treatment.
Keywords: biomarkers, sorafenib, lenvatinib, regorafenib, cabozantinib
Introduction
Hepatocellular carcinoma is the sixth most common and third most deadly malignant disease.1 The tyrosine kinase inhibitors sorafenib,2 lenvatinib,3 regorafenib,4 and cabozantinib5 are approved for the treatment of advanced HCC for first or second-line treatment. But with the advent of immune oncology (I/O)-based therapies in the first line, the previously established empirical order of TKI treatment has changed. However, even before CPIs, there was an unmet need for adequate predictors of response for either of the four TKIs. Although TKIs impinge on several specific intracellular signal transduction mechanisms, their clinical use in monotherapy or in combination with CPIs is based on empirical clinical evidence.6,7 Previous attempts to establish clinically validated biomarkers of response for these agents have not been implemented in clinical routine so far, leaving an unmet need for biomarkers capable of guiding the choice of TKI.8–11
The TKIs’ mechanism of action consists of the inhibition of various receptor tyrosine kinases by disrupting their autophosphorylation, as well as inhibiting Raf serine/threonine kinases, eventually leading to a disruption of the PI3K/AKT/mTOR- and MAPK/ERK-pathways, which are believed to play a significant role in the genesis of hepatocellular carcinoma.12–14 The four TKIs’ differences in mechanisms of action and toxicity can be explained through a varying potency towards one target point, as well as slightly different points of target.15–18 However, despite the well-characterized mechanism of action, there are little to no clinical, phenotypical, or genetic features to guide us to the right therapy.
The lack of predictive biomarkers in the clinical routine may be attributed to the lack of histological specimen acquisition in the initial pharmaceutical studies. Another explanation may be that candidate biomarkers were generated from an analysis made in artificial in vitro systems, and the lack of microenvironment hinders transfer to the in vivo situation. For example, the treatment duration (in vitro 48–72 h) is not remotely close to the clinical situation (weeks to months). In addition, it has recently been shown that pharmacogenomic examinations are strongly confounded by the cell lines’ individual proliferative speed. To increase biological relevance, Hafner et al developed the GR50 metric, a new approach to assess cellular drug efficacy.19,20 Another rationale for using the GR50 metric instead of ED50 or AUC, is that it also corrects for cell-line specific differences in read-out measurements by adjusting for read-outs of initial cell populations.21
In this study, we used the GR50 metric and a prolonged treatment scheme to examine the response of nine hepatoma cell lines to the four viable tyrosine kinase inhibitors to compare responsiveness to either drug and narrow down potential markers that could be further examined in subsequent studies as predictors of response for one of the four TKIs.
Materials and Methods
Cell Lines, Cell Culture and Chemicals
Nine human hepatoma cell lines with different clinical and histological features were used for this research project (Table 1).
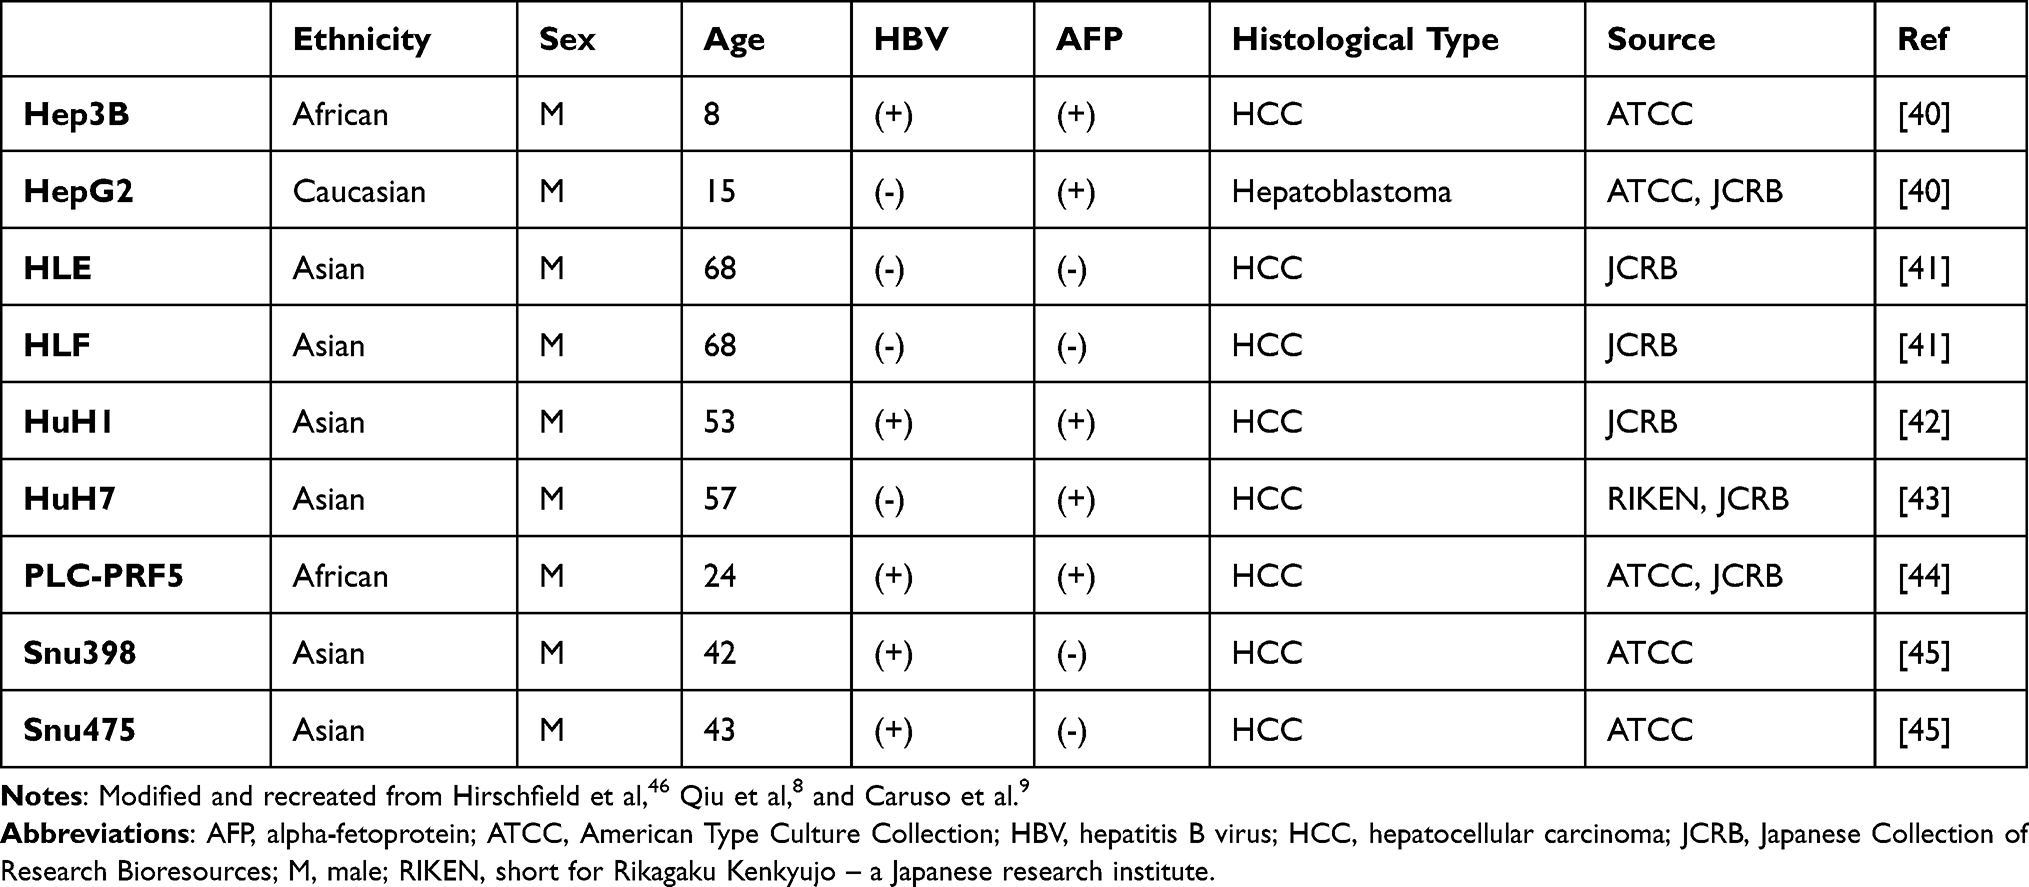 |
Table 1 Clinical and Histological Features of Nine Hepatoma Cell Lines |
HuH1, HuH7, HepG2, PLC-PRF5, HLE, and HLF were cultivated in Dulbecco’s modified Eagle’s medium (DMEM, Sigma-Aldrich, USA), Hep3B in Dulbecco’s Modified Eagle’s Medium/Nutrient Mixture F-12 (DMEM/F12, Sigma-Aldrich, USA), supplemented with 200mM L-glutamine (Sigma-Aldrich, USA), and Snu398 and Snu475 in RPMI-1640 medium (Sigma-Aldrich, USA). The disparity of media for the various cell lines is due to our intent to continue using the same medium compound for one cell that has been used in the original publications and in our laboratory in the past, in order to protect the cells from sudden unfamiliarity. All the media were supplemented with 10% Filtrated Bovine Serum (FBS, PAN-Biotech GmbH, Germany) and 1% Penicillin–Streptomycin (P/S, Sigma-Aldrich, USA). Cells were constantly maintained at 37℃ and 5% CO2. Genetic fingerprinting was performed on all cell lines by the Leibniz Institute DSMZ-German Collection of Microorganisms and Cell Cultures to confirm authenticity. Furthermore, all cell lines have been tested negative for mycoplasms by polymerase chain reaction. Sorafenib tosylate, lenvatinib (E7080), regorafenib (BAY 73–4506), and cabozantinib (XY184 free base) were acquired from AdooQ Bioscience, USA, dissolved in 100% dimethyl sulfoxide (DMSO, Carl Roth GmbH + Co. KG, Germany) at a stock concentration of 100µM and stored at −80℃ until used.
Cell Viability Assay
After seeding 800–3000 cells from each cell line in 96-well-plates and leaving the cells to attach for approximately 24 hours, the cells were then treated with seven different concentrations of each drug, ranging from 0.03µM to 20µM in a 1:2–3 serial dilution. The individual concentration ranges for each drug were determined in preliminary experiments that have been conducted beforehand. A DMSO medium solution was used as a control group. After six days, the cell count was estimated using SYBR green assay (Lonza, USA), and fluorescence was measured using the Cytofluor Series 4000 (Applied Biosystems, Germany), as previously described.22 All experiments were performed in triplicates with at least three individual biological replicates per drug.
To minimize the effect of proliferation, we decided on using the growth rate method established by Hafner et al. To calculate the normalized GR(c)-value at concentration c, the following equation is being used: 
with x(c) being the cells treated with one drug at concentration c at day 7, xctrl being the DMSO treated control wells from the same plate at day 7, and x0 being the untreated cells from the time of treatment at day 1. Typically, the GR value lies between −1 and +1, whereas a positive value (0 to +1) correlates to partial growth inhibition, GR equals 0 stands for complete cytostasis, ie, no increase or decrease in cell number, and negative values (0 to −1) stand for cytotoxicity, that is cell death. Afterwards, the GR values were fitted to a sigmoid curve, and the GR50 and GRmax values were calculated. The GRmax value, which is a metric for drug efficacy, represents the GR value for one drug at the highest concentration of this drug. The GR50 value is a metric for drug potency and represents the concentration at which GR(c) = 0.5.19
Processing of Gene Expression Data
To determine the driving genes affecting the response to our medication groups (sorafenib, lenvatinib, regorafenib and cabozantinib) and of an additional “regorafenib over sorafenib” (RoS) subset, differential expression analysis was performed using the “DESeq2” package in R Version 4.1.1 and RStudio Desktop 2021.09 release,23 evaluating our treatment responses in a binary “sensitive vs resistant” notation against the established cell lines RNA-seq gene expression profiles obtained from the Liver Cancer Model Repository (LIMORE, https://www.picb.ac.cn/limore/), a cell models compilatory project with 81 human liver cancer cell models.8 The resulting information was filtered to contain only genes with ±2-fold changes (FC), and a cut-off value of 0.001 was set as statistically significant using the Bonferroni-Holm adjusted p-value.
Gene Clustering and Pathway Enrichment Analysis
To visualize the DESeq2 data, a heatmap focusing on the gene groups of interest was created using the Heatmapper webtool (http://www.heatmapper.ca).23,24 Clustering was performed using the Complete Linkage method, and the Manhattan distance method was selected due to the high dimensionality of the data. Furthermore, KEGG pathways enrichment analysis was performed on the resulting differential expression data using a cut-off value of 0.05 in the ShinyGO webtool version 0.64,25 and further pathway analysis and filtering of our data with the same cut-off value was performed using the commercial tool QIAGEN’s Ingenuity Pathways Analysis (IPA).26 A selection of the most statistically significant over- and under-expressed genes was performed by filtering the genes with a fold change ±2 and an adjusted p-value under 0.001.
Graphics
Graphics and figures were generated using GraphPad Prism 8 (GraphPad Software Inc., USA), Heatmapper (University of Alberta, Canada), or QIAGEN’s Ingenuity Pathway Analysis (QIAGEN Inc., USA).
Statistical Analysis
Data were analyzed using IBM SPSS statistics software version 27 (SPSS Inc., IBM, USA) or GraphPad Prism 8 (GraphPad Software Inc., USA). Results are shown as mean ± standard deviation for at least three individual experiments. One-way analysis of variance (ANOVA) or the more robust Welch-ANOVA, in case equal variances using Levene’s test could not be shown, followed by a Tukey- or Games Howell post hoc analysis, was conducted. If p < 0.05 between two cell lines, these two cell lines showed a statistically significant difference in response to the drug that has been examined.
Additionally, the correlation coefficients, which show the strength of correlation between our GR50 values, our GRmax values, Qiu et al’s IC50 values,8 and Caruso et al’s GI50 values,9 for every drug, as well as overall, were calculated. According to the linearity of the correlation between two factors, Pearson’s correlation or the more robust Spearman’s Rho correlation were calculated.
Results
Differential Responsiveness to Clinically Viable TKIs Sorafenib, Lenvatinib, Regorafenib, and Cabozantinib
The effect of four tyrosine kinase inhibitors, sorafenib, lenvatinib, regorafenib, and cabozantinib, on cell viability was assessed on nine hepatoma cell lines, exhibiting different clinical and molecular features (Table 1). We used a six-day treatment protocol to mimic the clinical application of TKIs. Each TKI induces a decrease in cell viability in a dose-dependent manner in all cell lines (Figure 1A–D). In addition, we observed a diversified response to the four TKIs (Figure 1E–H).
 |
Figure 1 The four tyrosine kinase inhibitors, sorafenib, lenvatinib, regorafenib, and cabozantinib, cause a reduction in cell viability in all nine cell lines. (A) Effect of sorafenib on all cell lines with a concentration range of 0.31μM to 5μM in a 1:2 serial dilution. (B) Effect of lenvatinib on all cell lines with a concentration range of 0.25μM to 20μM in a 1:3 serial dilution. (C) Effect of regorafenib on all cell lines with a concentration range of 0.31μM to 5μM in a 1:2 serial dilution. (D) Effect of cabozantinib on all cell lines with a concentration range of 1.25μM to 20μM in a 1:2 serial dilution. Potency (GR50 values) for (E) sorafenib, (F) lenvatinib, (G) regorafenib, and (H) cabozantinib. Results are presented as the mean and standard deviation for at least three experiments. P<0.05 for all drugs by analysis of variance (ANOVA). Due to the increased proliferation of Snu475 under sorafenib and regorafenib at the lower concentrations and to better fit the representation in this graph, we do not show Snu475 at said lower concentrations. The complete dose–response curves of Snu475 can be seen in Supplementary Figure 1. |
Upon sorafenib treatment (Figure 1A), HLE, Snu398, Hep3B, and HepG2 are more sensitive to GR50 concentrations below 2μM and HLF, HuH1, HuH7, Snu475, and PLC-PRF5 are less sensitive to GR50 concentrations above 2μM. The difference in sensitivity between the most (1.3µM) and the least sensitive cell line (2.9µM) only differs by a factor of 2.2. Almost all cell lines display a slight cytotoxic effect at the highest concentration of sorafenib (Table 2).
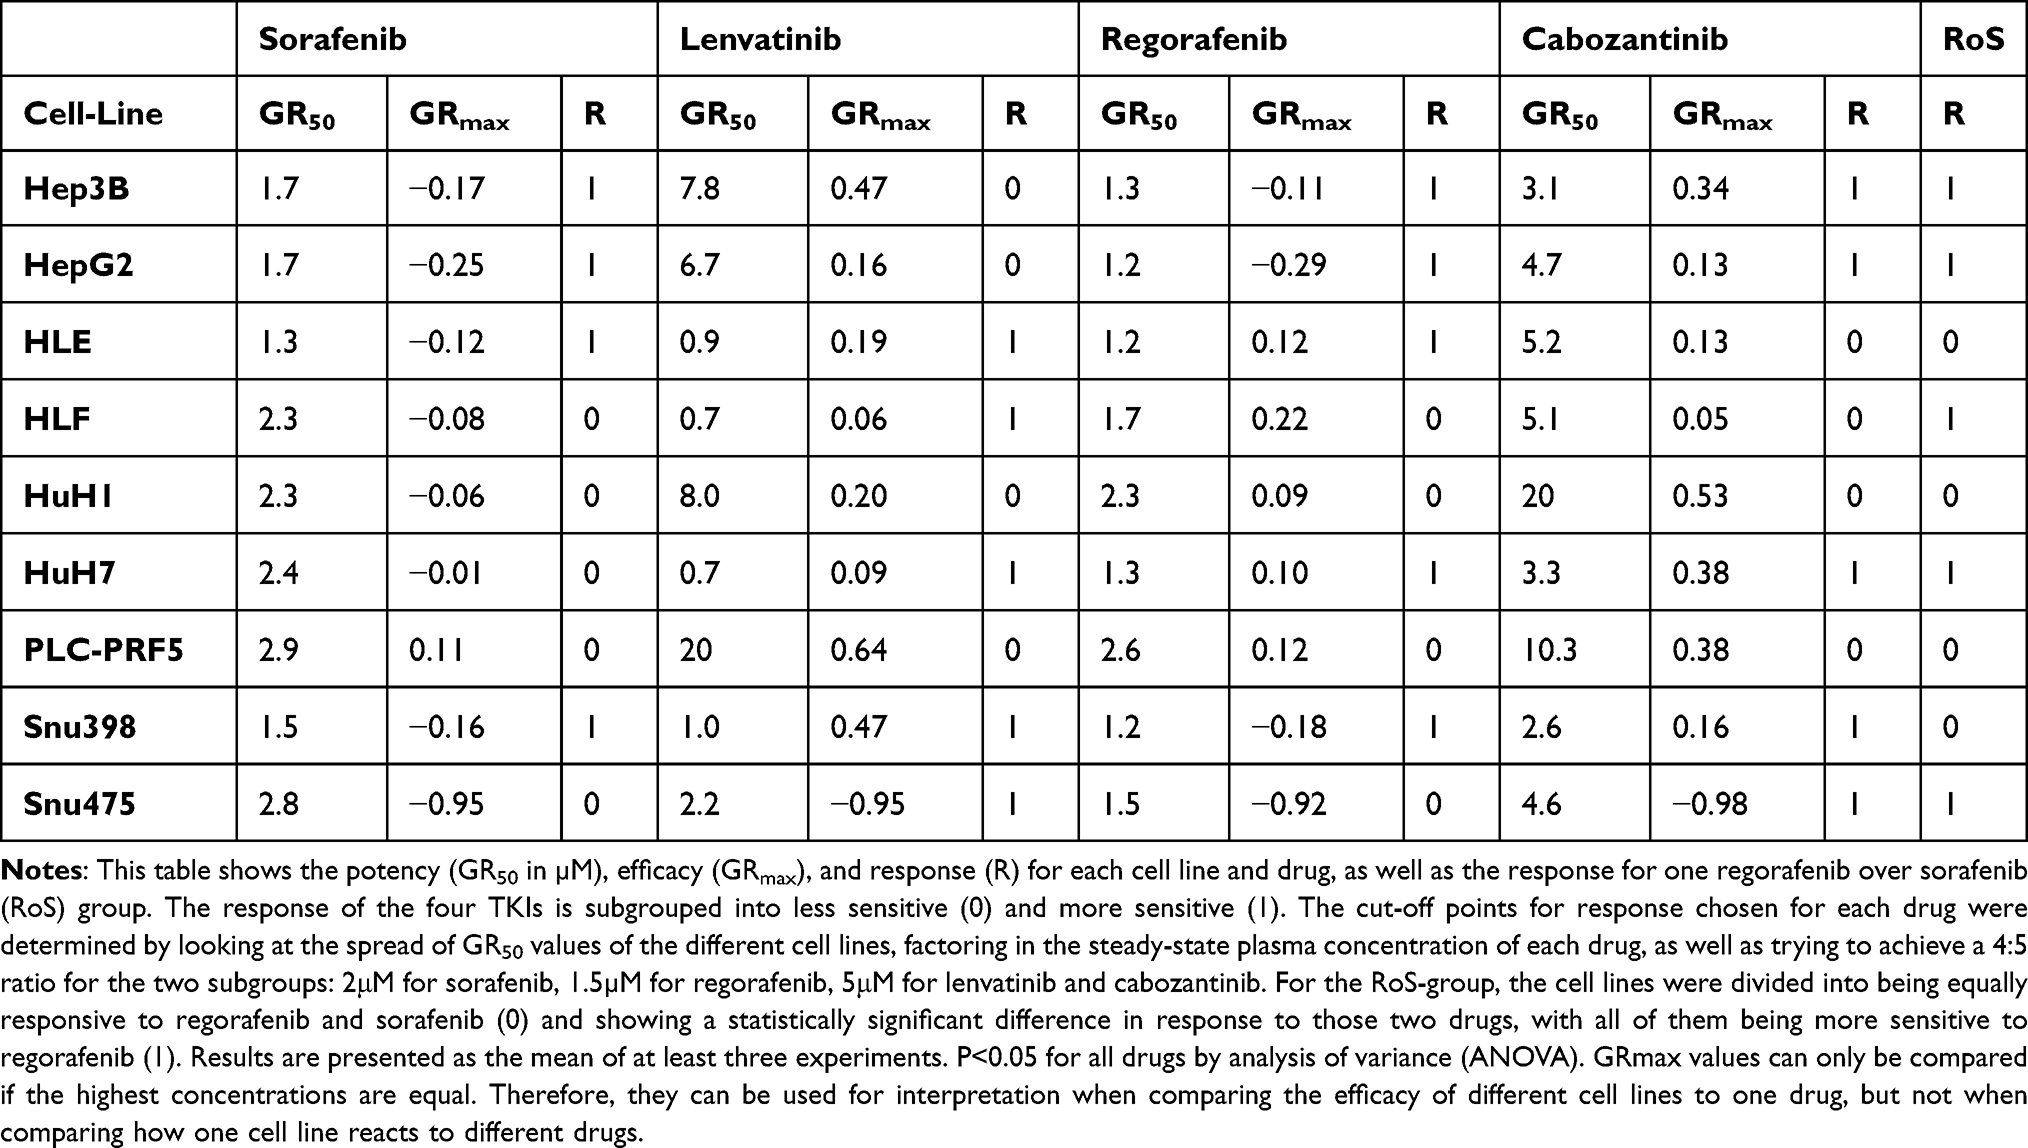 |
Table 2 GR Values for Potency and Efficacy |
Lenvatinib displays a heterogeneous pattern of response (Figure 1B), dividing all cell lines but Sun475 into two groups. The first group, containing HuH7, Snu398, HLE, and HLF, shows GR50 values between 0.7μM and 1.0μM. The second group, containing HepG2, Hep3B, PLC-PRF5, and HuH1, displays GR50 values between 6.7μM and >20μM. Hence, the GR50 value of the most sensitive cell lines (HuH7 and HLF) differs from the most resistant cell line (PLC-PRF5) by more than 28.5 times.
Regorafenib’s range of efficacy is similar to sorafenib’s (Figure 1A and C). However, some cell lines, such as Hep3B, HepG2, HLF, HuH7, and Snu475, show a difference in potency when treated with sorafenib and regorafenib, with all of them being more sensitive to the second-line treatment option regorafenib (Figure 1A and C, Table 2).
Lastly, cabozantinib shows a little more variety of its effect on different cell lines (Figure 1D). The most sensitive (Snu398, GR50, C-Snu398= 2.6µM) and the least sensitive cell line (HuH1, GR50 C-HuH1 >20µM) differ by a factor greater than 7.6, respectively.
Snu475 appeared to be the overall least responsive cell line. Snu475 proliferates approximately 12 times slower than the next slowest proliferating cell line, assuming exponential growth. Snu475 is the only cell line, that shows a complete cytotoxic response to all four drugs, with GRmax values almost reaching −1 (GRmax,S-Snu475 = −0.95, GRmax,L-Snu475 = −0.95, GRmax,R-Snu475 = −0.92 and GRmax,C-Snu475 = −0.98, respectively) (Table 2).
Differential Expression Analysis of the Four Treatment Groups and a Fifth Category
The bioinformatics evaluation following the responsiveness analysis allowed the addition of a fifth category (“regorafenib over sorafenib”) to determine the genes involved in the differential potency response of a specific subset of cell lines to the second-line treatment regorafenib in comparison to the first-line treatment sorafenib. Expression data is filtered for significance as previously described in the methods. Our differential gene expression data are translated into an expression heatmap (Figure 2). On the far left of Figure 2, we can see two distinct clusters that show a highly over- and under-expression (FC > ±20) consistent in all our cell lines (Figure 2, blue rectangle), showing two groups of identifiable gene expression signatures concerning the distinct drug response groups.
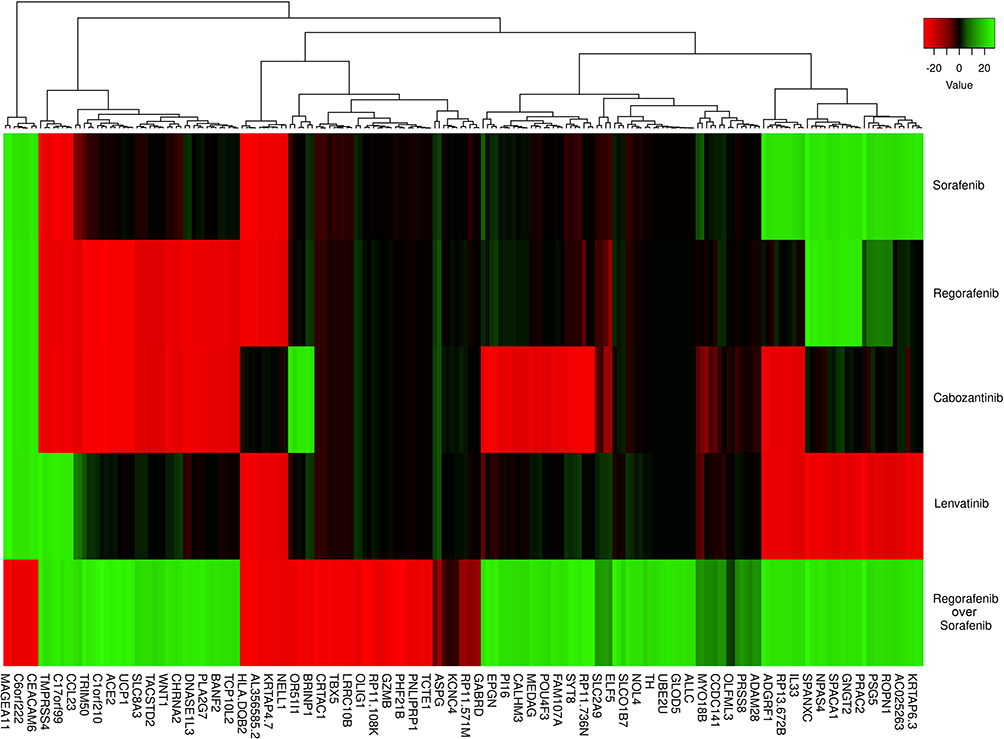 |
Figure 2 Gene differential expression values compared to treatment groups. This heatmap shows the differential expression values for each drug. The scale is measured in expression fold changes (FC) in relation to the standardized expression profiles of the original cell lines after being analyzed with the DESeq2 algorithm. The dark colors represent FC values between 0 and ± 10, and the lighter colors present FC values over ± 10. At the left, the blue rectangle includes two clusters tinted in light green and red in all the treatment groups, suggesting two identifiable gene expression signatures: the left one, with overexpression in four groups (sorafenib [S], regorafenib [R], cabozantinib [C] and lenvatinib [L]) and underexpression in those that responded differentially better to regorafenib than sorafenib (RoS), and the right one, with genes highly underexpressed in the first three groups ((S), (R), and (C) and overexpressed in the last two (L and RoS). |
Gene Sets Enrichment Analysis
Out of the 19.761 human genes evaluated on the RNA-seq data, a total of 966 fulfilled our differentially expressed genes (DEG) filtering criteria (FC >|2|, pAdj > 0.001) in at least one of the treatment groups. Specifically, there were 217 DEG for sorafenib, 296 for lenvatinib, 201 for regorafenib, 240 for cabozantinib, and 210 for the RoS group (ie those related to the differential response between sorafenib and regorafenib).
These gene groups were analyzed for pathway enrichment using ShinyGO (to evaluate KEGG) and QIAGEN’s IPA. The KEGG pathway enrichment analysis (Table 3) showed three pathways – two of them associated with drug metabolism in the sorafenib responding group, one – related to neurotransmitters – in the lenvatinib group, seven pathways – most of them related to cardiac function – in the regorafenib group, three receptor-related pathways in the cabozantinib group, and no enriched pathways in the RoS group. Noticeably, “Neuroactive ligand-receptor interaction” was shared among lenvatinib, regorafenib, cabozantinib, and “Cell adhesion molecules” among regorafenib and cabozantinib.
Furthermore, among the top five canonical pathways detected using the IPA analysis (Table 3), two were enriched in all the treatment groups: “CREB Signalling in Neurons” and “Breast Cancer Regulation by Stathmin1”, and three were partially shared: “Hepatic Fibrosis/Hepatic Stellate Cell Activation” between lenvatinib and sorafenib, “Synaptic Long-Term Depression” between sorafenib and regorafenib, and “Calcium Signaling” between cabozantinib and RoS.
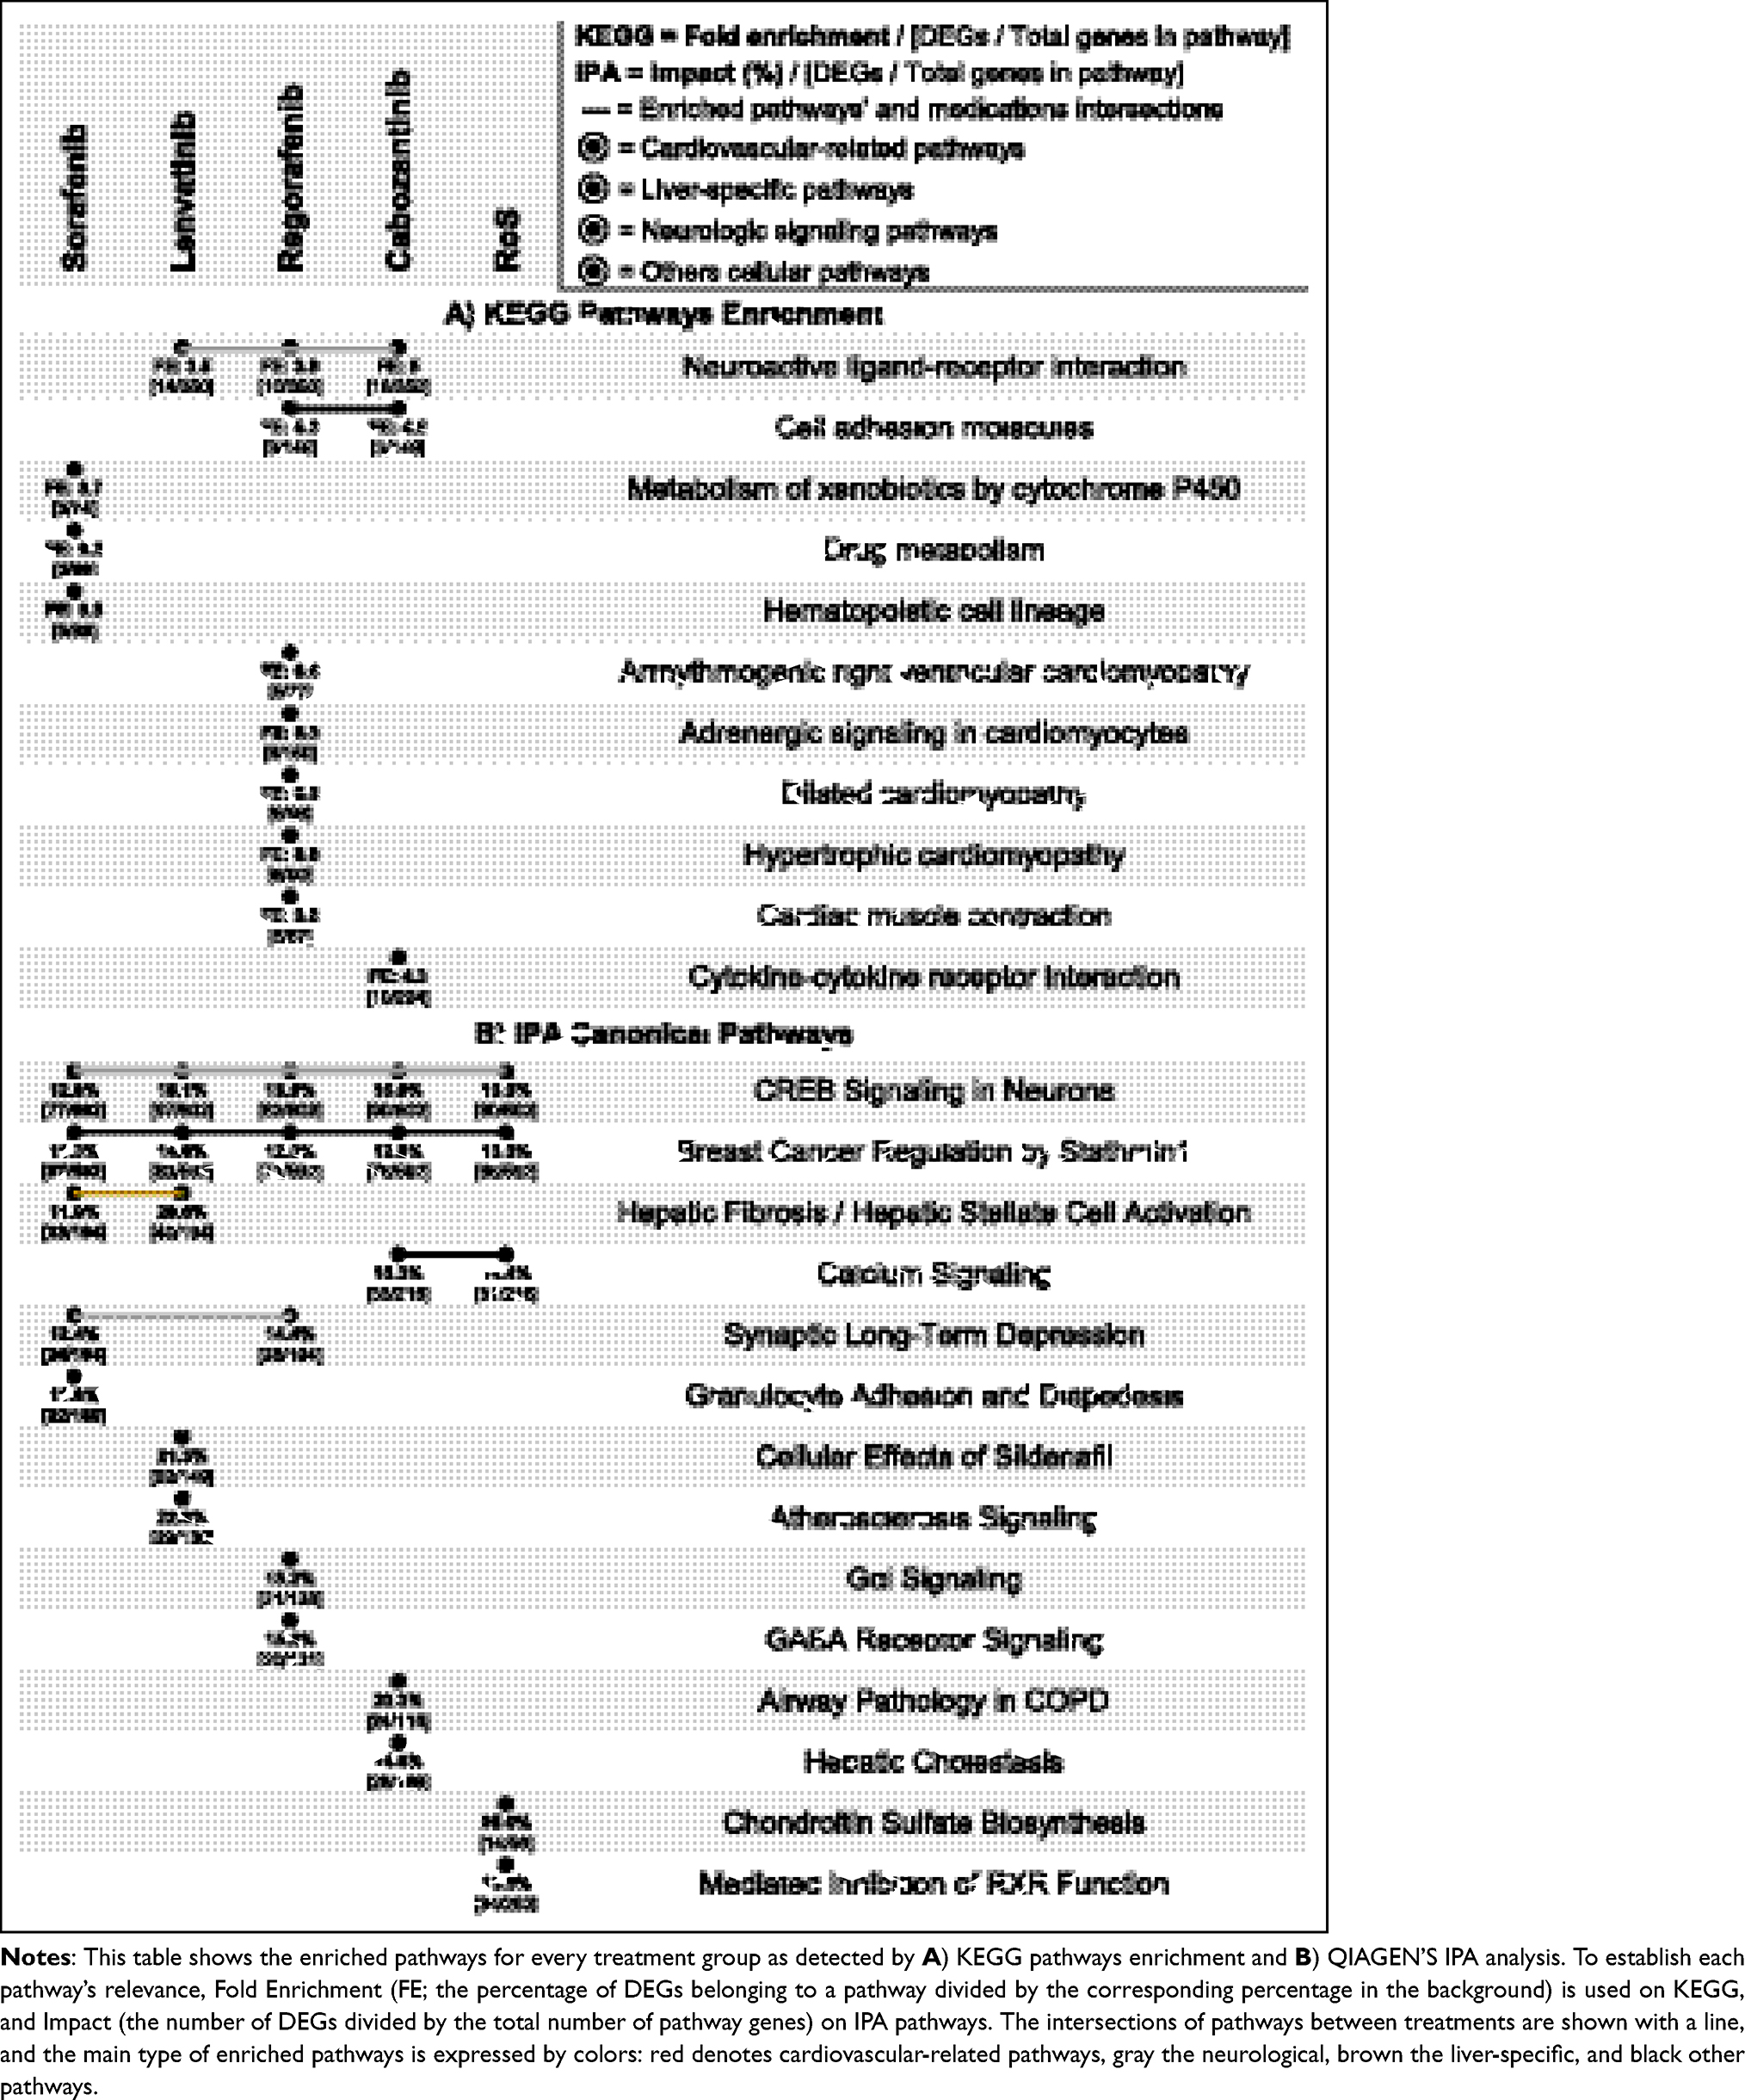 |
Table 3 KEGG and IPA enriched pathways by treatment group. |
Resulting Gene Expression Signature
After filtering the DEG consistently significant in the five treatment groups, 14 genes (GAGE12H, GJB6, PTCHD3, PRH1-PRR4, C6orf222, HBB, C17orf99, GOLGA6A, CRYAA, CCL23, RP11-347C12.3, RP11-514O12.4, FAM180B, and TMPRSS4) fulfilled our criteria. Moreover, they all presented a highly significant level of over or under expression (FC > |20|). When organized as in the heatmap clusters, three different expression profiles were formed: one comprehending those that respond to sorafenib, regorafenib, and cabozantinib; one comprehending those that respond to lenvatinib; and one with those that respond better to regorafenib compared to sorafenib (Table 4).
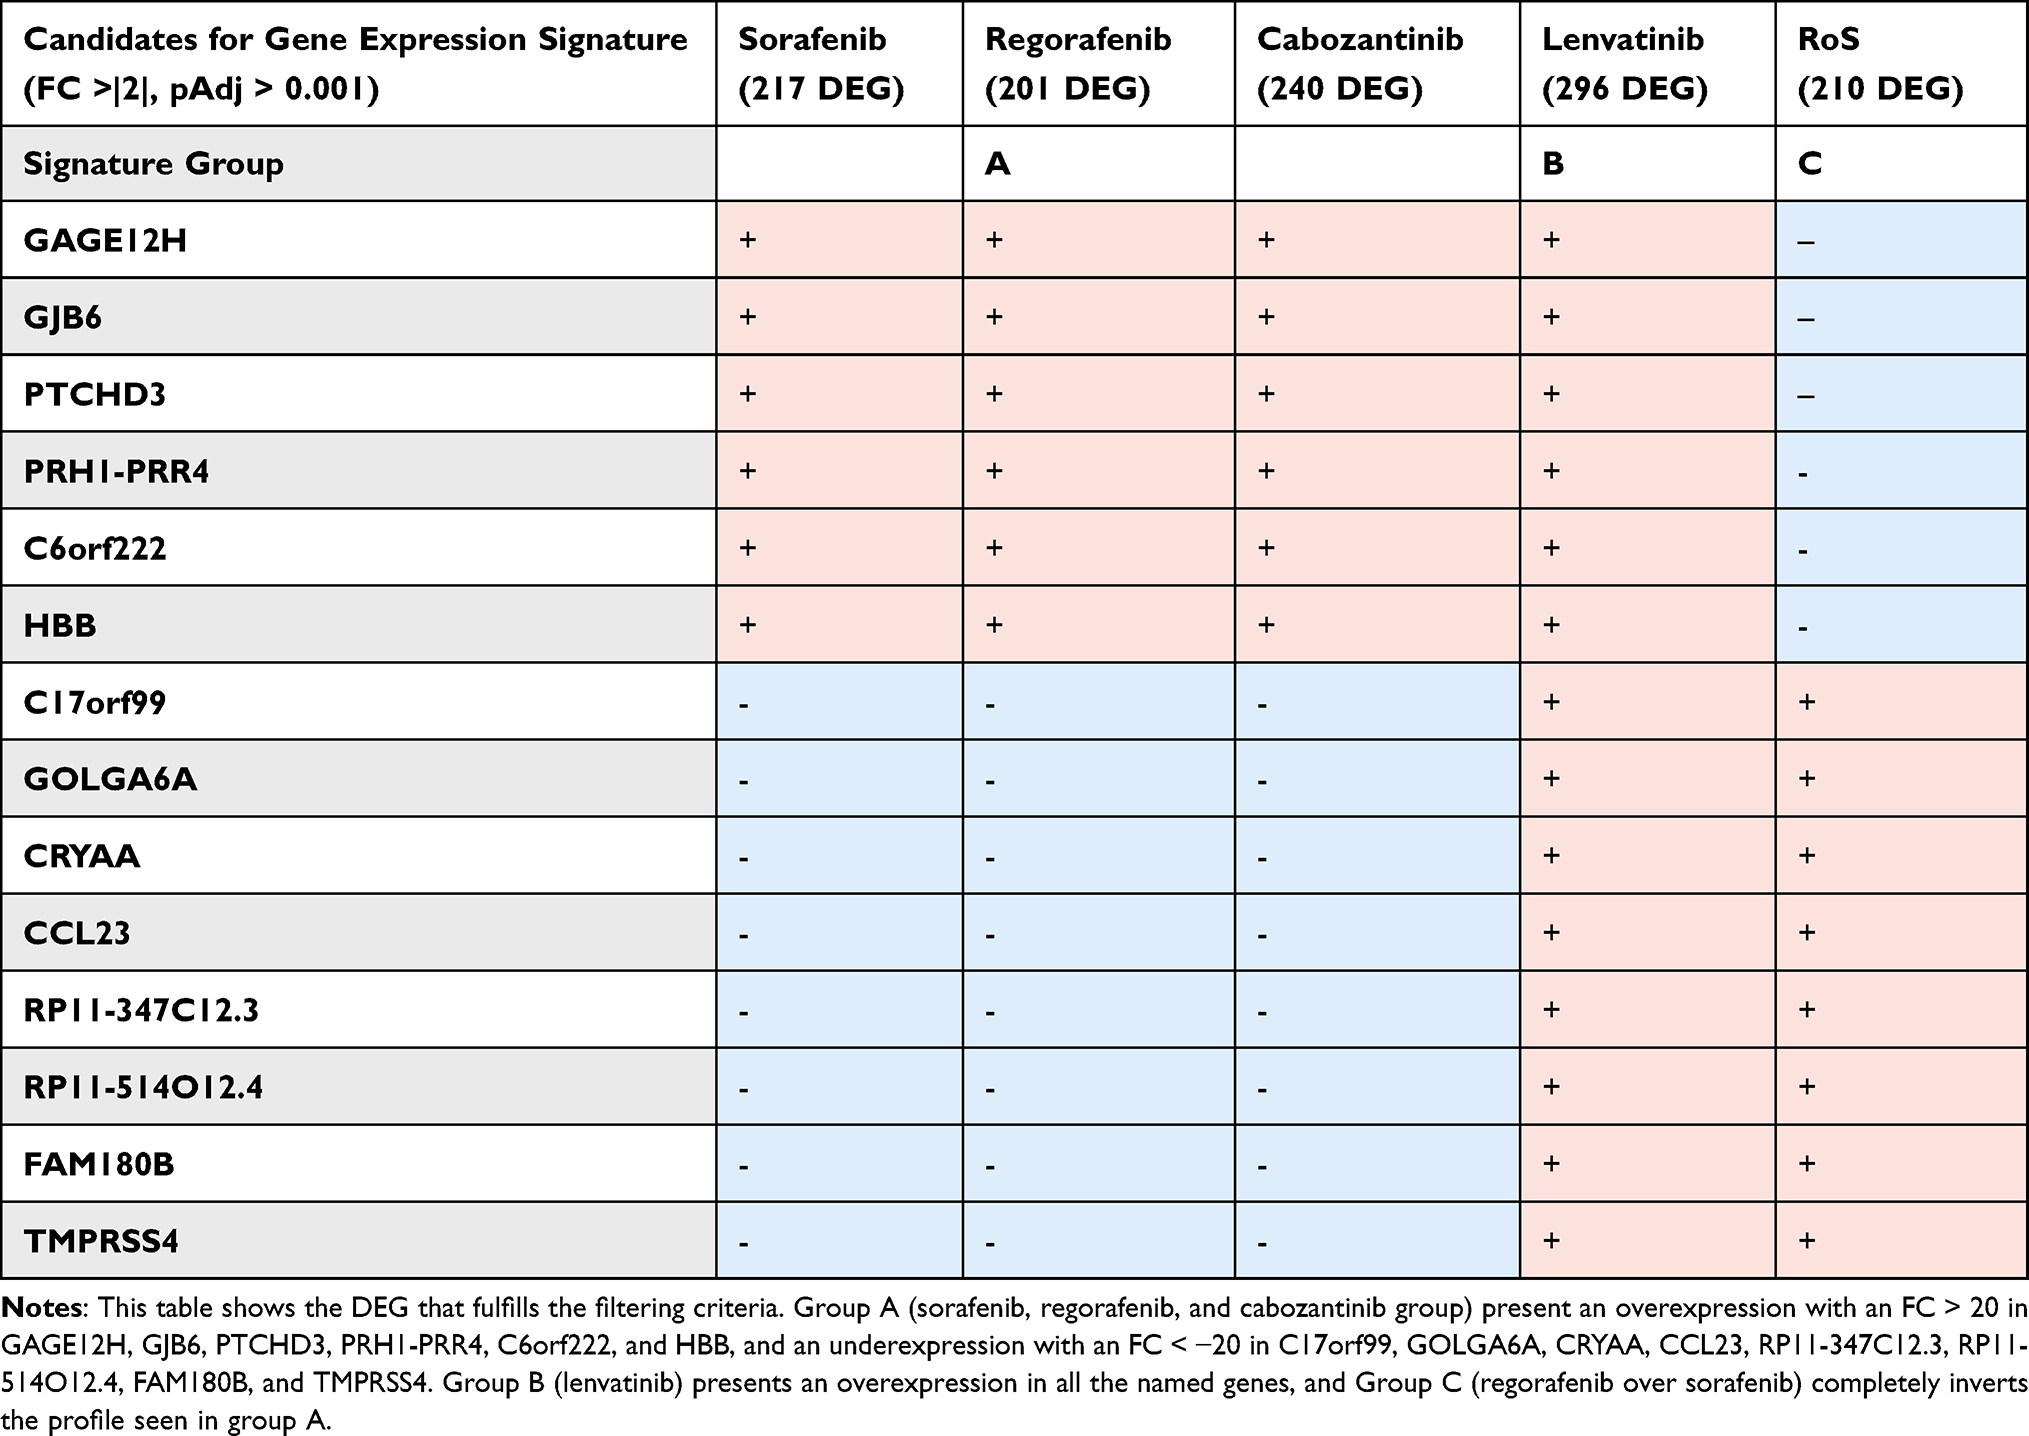 |
Table 4 Gene Expression Signature Candidate |
Discussion
The current gold standard for treating HCC in an advanced stadium are I/O-based therapies, such as atezolizumab plus bevacizumab or durvalumab plus tremelimumab, which are presently investigated in the ongoing randomized Phase III HIMALAYA study and show promising efficacy in the preliminary analysis.27,28 However, if the tumor is non-responsive to the I/O-treatment or contraindications prohibiting I/O-based therapies are present, inclusion in second-line studies or the usage of TKIs may be considered as the next choice in the treatment algorithm for advanced HCCs.6 If a patient must be treated with a TKI, there is no established biomarker to guide treatment. Therefore, the use and the application sequence of these agents in different lines of treatment are solely determined by empirical evidence. To narrow potential gene sets and explore the feasibility of biomarker-guided approaches, we investigated the differential responsiveness of nine hepatoma cell lines to the four currently approved TKIs, followed by a differential expression and gene set enrichment analysis.
Cell line-specific heterogeneity of proliferative rates influences the comparison of in vitro efficacy measurements. It is assumed that only 40% of statistically significant associations between IC50 values and genomic alterations in large-scale screening experiments are not confounded.20 The recently developed GR50 metric adjusts for proliferation and integrates cytostatic and cytotoxic effects.19
In the last years, extensive experiments have been conducted examining the response of various hepatoma cell lines to the four tyrosine kinase inhibitors among an array of other substances.8,9 Given that we used the GR50 metric, a prolonged treatment protocol, and a different assay, a comparison of these two papers to our experiments can only be made to a certain extent.
In our experiments, we used the GR method with the GR50 value as a marker for potency, as previously described. Qiu et al used the half-maximal inhibitory concentration (IC50) as a value for potency, which shows the drug concentration having caused 50% inhibition on cell viability and Caruso et al decided to portray the potency of their substances in the form of the GI50 value, which is the renamed version of the IC50 value correcting for the cell count at time zero.29 In their work, some inhibitory concentrations of regorafenib, lenvatinib, and cabozantinib were outside the metrics range (Supplementary Table 1). While we can see an apparent decrease in cell viability in our experiments, both Qiu et al and Caruso et al show that while the four TKIs lead to a decrease in cell viability on all cell lines, their effect on hepatoma cell lines in vitro is among the smallest out of all the agents that were evaluated in their experiments. In addition, comparing the efficacy measurements in all three datasets, that is, Caruso et al’s, Qiu et al’s and ours, for the four TKIs, a difference in responses can be seen, with our experiments showing the most potent effect in cell decrease for all four TKIs (Supplementary Tables 1 and 2). Duration of treatment also affects the validity and clinical relevance of in vitro studies.30 In a clinical setting, the four TKIs are usually administered over several weeks to months. Therefore, we decided on using a drug assay with a six-day treatment duration instead of a shorter drug assay to mimic this clinically proven treatment schedule better. Both Qiu et al and Caruso et al decided on a shorter duration of drug exposition (48–72 hours) compared to our experiment (144 h). In contrast, we observed significantly decreased GR50 values compared with the other two studies (Supplementary Table 1) and attribute it to the prolonged treatment. Since cytostasis is the primary mode of action of the four TKIs, a transcriptomic lag or cellular accumulation of the cytostatic factors may explain the observed differences with the prolonged treatment scheme. Additionally, we can also assume that the different metrics for efficacy, the varying execution of the drug assays, and the mode of action of the TKIs play a role in the different results of these three studies.8,9
A diversified response can be observed for all four TKIs. In particular, lenvatinib and cabozantinib, but also sorafenib and regorafenib, showed a pronounced spread of GR50 values. Thus, the diverse pharmacological response reflects the divergent biology of these cell lines and gives justification to pursue biomarker-guided approaches such as transcriptomic-driven approaches or individualized testing strategies. In this regard, Broutier et al recently showed the feasibility of ex vivo culture of individual tumoroid HCC and cholangiocarcinoma cell lines and the possibility of ex vivo drug testing.31
Interestingly, the response in most cell lines to sorafenib and regorafenib correlates strongly, which is not surprising considering their chemical structure only differs by one additional fluorine atom,16 they display almost identical target points,32 and regorafenib is only approved for therapy in patients with HCC in the second line after they have previously been treated with sorafenib.33
Moreover, the differential responsiveness of each drug allowed us to compare their related canonical pathways and the different gene expression profiles. Among the shared sets, KEGG enrichment analysis identified the “neuroactive ligand-receptor interaction pathways” in the lenvatinib, regorafenib, and cabozantinib responders, and “Cell adhesion molecules” in regorafenib and cabozantinib responders. This further validates the enrichment of these pathways in sorafenib-resistant cell lines as reported by Gan et al, including focal adhesion, neuroactive ligand/receptor, and cytokine/cytokine receptor.34 The rest of the pathways were enriched only in treatment-specific responses, being the sorafenib responders related to drug metabolism and regorafenib responders to cardiac-related pathways. Notably, no specific KEGG enriched set was identified in the regorafenib over sorafenib group and none of our TKIs’ key target pathways in KEGG (eg “Pathways in cancer”, “VEGF signaling pathway”, “MAPK signaling pathway”, among others) was enriched.
On the other hand, Qiagen’s IPA analysis showed two pathways enriched in all five groups: “CREB Signalling in Neurons” and “Breast Cancer Regulation by Stathmin 1”. As recently reviewed by Zhang et al, the cAMP-PKA-CREB pathway has a versatile role in multiple targets, and it can promote or inhibit HCC in a context-dependent matter, suggesting that CREB’s homeostasis is vital for HCC progression.35 Stathmin 1ʹs importance for hepatoma seems to be on the rise, since it has recently been proposed as a tumorigenic and progression regulator due to its interaction with YAP1,36 and, when overexpressed, as a novel treatment target for HCC.37 Furthermore, sorafenib and regorafenib shared the “Synaptic Long-Term Depression” pathway, which is not surprising given that it encompasses the activation of glutamate and other neurotransmitter receptors,38 as seen in the KEGG neuroactive ligand/receptor enriched set. Additionally, we found the “Hepatic Fibrosis/Hepatic Stellate Cell Activation” in both the sorafenib and lenvatinib responders and “Calcium Signalling” in the cabozantinib and “regorafenib over sorafenib” groups.
As discussed in a recent review by Qian et al, the creation of an HCC gene expression signature is challenging because it usually arises from the cirrhotic liver, and the comparison of tumoral samples against non-tumorous tissue is complicated as the control tissue itself may have significant changes in gene expression.39 Nonetheless, the determination of a common DEG signature capable of predicting multiple cell lines’ treatment response into three distinct TKI treatment profiles has been achieved: A) those equally sensible to sorafenib, regorafenib, and cabozantinib, B) those more sensible to lenvatinib, and C) those more sensible to regorafenib than sorafenib. This signature comprised the 14 genes that were statistically significant in each treatment, and additionally, they had a Fold-change of ±20, turning them into easily discernible molecules. Consequently, despite not being able to discern the best responders to cabozantinib, it may be used to decide whether the group sorafenib/cabozantinib, lenvatinib, or regorafenib should be used for a patient’s best possible outcome according to their tumor DEG. However, due to the limited number of cell lines investigated, these data must be validated in more extensive cell-line or tumoroid-line collections before being tested in a clinical approach. Another limitation of our study, is that we have conducted our experiments on cell lines that were generated from untreated HCCs and did not undertake any pre-treatments. As the currently preferred first-line therapy for advanced HCCs are CPI therapies, TKIs are mainly used upon progression to the preferred first line. Upon progression to CPI therapies, it is likely that the tumor biology in untreated tumors differs significantly from post-CPI tumors, for example, due to the process of acquiring resistance. Therefore, inference of our results to the post-CPI situation is limited. We are planning on using in vitro systems such as the tumoroid cell culture method in follow-up studies, to better reflect the whole spectrum of tumor biology and the clinical context of the HCC tumor entity.31
Upon evaluation of multiple hepatoma cell lines in vitro and in silico, a common gene expression signature was characterized that, if validated in vitro and in vivo, could accurately predict a patient’s HCC response to the different available TKIs, and it could help us define the best treatment for the individual patient according to transcriptomic analysis in our near future.
Conclusion
We observed heterogeneous responsiveness to the four currently approved TKIs. This generates a rationale for evaluating genomic and transcriptomic biomarkers and individualized approaches, such as patient-derived tumoroid culture and testing. In addition, interobserver heterogeneity highlights the need for additional investigations evaluating the applicability of modified in vitro strategies (ie, prolonged testing) and new efficacy metrics. The transcriptomic-analysis-generated genes candidating as biomarkers showed distinct signaling pathways associated with sensitivity to either TKI and found a candidate gene signature capable of discriminating response to the TKIs.
Disclosure
Dr Najib Ben Khaled reports reimbursement for meeting attendance fees and travel expenses from Eisai and received from Falk, during the conduct of the study. Prof. Dr. Andreas Teufel reports grants from the state of Baden-Wuerttemberg, Germany, during the conduct of the study. Prof. Dr. Enrico De Toni reports personal fees from AstraZeneca, Bayer, BMS, EISAI, Eli Lilly & Co, MSD, Mallinckrodt, Omega, Pfizer, IPSEN, Terumo and Roche, and received travel expenses from Arqule, AstraZeneca, BMS, Bayer, Celsion and Roche, also Lecture honoraria from BMS and Falk, grants from Arqule, AstraZeneca, BMS, Bayer, Eli Lilly, and IPSEN and Roche, outside the submitted work. The authors report no other conflicts of interest in this work.
References
1. Ferlay J, Lam F, Colombet M, et al. Global cancer observatory: cancer today. Int Agency Res Cancer. 2020;144:1941–1953.
2. Llovet JM, Ricci S, Mazzaferro V, et al. Sorafenib in advanced hepatocellular carcinoma. N Engl J Med. 2008;359(4):378–390. doi:10.1056/NEJMoa0708857
3. Kudo M, Finn RS, Qin S, et al. Lenvatinib versus sorafenib in first-line treatment of patients with unresectable hepatocellular carcinoma: a randomised Phase 3 non-inferiority trial. Lancet. 2018;391(10126):1163–1173. doi:10.1016/S0140-6736(18)30207-1
4. Bruix J, Qin S, Merle P, et al. Regorafenib for patients with hepatocellular carcinoma who progressed on sorafenib treatment (RESORCE): a randomised, double-blind, placebo-controlled, phase 3 trial. Lancet. 2017;389(10064):56–66. doi:10.1016/S0140-6736(16)32453-9
5. Abou-Alfa GK, Meyer T, Cheng A-L, et al. Cabozantinib in Patients with Advanced and Progressing Hepatocellular Carcinoma. N Engl J Med. 2018;379(1):54–63. doi:10.1056/NEJMoa1717002
6. Gordan JD, Kennedy EB, Abou-Alfa GK, et al. Systemic therapy for advanced hepatocellular carcinoma: ASCO guideline. J Clin Oncol. 2020;38(36):4317–4345. doi:10.1200/JCO.20.02672
7. Llovet JM, Kelley RK, Villanueva A, et al. Hepatocellular carcinoma. Nat Rev Dis Primers. 2021;7(1):6. doi:10.1038/s41572-020-00240-3
8. Qiu Z, Li H, Zhang Z, et al. A pharmacogenomic landscape in human liver cancers. Cancer Cell. 2019;36(2):179–193.e11. doi:10.1016/j.ccell.2019.07.001
9. Caruso S, Calatayud A-L, Pilet J, et al. Analysis of liver cancer cell lines identifies agents with likely efficacy against hepatocellular carcinoma and markers of response. Gastroenterology. 2019;157(3):760–776. doi:10.1053/j.gastro.2019.05.001
10. Vogel A, Saborowski A. Current strategies for the treatment of intermediate and advanced hepatocellular carcinoma. Cancer Treat Rev. 2020;82:101946. doi:10.1016/j.ctrv.2019.101946
11. Moldogazieva NT, Zavadskiy SP, Sologova SS, et al. Predictive biomarkers for systemic therapy of hepatocellular carcinoma. Expert Rev Mol Diagn. 2021;21(11):1147–1164. doi:10.1080/14737159.2021.1987217
12. Shaw RJ, Cantley LC. Ras, PI(3)K and mTOR signalling controls tumour cell growth. Nature. 2006;441(7092):424–430. doi:10.1038/nature04869
13. Sebolt-Leopold JS, English JM. Mechanisms of drug inhibition of signalling molecules. Nature. 2006;441(7092):457–462. doi:10.1038/nature04874
14. Krause DS, Van Etten RA. Tyrosine kinases as targets for cancer therapy. N Engl J Med. 2005;353(2):172–187. doi:10.1056/NEJMra044389
15. Wilhelm S, Carter C, Lynch M, et al. Discovery and development of sorafenib: a multikinase inhibitor for treating cancer. Nat Rev Drug Discov. 2006;5(10):835–844. doi:10.1038/nrd2130
16. Wilhelm SM, Dumas J, Adnane L, et al. Regorafenib (BAY 73-4506): a new oral multikinase inhibitor of angiogenic, stromal and oncogenic receptor tyrosine kinases with potent preclinical antitumor activity. Int J Cancer. 2011;129(1):245–255. doi:10.1002/ijc.25864
17. Matsui J, Funahashi Y, Uenaka T, et al. Multi-kinase inhibitor E7080 suppresses lymph node and lung metastases of human mammary breast tumor MDA-MB-231 via inhibition of vascular endothelial growth factor-receptor (VEGF-R) 2 and VEGF-R3 kinase. Clin Cancer Res. 2008;14(17):5459–5465. doi:10.1158/1078-0432.CCR-07-5270
18. Yakes FM, Chen J, Tan J, et al. Cabozantinib (XL184), a novel MET and VEGFR2 inhibitor, simultaneously suppresses metastasis, angiogenesis. Mol Cancer Ther. 2011;10(12):2298–2308. doi:10.1158/1535-7163.MCT-11-0264
19. Hafner M, Niepel M, Chung M, et al. Growth rate inhibition metrics correct for confounders in measuring sensitivity to cancer drugs. Nat Methods. 2016;13(6):521–527. doi:10.1038/nmeth.3853
20. Hafner M, Niepel M, Sorger PK. Alternative drug sensitivity metrics improve preclinical cancer pharmacogenomics. Nat Biotechnol. 2017;35(6):500–502. doi:10.1038/nbt.3882
21. Brooks EA, Galarza S, Gencoglu MF, et al. Applicability of drug response metrics for cancer studies using biomaterials. Philos Trans R Soc Lond B Biol Sci. 2019;374(1779):20180226. doi:10.1098/rstb.2018.0226
22. Ye L, Mayerle J, Ziesch A, et al. The PI3K inhibitor copanlisib synergizes with sorafenib to induce cell death in hepatocellular carcinoma. Cell Death Discov. 2019;5:86. doi:10.1038/s41420-019-0165-7
23. Love MI, Huber W, Anders S. Moderated estimation of fold change and dispersion for RNA-seq data with DESeq2. Genome Biol. 2014;15(12):550. doi:10.1186/s13059-014-0550-8
24. R Core Team. R: A Language and Environment for Statistical Computing. Vienna, Austria: R Foundation for Statistical Computing; 2021.
25. Ge SX, Jung D, Yao R. ShinyGO: a graphical gene-set enrichment tool for animals and plants. Bioinformatics. 2020;36(8):2628–2629. doi:10.1093/bioinformatics/btz931
26. Kramer A, Green J, Pollard J, et al. Causal analysis approaches in ingenuity pathway analysis. Bioinformatics. 2014;30(4):523–530. doi:10.1093/bioinformatics/btt703
27. Finn RS, Qin S, Ikeda M, et al. Atezolizumab plus bevacizumab in unresectable hepatocellular carcinoma. N Engl J Med. 2020;382(20):1894–1905. doi:10.1056/NEJMoa1915745
28. Abou-Alfa GK, Chan SL, Furuse J, et al. A randomized, multicenter phase 3 study of durvalumab (D) and tremelimumab (T) as first-line treatment in patients with unresectable hepatocellular carcinoma (HCC): HIMALAYA study. J Clin Oncol. 2018;36(15_suppl):TPS4144–TPS4144. doi:10.1200/JCO.2018.36.15_suppl.TPS4144
29. National Cancer Institute, D.o.C.T.a.D., DTP. Methodology; 2015. Available from: https://dtp.cancer.gov/databases_tools/docs/compare/compare_methodology.htm.
30. Larsson P, Engqvist H, Biermann J, et al. Optimization of cell viability assays to improve replicability and reproducibility of cancer drug sensitivity screens. Sci Rep. 2020;10(1):5798. doi:10.1038/s41598-020-62848-5
31. Broutier L, Mastrogiovanni G, Verstegen MM, et al. Human primary liver cancer-derived organoid cultures for disease modeling and drug screening. Nat Med. 2017;23(12):1424–1435. doi:10.1038/nm.4438
32. Bangaru S, Marrero JA, Singal AG. Review article: new therapeutic interventions for advanced hepatocellular carcinoma. Aliment Pharmacol Ther. 2020;51(1):78–89. doi:10.1111/apt.15573
33. Reiter FP, Ben Khaled N, Ye L, et al. Advances in pharmacotherapy of hepatocellular carcinoma: a state of the art review. Dig Dis. 2021. doi:10.1159/000520095
34. Gan G, Shi Z, Shangguan C, et al. The kynurenine derivative 3-HAA sensitizes hepatocellular carcinoma to sorafenib by upregulating phosphatases. Theranostics. 2021;11(12):6006–6018. doi:10.7150/thno.59841
35. Zhang H, Kong Q, Wang J, et al. Complex roles of cAMP-PKA-CREB signaling in cancer. Exp Hematol Oncol. 2020;9(1):32. doi:10.1186/s40164-020-00191-1
36. Liu YP, Pan LL, Kong CC. Stathmin 1 promotes the progression of liver cancer through interacting with YAP1. Eur Rev Med Pharmacol Sci. 2020;24(13):7335–7344. doi:10.26355/eurrev_202007_21900
37. Wang SJ, Yang PM. A bioinformatics analysis identifies the telomerase inhibitor MST-312 for treating high-STMN1-expressing hepatocellular carcinoma. J Pers Med. 2021;11(5):332. doi:10.3390/jpm11050332
38. Collingridge GL, Peineau S, Howland JG, et al. Long-term depression in the CNS. Nat Rev Neurosci. 2010;11(7):459–473. doi:10.1038/nrn2867
39. Qian Y, Daza J, Itzel T, et al. Prognostic cancer gene expression signatures: current status and challenges. Cells. 2021;10(3):648. doi:10.3390/cells10030648
40. Aden DP, Fogel A, Plotkin S, et al. Controlled synthesis of HBsAg in a differentiated human liver carcinoma-derived cell line. Nature. 1979;282(5739):615–616. doi:10.1038/282615a0
41. Dor I, Namba M, Sato J. Establishment and some biological characteristics of human hepatoma cell lines. Gan. 1975;66(4):385–392.
42. Huh N, Utakoji T. Production of HBs-antigen by two new human hepatoma cell lines and its enhancement by dexamethasone. Gan. 1981;72(1):178–179.
43. Nakabayashi H, Taketa K, Miyano K, et al. Growth of human hepatoma cells lines with differentiated functions in chemically defined medium. Cancer Res. 1982;42(9):3858–3863.
44. Alexander JJ, Bey EM, Geddes EW, et al. Establishment of a continuously growing cell line from primary carcinoma of the liver. S Afr Med J. 1976;50(54):2124–2128.
45. Park JG, Lee J-H, Kang M-S, et al. Characterization of cell lines established from human hepatocellular carcinoma. Int J Cancer. 1995;62(3):276–282. doi:10.1002/ijc.2910620308
46. Hirschfield H, Bian CB, Higashi T, et al. In vitro modeling of hepatocellular carcinoma molecular subtypes for anti-cancer drug assessment. Exp Mol Med. 2018;50(1):e419. doi:10.1038/emm.2017.164
 © 2022 The Author(s). This work is published and licensed by Dove Medical Press Limited. The
full terms of this license are available at https://www.dovepress.com/terms
and incorporate the Creative Commons Attribution
- Non Commercial (unported, 3.0) License.
By accessing the work you hereby accept the Terms. Non-commercial uses of the work are permitted
without any further permission from Dove Medical Press Limited, provided the work is properly
attributed. For permission for commercial use of this work, please see paragraphs 4.2 and 5 of our Terms.
© 2022 The Author(s). This work is published and licensed by Dove Medical Press Limited. The
full terms of this license are available at https://www.dovepress.com/terms
and incorporate the Creative Commons Attribution
- Non Commercial (unported, 3.0) License.
By accessing the work you hereby accept the Terms. Non-commercial uses of the work are permitted
without any further permission from Dove Medical Press Limited, provided the work is properly
attributed. For permission for commercial use of this work, please see paragraphs 4.2 and 5 of our Terms.