")
Back to Journals » ClinicoEconomics and Outcomes Research » Volume 16
Comparative Costs to Medicare and Medicare Beneficiaries of Alternative AF Stroke Risk Reduction Strategies
Authors Reddy VY, Zhong Y, McGovern AM , Amorosi SL, Gavaghan MB, Hertz DS, Low K , Freeman S, Holmes DR Jr
Received 16 September 2023
Accepted for publication 28 November 2023
Published 14 February 2024 Volume 2024:16 Pages 81—96
DOI https://doi.org/10.2147/CEOR.S440556
Checked for plagiarism Yes
Review by Single anonymous peer review
Peer reviewer comments 2
Editor who approved publication: Professor Giorgio Colombo
Vivek Y Reddy,1 Yue Zhong,2 Alysha M McGovern,2 Stacey L Amorosi,2 Meghan B Gavaghan,3 Deanna S Hertz,3 Kaywei Low,3 Scott Freeman,3 David R Holmes Jr4
1Icahn School of Medicine at Mount Sinai, New York, NY, USA; 2Health Economics and Market Access, Boston Scientific, Marlborough, MA, USA; 3Ipsos Healthcare, New York, NY, USA; 4Mayo Clinic, Rochester, MN, USA
Correspondence: Vivek Y Reddy, Icahn School of Medicine at Mount Sinai, One Gustave L. Levy Place Box 1030, New York, NY, 10029, USA, Tel +1 212 241-7114, Fax +1 646 537-9691, Email [email protected]
Background: As healthcare costs are increasingly being shifted from payers to patients, it is important to understand the economic consequences of therapeutic strategies to both payers and patients.
Objective: To determine the relative costs to Medicare and Medicare beneficiaries (patients) of warfarin, non-vitamin K oral anticoagulants (NOACs), and left atrial appendage closure (LAAC) for stroke risk reduction in nonvalvular atrial fibrillation.
Methods: An economic model was developed to assess costs at 5 and 10 years. For warfarin and NOACs, inputs were derived from published meta-analyses; for LAAC with the Watchman device, inputs were derived from pooled 5-year PROTECT AF and PREVAIL trial results. The model captured therapy costs vs clinical event costs, including procedural complications and follow-up clinical outcomes. Costs were based on 2023 Medicare reimbursement and copayment rates.
Results: At 10 years, overall LAAC costs ($48,337) were lower than those of NOACs ($81,198) and warfarin ($52,359). Overall LAAC costs were lower than those of NOACs by year 5 and warfarin by year 9. At 5 years, patient LAAC costs were lowest at $4,764, compared to $7,146 and $6,453 for NOACs and warfarin, respectively. LAAC patient costs were lower than those of NOACs by year 3 and warfarin by year 4. Clinical events comprised 96% of overall warfarin costs vs 48% for LAAC and 40% for NOACs.
Conclusion: LAAC yielded the lowest overall and patient costs. Warfarin costs were largely driven by clinical events, which may represent an unplanned financial burden for patients. These considerations should be incorporated into shared decision-making discussions about stroke prophylaxis strategies.
Keywords: economic analysis, medicare, patient, warfarin, NOACs, watchman
Introduction
Approximately 2.7 to 6.1 million adults in the United States have atrial fibrillation (AF), a number expected to at least double by 2030.1–3 AF increases stroke risk, particularly in elderly patients. The prevalence of AF is increasing at a rate of 5% each year in the Medicare population, and the estimated annual stroke rate is over 2% among Medicare beneficiaries with AF.4,5 Treating AF patients costs the US healthcare system about $26 billion annually, and AF-related strokes account for nearly half of Medicare spending for AF.6,7
Stroke risk reduction in AF can be achieved with oral anticoagulants (OACs) such as warfarin and non-vitamin K oral anticoagulants (NOACs).8–12 However, OACs are associated with increased bleeding risk and substantial patient non-adherence rates, which may lead to stroke.13 The 2019 AHA/ACC/HRS AF guidelines recommended percutaneous left atrial appendage closure (LAAC) with the Watchman device as a nonpharmacological stroke prevention approach.14 Watchman is indicated for patients with non-valvular AF (NVAF) at increased risk for stroke and systemic embolism, suitable for short-term warfarin, but with an appropriate rationale to avoid lifelong anticoagulation.15 Studies have shown LAAC is non-inferior to warfarin for ischemic stroke risk reduction, and superior for hemorrhagic stroke risk reduction and disabling/fatal stroke, major bleeding, and all-cause mortality prevention.16–19
Most AF patients are over 65-years-old and thus eligible for Medicare.20 Although Medicare covers a wide range of healthcare services, patients still face significant financial burden (premiums, cost-sharing, and uncovered services), with no out-of-pocket limit. Patients may face even higher out-of-pocket costs for prescription drugs. In 2013, half of all Medicare patients spent at least 14% of their total income on out-of-pocket healthcare costs.21 Stroke patients have reported even higher cost burdens, equivalent to 22% of their total income.22 Thus, as costs are shifted from payers to patients, patients should be informed of the out-of-pocket cost implications of their treatment regimens.
Previous research demonstrated both NOACs and LAAC were cost-effective relative to warfarin, and LAAC was cost-effective relative to NOACs.23,24 To further assist payers, physicians, and patients in shared decision-making, this study evaluated the relative costs of warfarin, NOACs, and LAAC for stroke risk reduction in NVAF using published meta-analyses for (N)OACs and pooled 5-year data from the PROTECT AF and PREVAIL clinical trials for LAAC.16–18
Materials and Methods
An economic model was developed to assess the costs of adjusted-dose warfarin, NOACs as a class, and LAAC with Watchman. The model was constructed in Microsoft Excel (Microsoft, Redmond, WA) using 1-year cycles to investigate the costs to Medicare and patients at 5 and 10 years.
Population
The model assumed patients to be 70-years-old with NVAF, a CHA2DS2-VASc score of 4.0 (annual stroke risk of 4.8%), and a modified HAS-BLED score of 1.98 (annual bleeding risk of 1.88%).16–18
Model Structure and Clinical Pathways
Patients were assigned to either warfarin, NOACs, or LAAC (Figure 1). In total, 92.5% of LAAC patients experienced a successful procedure.15 LAAC patients faced one-time procedure-related risks of ischemic stroke resulting from air embolism (0.82%), major bleeding (0.55%), pericardial effusion (3.69%), device embolization (0.68%) and device-related thrombus (DRT; 3.80%). Successfully implanted patients were assumed to receive warfarin for 45 days, aspirin plus clopidogrel from 46 days to 6 months, and aspirin thereafter.16,17 Non-successful patients were assumed to continue warfarin therapy and incurred the costs of the procedure and continued medication. Patients receiving warfarin or NOACs could discontinue therapy for a bleeding event or for non-clinical reasons. Patients discontinuing primary drug therapy were assumed to switch to aspirin.9–11,25–28 Those discontinuing aspirin therapy received no therapy.
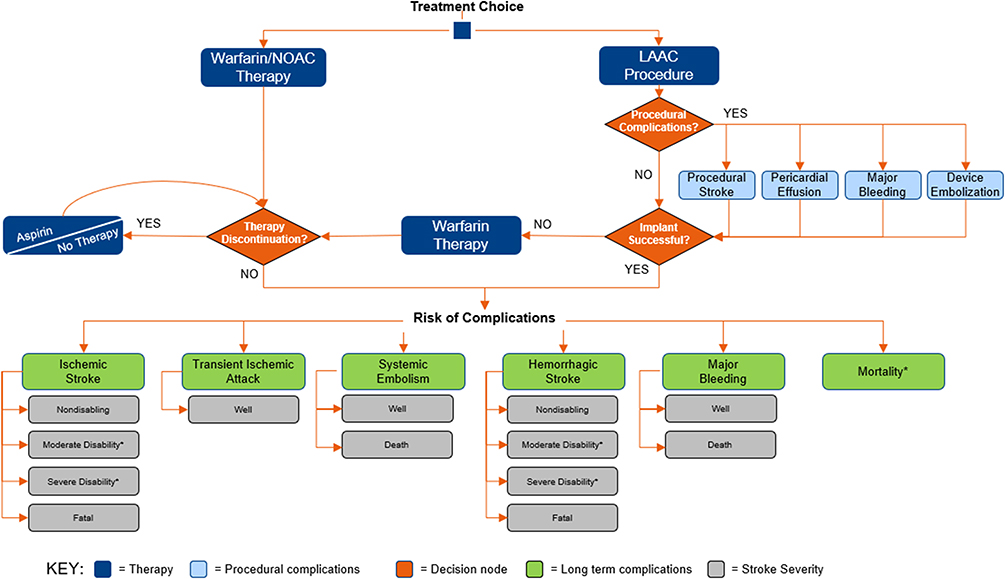 |
Figure 1 Model Schematic Depicting Warfarin, NOAC, and LAAC Patient Pathways. Patients enter the model one at a time and are assigned to a treatment pathway with the associated risk of therapy discontinuation or procedural complications. Patients are exposed to the risks of complications for the duration of the model time horizon. *All patients are at risk of death except for patients with transient ischemic attack. However, patients with moderately or severely disabling stroke are at an increased risk of death. Abbreviations: LAAC, left atrial appendage closure; NOAC, non-vitamin K oral anticoagulant. |
All patients were assumed to be well, or in normal good health, upon entering the model. At the end of each cycle, individuals could transition from well to ischemic stroke, transient ischemic attack (TIA), systemic embolism, hemorrhagic stroke, major bleeding, or death. Stroke outcomes were classified as: nondisabling, moderately disabling, severely disabling, or fatal. All events, except TIA and DRT, could lead to death.
Clinical Inputs and Stroke Outcomes
Clinical inputs were from several sources (Table 1). For warfarin and NOACs, the adverse event risks were derived from meta-analyses, AF stroke prevention clinical studies, and a health economic analysis.9,11,29–32 Two clinical scenario analyses were also conducted to assess the impact of varying warfarin and NOAC clinical event rates to consider outcomes reported by alternative sources. In the first scenario, a higher warfarin and NOAC major bleeding rate, reflecting pooled outcomes of four randomised trials, was explored (Scenario 1).33 In the second scenario, a higher proportion of non-disabling warfarin stroke outcomes, as determined by the PREVAIL and PROTECT AF trials, was evaluated (Scenario 2).18 Clinical inputs used in these scenario analyses are displayed in Table 1 and Table 2, respectively.
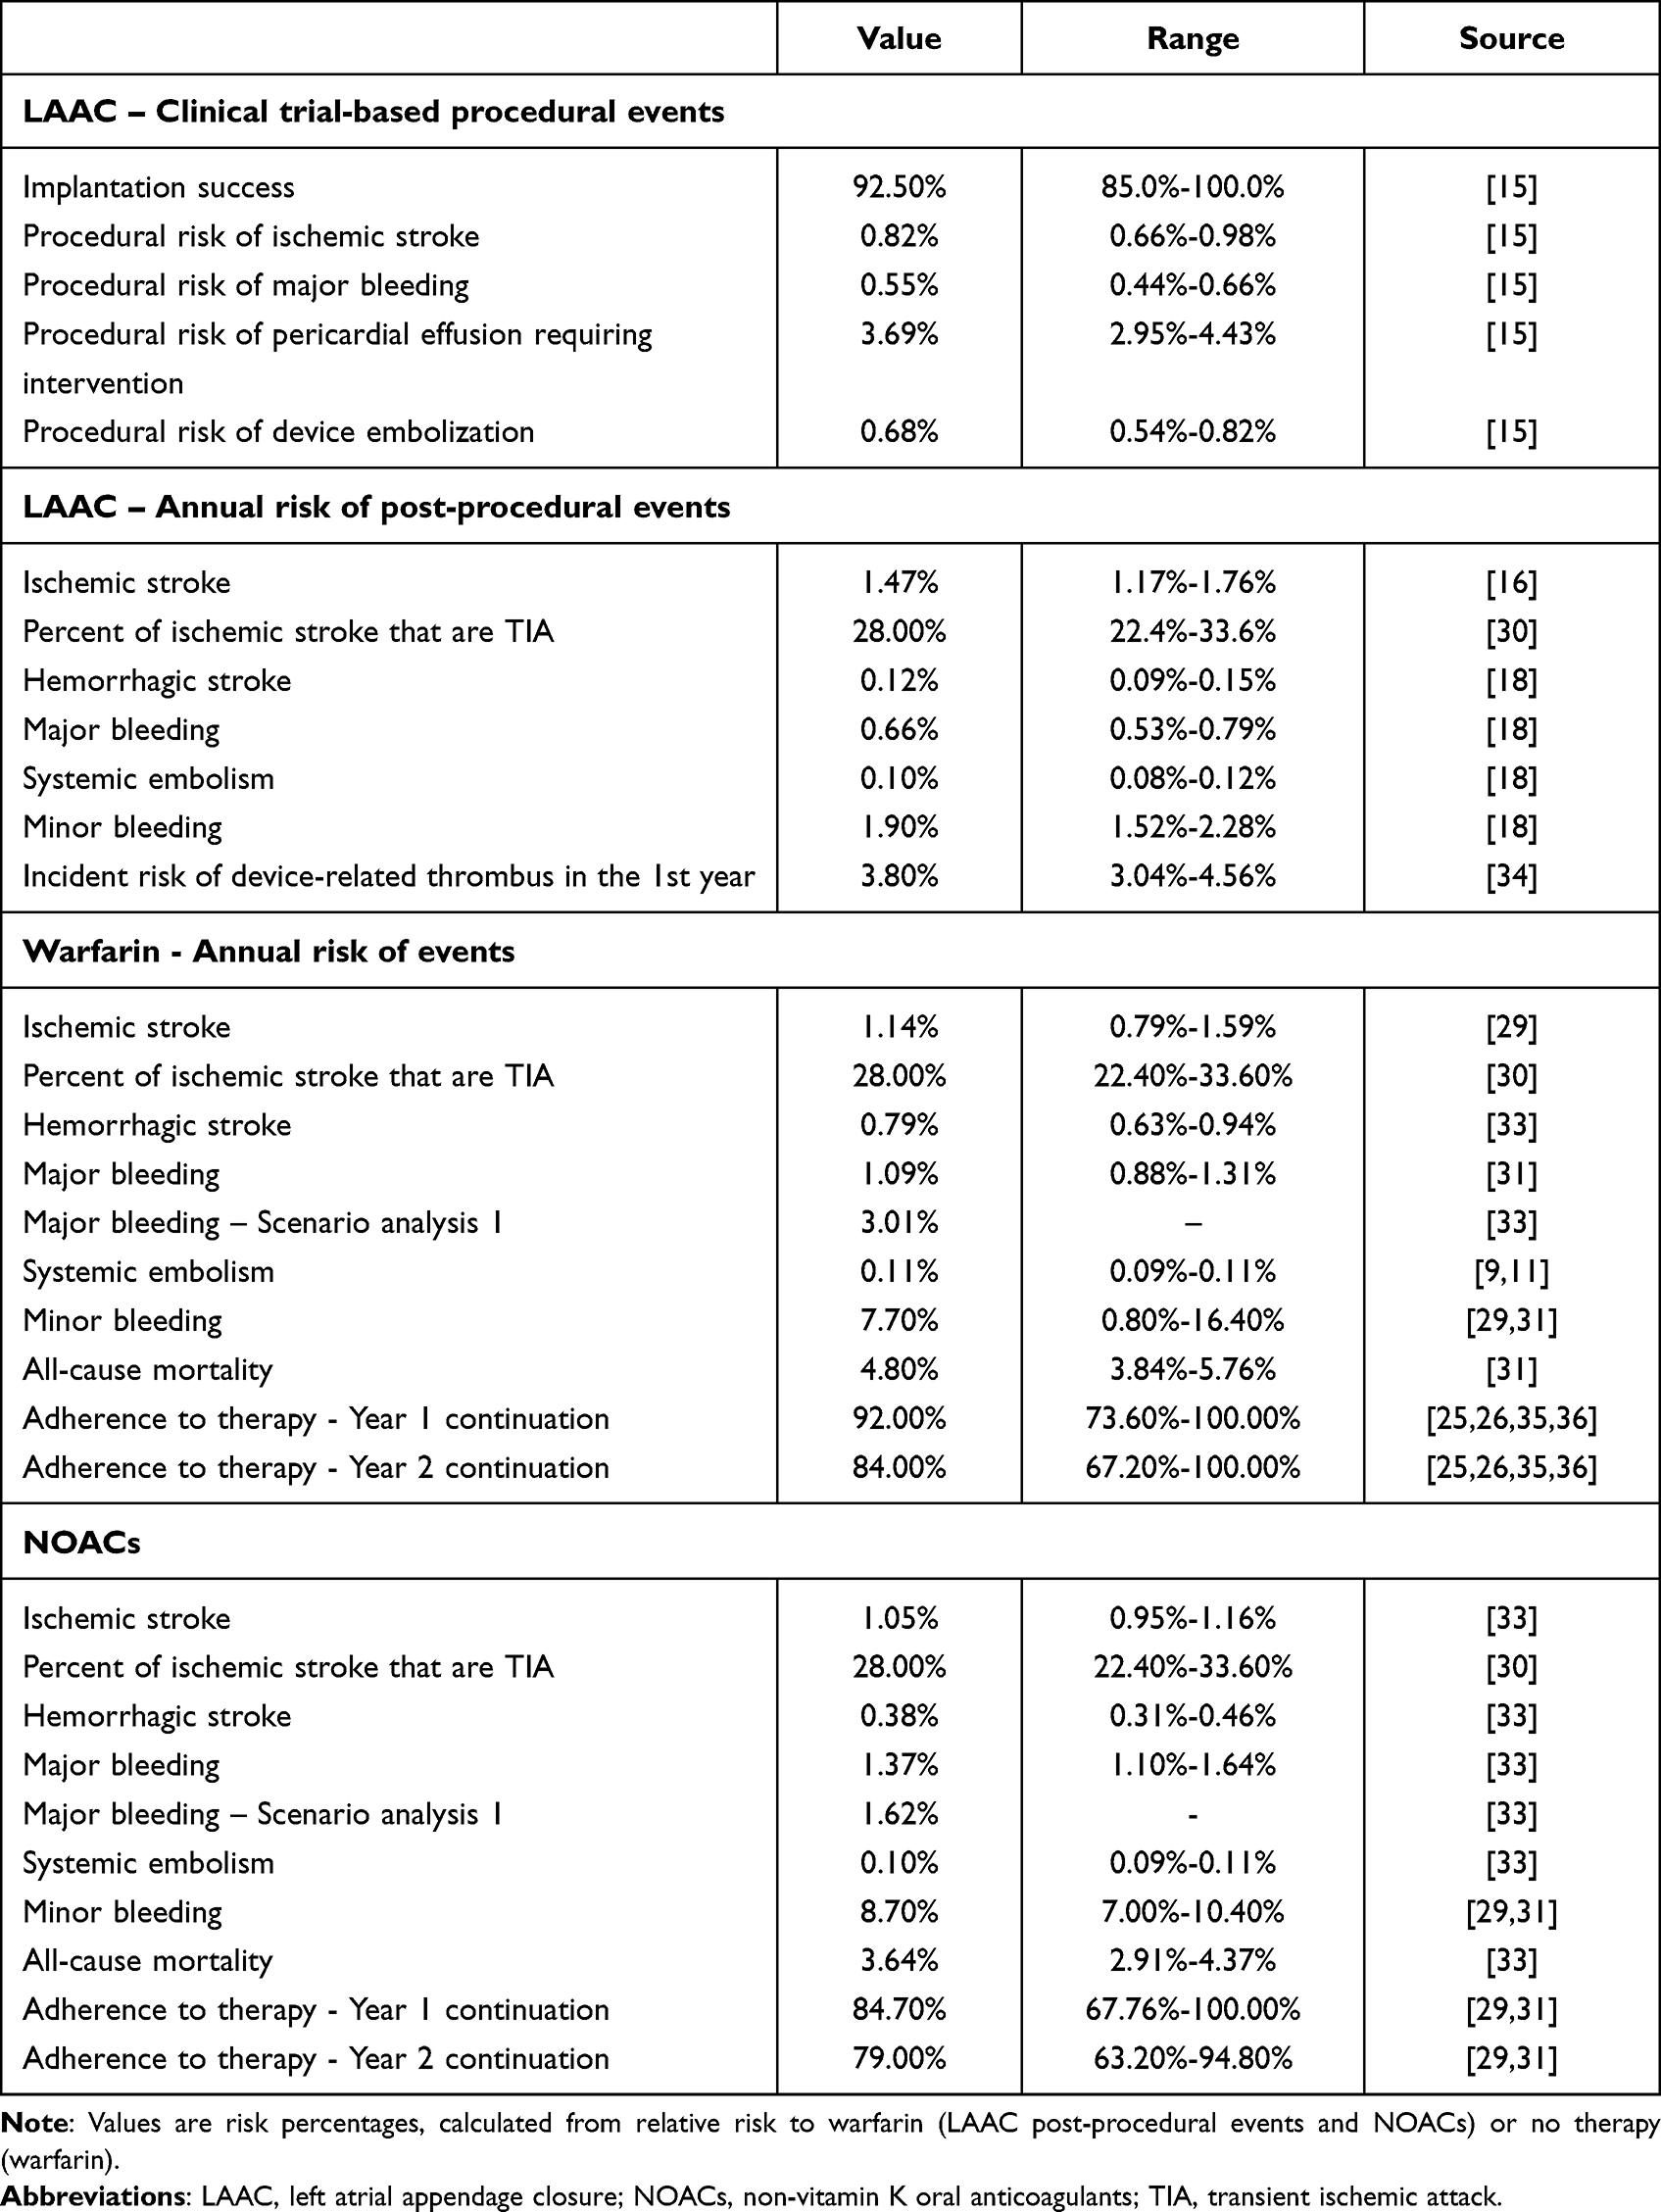 |
Table 1 Clinical Inputs Derived from Meta-Analyses and Pivotal Trials |
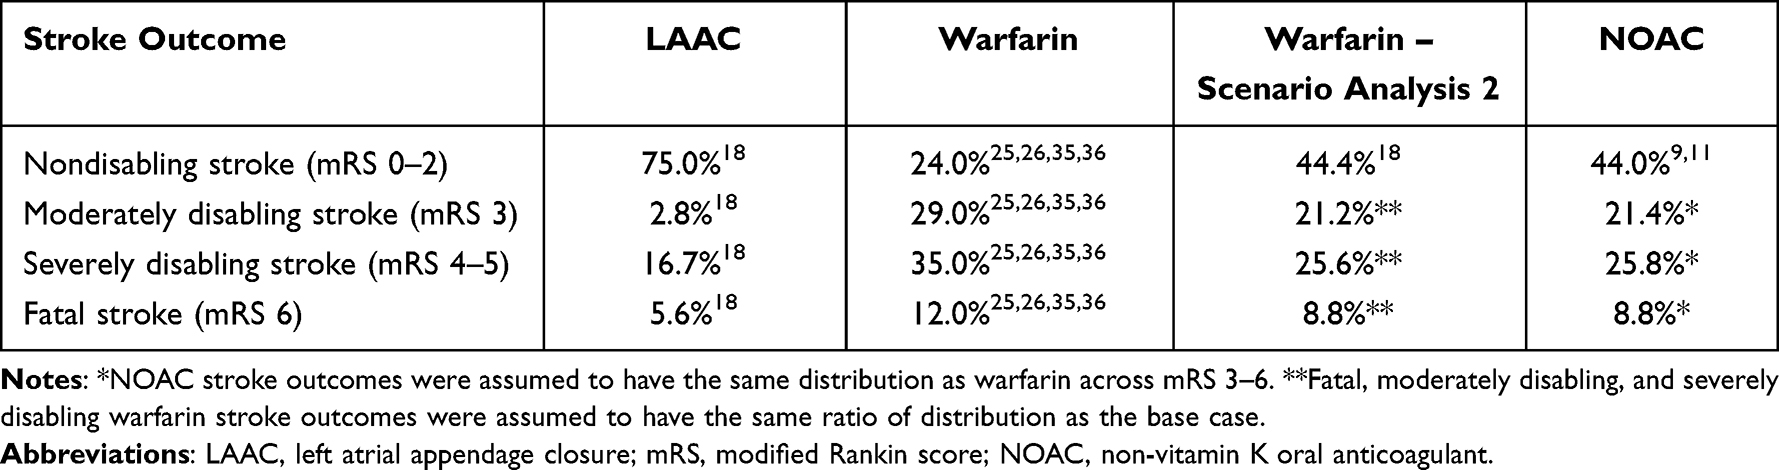 |
Table 2 Stroke Outcomes by Severity |
For LAAC, procedural complications and post-procedural event probabilities were from pooled PROTECT AF and PREVAIL trials at 5-year follow-up. The risk of DRT following LAAC was derived from a meta-analysis of randomised and observational studies.34 Relative risks of stroke and bleeding were used to apply a standard efficacy estimate to the derived baseline risks.18
The baseline stroke risk was estimated based on CHA2DS2-VASc scores, converted from the CHADS2 scores prospectively collected during PROTECT AF and PREVAIL.16,17 The baseline bleeding risk was calculated as a weighted mean of modified HAS-BLED scores from PROTECT AF and PREVAIL. Table 2 displays stroke outcomes and resulting disability.
Stroke outcomes were assigned using the modified Rankin score (mRS). Four trials were used to calculate a weighted average of warfarin stroke outcomes.25,26,35,36 For NOACs, the nondisabling stroke rate was taken from two of the four pivotal trials.9,11 Since only nondisabling stroke was reported in the NOAC trials, disabling and fatal strokes were inversely calculated and the distribution of moderately disabling, severely disabling, and fatal strokes were assumed to be the same as for warfarin. LAAC stroke outcomes were derived from pooled PROTECT AF and PREVAIL 5-year data.18
Cost Inputs
Costs were evaluated from the Medicare and Medicare beneficiary (patient) perspectives. The model captured the costs of therapy and associated events, including procedural complications and follow-up strokes and bleeds. Stroke costs included acute care and long-term disability; depending on stroke severity, patients could receive either inpatient or outpatient post-acute rehabilitation.37–40 A NOAC cost scenario analysis was conducted to assess the impact on Medicare and patient outcomes if a NOAC generic alternative were to become available (Scenario 3). Table 3 summarizes the sources used to derive costs. All costs were in 2023 US dollars.
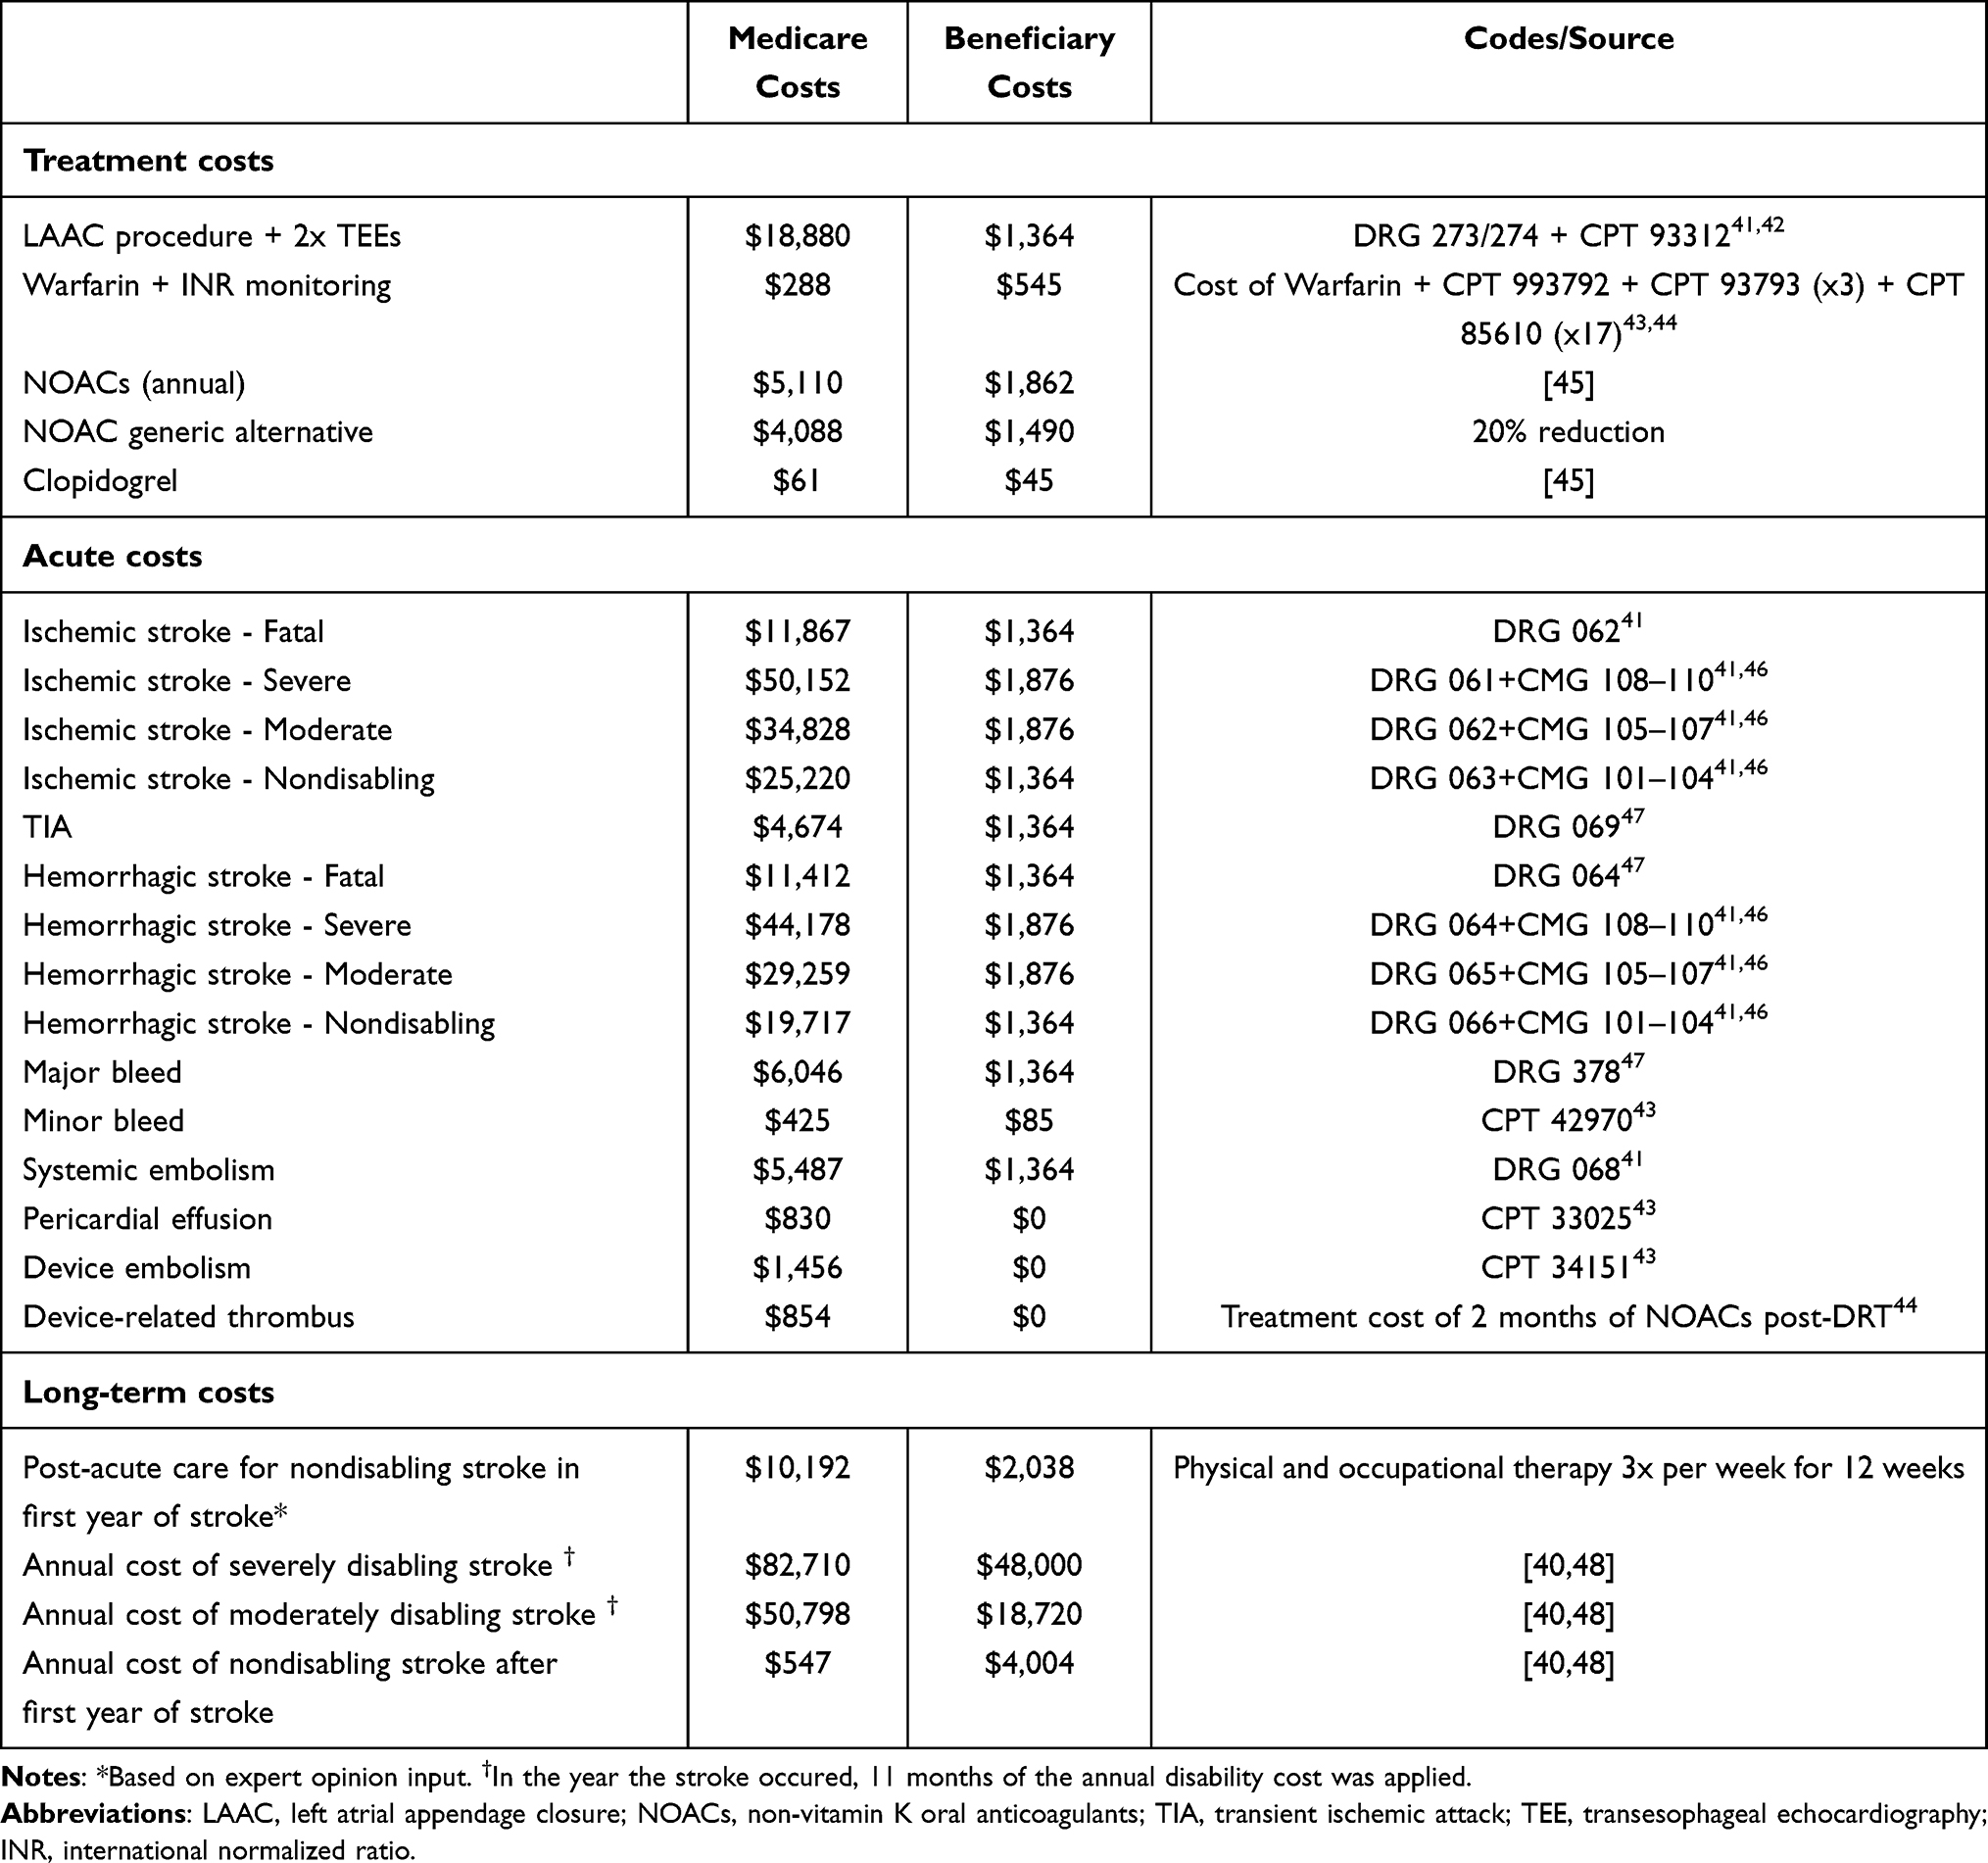 |
Table 3 Cost Inputs |
Medicare Costs
Medicare costs were based on 2023 US diagnosis-related group (DRG) reimbursement rates for acute admissions, case mix group (CMG) values for inpatient rehabilitation costs following a stroke, and current procedural terminology (CPT) reimbursement rates for outpatient service costs.41,42,46,47 Medicaid was assumed to be the primary payer of long-term stroke disability costs.49 The LAAC procedure cost was calculated as a weighted average of two DRGs for percutaneous intracardiac procedures (273 and 274), plus two transesophageal echocardiograms (TEE). Warfarin costs were calculated from US pharmaceutical wholesale acquisition costs and reimbursement rates for CPT codes related to international normalized ratio (INR) monitoring.43,44 NOAC costs were calculated as an average of US wholesale acquisition costs for four approved drugs: dabigatran (150mg), rivaroxaban, apixaban, and edoxaban.44 For the NOAC cost scenario analysis, a 20% Medicare cost reduction was assumed if a NOAC generic alternative were to become available (Scenario 3).45
Patient Costs
Patient costs were derived from 2023 Medicare deductibles and coinsurance rates.42 A $1,600 deductible was assumed for inpatient admissions. For moderate or severe strokes, the model assumed a deductible plus a $200 per day copayment for three days in a skilled nursing facility. A 20% coinsurance was assumed for outpatient services. As out-of-pocket drug costs vary geographically, average costs from the four states with the largest percentage of Medicare beneficiaries (CA, FL, NY, PA) were used. Annual long-term costs of severe and moderate strokes were based on a national provider survey.40 For the NOAC cost scenario analysis, the same 20% reduction was applied to patient costs if NOACs became generic.
Sensitivity Analysis
One-way sensitivity analyses were performed to assess the impact of parameter uncertainty on model results and to examine model robustness. Clinical inputs were varied within 95% confidence intervals (CIs), where available, and by ±20% where CIs were not published. Stroke outcomes and cost inputs were varied by ±20%.
Results
Medicare Cost Outcomes
In the early years following implantation, LAAC was more costly to Medicare than warfarin and NOACs, as expected due to the upfront procedure cost (Figure 2). LAAC per-patient costs were 11% higher compared to warfarin at 10 years ($38,869 vs $34,937) (Figure 3). Warfarin costs were driven by higher expenditures on clinical events (95% of Medicare costs) while LAAC costs were driven by higher upfront procedure costs (60% of Medicare costs). LAAC became less costly to Medicare than NOACs at year 5, with total savings of $25,807 per patient at year 10. NOACs were 85% more costly to Medicare than warfarin at 10 years ($64,676 vs $34,937). The higher costs of NOACs were due primarily to therapy costs (66% of Medicare costs).
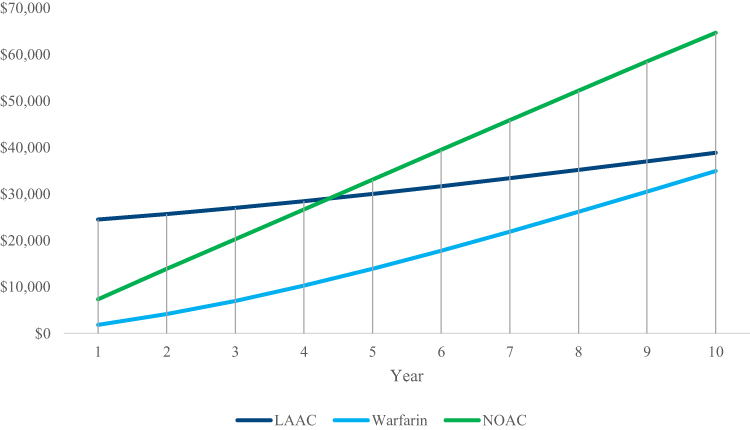 |
Figure 2 Cumulative Per-Patient Medicare Costs. Shown are cumulative 10-year per-patient costs to Medicare. Warfarin costs were lower than NOAC costs throughout. LAAC costs were lower than NOAC costs by year 5 and warfarin costs by year 12. Abbreviations: LAAC, left atrial appendage closure; NOAC, non-vitamin K oral anticoagulant. |
 |
Figure 3 Average Medicare Costs at 10 Years. Shown are Medicare costs per patient at 10 years, sub-divided by therapy and clinical event costs. LAAC and warfarin costs were similar, and both were lower than the cost of NOACs ($25,807 and $29,739 savings, respectively). Clinical event costs comprised 95% of warfarin costs versus 40% for LAAC and 34% for NOACs. Abbreviations: LAAC, left atrial appendage closure; NOAC, non-vitamin K oral anticoagulant. |
Patient Cost Outcomes
From the patient perspective, LAAC costs were lower than warfarin costs in year 4 and NOAC costs in year 3 (Figure 4). At year 5, LAAC costs ($4,764) were 33% lower than NOAC costs and 26% lower than warfarin costs, making LAAC the least costly therapy option (Figure 5). Total out-of-pocket costs for warfarin patients were $17,423 at year 10, making warfarin the costliest therapy option to patients, compared to LAAC ($9,468) and NOACs ($16,522). Cumulative clinical event expenditures incurred by patients at year 10 were the highest with warfarin ($16,835; 97% of patient costs), compared to NOACs ($10,482; 63% of patient costs) and LAAC ($7,700; 81% of patient costs) (Table 4).
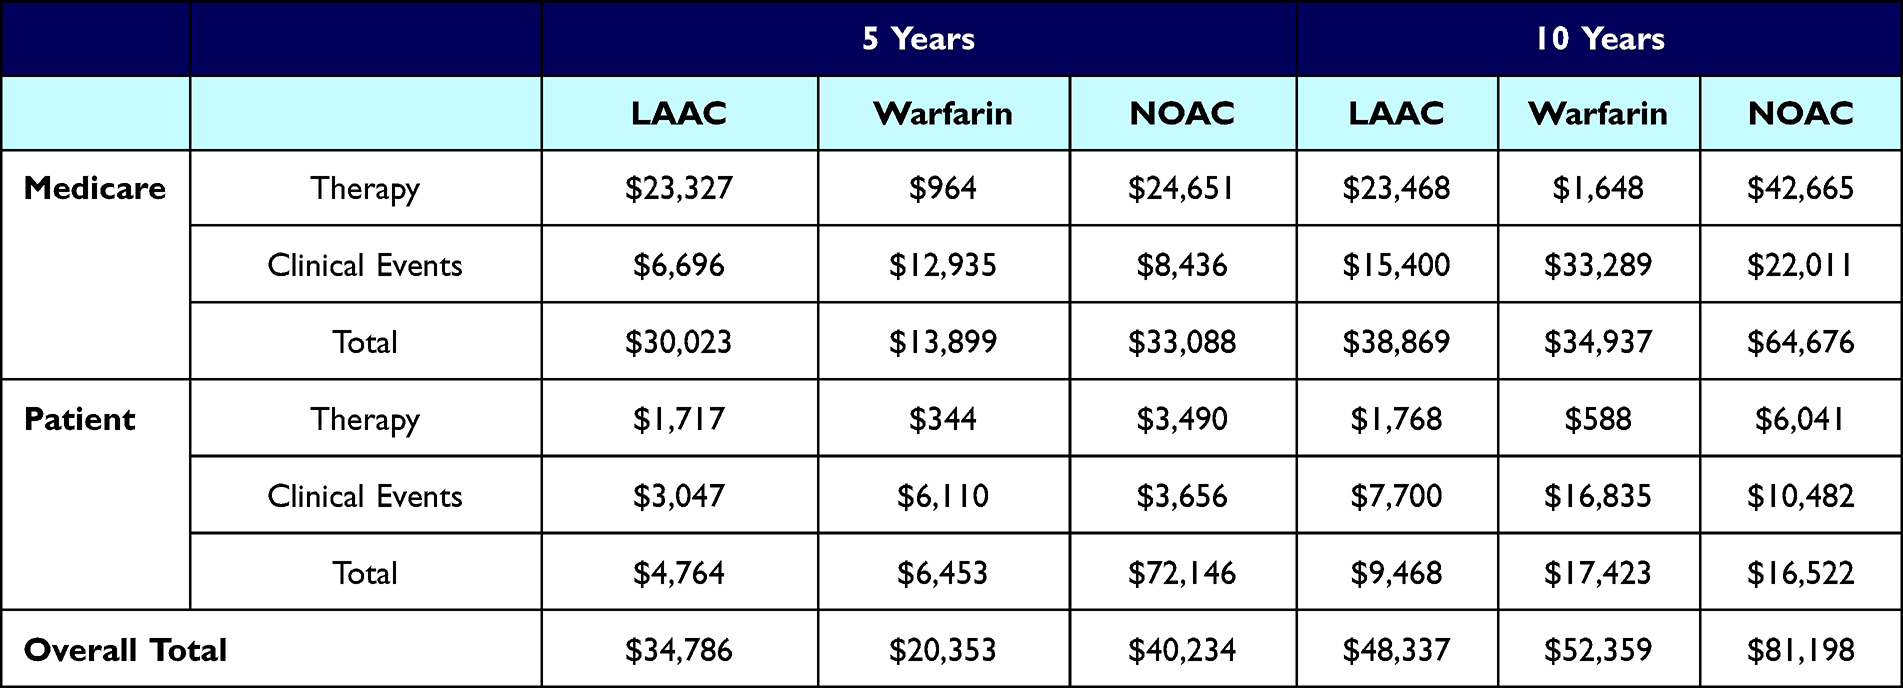 |
Table 4 Cumulative Total and Sub-Divided Costs at 5 and 10 Years |
 |
Figure 4 Cumulative Per-Patient Out-of-Pocket Costs. Shown are cumulative 10-year per-patient costs. At 10 years, cumulative warfarin patient costs were higher than LAAC and NOAC patient costs. LAAC patient costs were lower than those of NOACs by year 3 and warfarin by year 4. Abbreviations: LAAC, left atrial appendage closure; NOAC, non-vitamin K oral anticoagulant. |
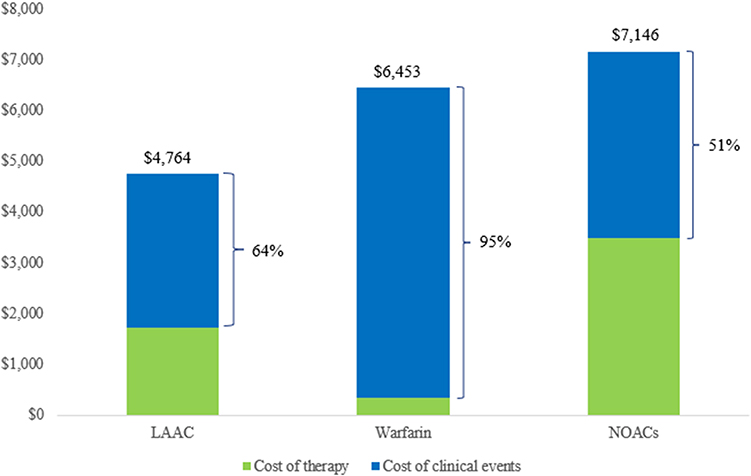 |
Figure 5 Average Patient Out-of-Pocket Costs at 5 Years. Shown are average patient costs at 5 years, sub-divided by therapy and clinical event costs. LAAC patient costs were 33% lower ($2,382 savings) than those of NOACs and 26% lower ($1,689 savings) than those of warfarin. Clinical event costs comprised 95% of overall warfarin costs versus 64% and 51% of overall LAAC and NOAC costs, respectively. Abbreviations: LAAC, left atrial appendage closure; NOAC, non-vitamin K oral anticoagulant. |
Overall (Medicare + Patient) Cost Outcomes
For overall (Medicare + patient) costs, LAAC was less costly than NOACs by year 5 and warfarin by year 9 (Figure 6). At 10 years, LAAC was the least costly treatment overall ($48,337), with costs being 8% lower than warfarin costs (savings of $4,022) and 40% lower than NOAC costs (savings of $32,861) (Table 4). Clinical events comprised 96% ($50,124) of overall warfarin costs versus 40% ($32,493) of NOAC costs and 48% ($23,100) of LAAC costs (Table 4, Figure 7). At 10 years, the overall clinical event expenditure as a result of severe disability due to stroke was the highest with warfarin ($30,884), compared to LAAC ($16,759) and NOACs ($18,787) (Figure 7).
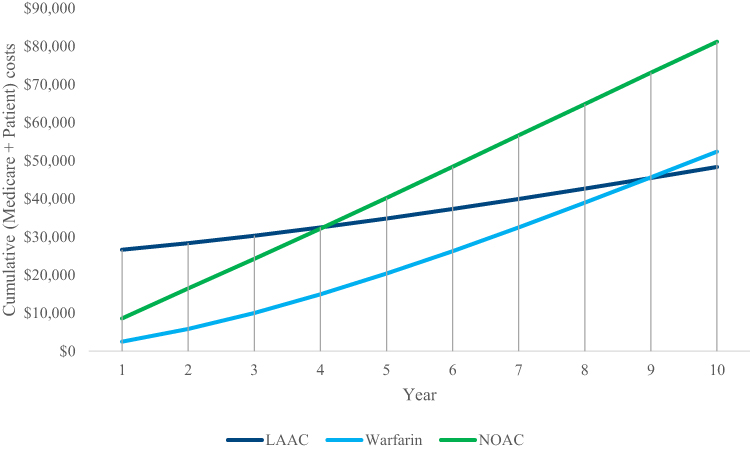 |
Figure 6 Cumulative Overall (Medicare + Patient) Costs. Shown are the cumulative total (Medicare + patient) per patient costs over 10 years. LAAC becomes less costly than NOACs by year 5 and warfarin by year 9. Abbreviations: LAAC, left atrial appendage closure; NOAC, non-vitamin K oral anticoagulant. |
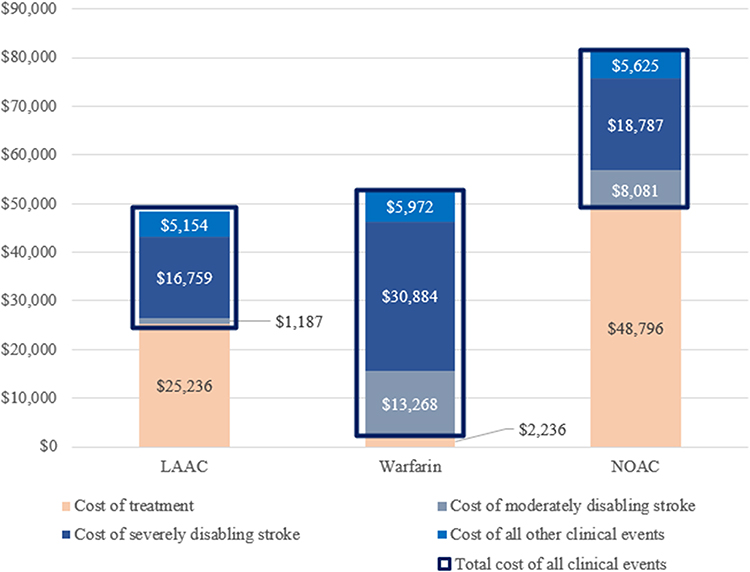 |
Figure 7 Cumulative Overall (Medicare + Patient) Costs Attributed to Treatment and Event Costs. Shown are overall average costs at 10 years disaggregated by clinical event expenditures and treatment costs. LAAC has the lowest amount of clinical event expenditure, while warfarin has the highest clinical event costs, of which 62% ($30,884) was driven by severely disabling strokes. Abbreviations: LAAC, left atrial appendage closure; NOAC, non-vitamin K oral anticoagulant. |
Scenario Analysis Results
Clinical and cost inputs were varied in three scenario analyses. Scenario 1 explored the impact of higher major bleeding rates for warfarin and NOACs. This resulted in an increase in Medicare and patient costs by 2.7% and 1.4% for warfarin, and 0.2% and 0.2% for NOACs, respectively (Figure 8). Overall (Medicare + patient), warfarin and NOAC costs increased by 2.3% and 0.2%, respectively. The increase was driven by higher clinical event costs as a result of increased major bleeding event rates.
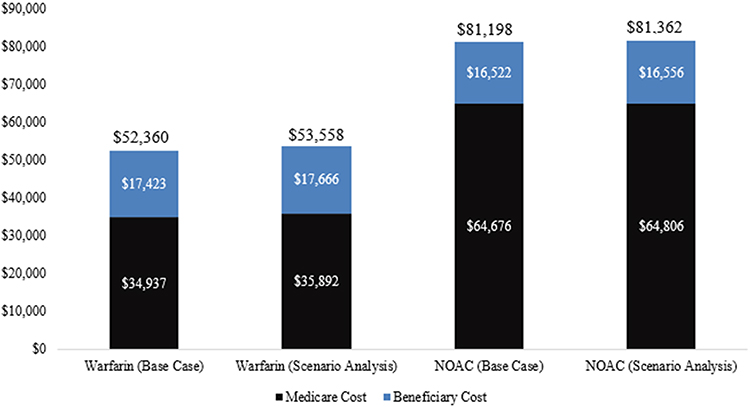 |
Figure 8 Scenario 1 – Scenario Analysis Exploring Increased Rates of Major Bleeding for Warfarin and NOACs. Shown are warfarin and NOAC Medicare and patient costs at 10 years in the base case compared to the scenario analysis. Warfarin Medicare and patient costs are increased by 2.7% and 1.4%, respectively. NOAC Medicare and patient costs are increased by 0.2% and 0.2%, respectively. Abbreviation: NOAC, non-vitamin K oral anticoagulant. |
In Scenario 2, the rate of non-disabling warfarin stroke outcomes was increased, while the rates of fatal, severely disabling, and moderately disabling warfarin stroke outcomes decreased accordingly. The higher proportion of non-disabling warfarin stroke outcomes resulted in a 23% and 25% reduction in warfarin costs incurred by Medicare and patients, respectively (Figure 9) Warfarin costs incurred by Medicare continued to be driven by higher expenditures on clinical events, although to a lower extent compared to the base case (94% vs 95%).
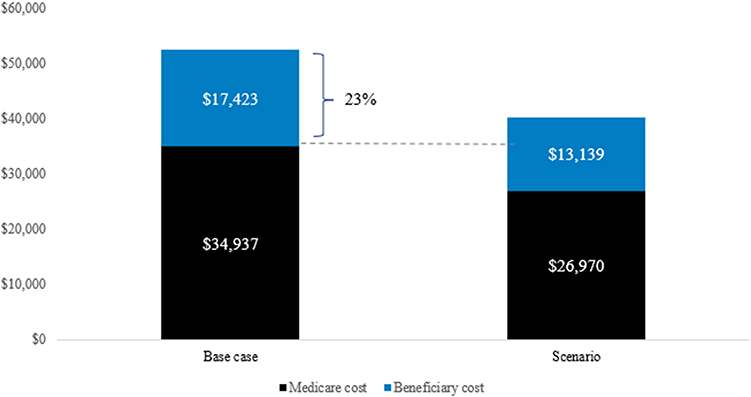 |
Figure 9 Scenario 2 – Scenario Analysis Exploring a Higher Rate of Non-Disabling Stroke for Warfarin. Shown are warfarin Medicare and patient costs in the base case compared to the scenario analysis. Medicare costs are reduced by 23% and patient costs are reduced by 25% in the scenario analysis. |
In Scenario 3, a generic alternative scenario was explored for NOACs where costs were assumed to decrease by 20%. At year 10, NOACs remained the costliest therapy to Medicare ($56,143). NOAC patient costs ($15,314) remained lower than those of warfarin and higher than those of LAAC. Overall (Medicare + patient), NOAC costs ($71,457) remained higher than those of warfarin and LAAC at year 10, even when considering a reduced price if a generic alternative becomes available.
Sensitivity Analysis Results
Tornado diagrams were constructed from the one-way sensitivity analyses to illustrate the 15 most impactful variables in descending order of influence at 10 years (Figures S1–S3). For NOACs versus warfarin, Medicare costs were most sensitive to variations in daily NOAC treatment costs, patient 2-year persistence on NOACs, the annual ischemic stroke risk associated with warfarin, the percentage of strokes caused by warfarin that are severely disabling, and all-cause mortality associated with warfarin or NOACs (Figure S1A). Patient costs were most sensitive to variations in clinical events which include the percentage of strokes caused by warfarin that are severely disabling, the annual ischemic stroke risk associated with warfarin, all-cause mortality associated with warfarin, the percentage of strokes caused by NOACs that are severely disabling, and the annual risk of hemorrhagic strokes caused by warfarin (Figure S1B).
For LAAC versus warfarin, Medicare costs were most sensitive to variations in the annual ischemic stroke risk associated with warfarin, the LAAC procedure costs, the percentage of severely disabling strokes caused by warfarin, and all-cause mortality associated with warfarin (Figure S2A). Patient costs were most sensitive to variations in similar variables, except for the LAAC cost, which was included in the hospital copayment (Figure S2B). These variables were also impactful when comparing LAAC to NOACs, with the addition of NOAC costs and the percentage of strokes caused by NOACs that are severely disabling, which had the greatest impact on Medicare and patient costs (Figures S3A and B).
Discussion
This is the first study to assess the economic outcomes to both Medicare and patients of different stroke prophylaxis strategies in AF. Overall (Medicare + patient), LAAC was the least costly treatment at 10 years, compared to warfarin and NOACs. To Medicare, NOACs were the most costly at 10 years, followed by LAAC and warfarin. To patients, LAAC provided significant cost savings at 10 years relative to both warfarin and NOACs. Warfarin costs were primarily driven by clinical event costs (complications plus outcomes) for both Medicare and patients, while NOAC and LAAC costs were driven by therapy costs for Medicare and clinical event costs for patients.
Despite the relatively low cost of warfarin therapy, LAAC yielded lower patient costs by year 4 and lower overall (Medicare + patient) costs by year 9. Warfarin patients paid twice as much out-of-pocket compared to LAAC patients, driven primarily by higher clinical event expenditures. Compared with NOACs, LAAC became less costly overall and to Medicare in year 5, and to patients in year 3. Over 10 years, LAAC could lead to cumulative overall (Medicare + patient) cost savings of $4,022 and $32,861 per patient compared to warfarin and NOACs, respectively. LAAC was also associated with lower overall clinical event costs compared to warfarin and NOACs. One-way sensitivity analyses confirmed these results were robust across the acceptable range of inputs.
Alternative NOAC and warfarin clinical event rates were explored in two scenario analyses. In Scenario 1, higher warfarin and NOAC major bleeding event rates led to an increase in clinical event expenditures. In this scenario, LAAC led to cumulative overall (Medicare + patients) cost savings of $5,221 and $33,025 per patient compared to warfarin and NOACs, respectively. In Scenario 2, an increased non-disabling warfarin stroke rate was explored, which reduced clinical event expenditures accrued to Medicare and patients. In the final scenario analysis, despite considering generic pricing, NOACs remained the costliest therapy to Medicare and patients at year 10.
Despite protection from Medicare Advantage and supplemental plans, out-of-pocket medical costs consume a high proportion of patients’ income. Additionally, costs of unexpected clinical events likely present an unplanned financial burden to patients, posing an even greater challenge to individuals with low- or fixed-incomes. These costs could lead to access barriers, as patients with higher cost-sharing are more likely to forego needed care.50,51 Therefore, interventions that prevent unexpected medical services could reduce out-of-pocket spending and enable better access to care.
Long-term warfarin use may also affect patient quality of life. Previous studies have reported that warfarin impacts patient work, travel, and other leisure activities due to the amount of time spent on medication management, INR monitoring, routine doctor visits, and bleeding hospitalizations.52,53 These costs were not included in the model, which likely underestimates the cost of warfarin to patients. The burden on patients to manage and monitor their therapy can lead to poor treatment adherence, increasing the incidence and cost of complications.53
Although NOAC patients do not require regular INR monitoring, the issue of therapy adherence persists. As branded drugs in Medicare Part D plans, NOACs have higher cost-sharing than warfarin, and patients often pay a significant portion of therapy costs. Since AF patients typically require anticoagulation for the remainder of their lives, the annual drug cost may pose an economic burden.
Furthermore, a continued increase in NOAC use may present additional costs to Medicare. In 2014, between 8% and 14% of Medicare patients with AF were prescribed NOACs.54 This number has continued to increase over the years, posing budget challenges to Medicare.55 The findings from this study suggest that, over a 10-year time horizon, NOAC treatment may cost Medicare 85% to 66% more per patient versus either warfarin or LAAC, respectively. LAAC may provide an opportunity for savings to Medicare, relative to NOACs, as a one-time procedure with low long-term treatment costs (aspirin) following the procedure.18
As Medicare seeks to provide proper coverage and optimal healthcare access, they must consider not only overall therapy costs, but also the costs to patients – especially given its derivative effect on patient compliance with therapy. LAAC provides lifelong stroke risk reduction without the risk of negative consequences associated with patient non-adherence. Many patients with AF live beyond the 10-year timeframe of this study, and the savings overall are expected to continue to accrue over patients’ lifetimes. Furthermore, it should be noted that since this model did not account for the competing risk for mortality of elderly patients, the financial benefit of LAAC is likely underestimated. That is, older patients might die earlier, thereby attenuating the extent to which cost-effectiveness crosses over towards benefit from LAAC. Accordingly, our conclusions are conservative.
Study Limitations
Data from meta-analyses and clinical trials were used to project event rates and costs for warfarin, NOACs, and LAAC. However, in actual practice, clinical outcomes, treatment administration, patient adherence, and procedural complication rates may differ from those observed in a controlled trial setting. Generally, therapy adherence is substantially better in clinical trials than in the real world; thus, this analysis may be underestimating the costs associated with NOACs and warfarin therapy. Similarly, the model assumed patients to be 70-years-old with a CHA2DS2-VASc score of 4.0 and a modified HAS-BLED score of 1.98; thus, these results may not be generalizable to older, frailer patients or, conversely, to younger patients with fewer comorbidities. Also, the model used data from the randomized Watchman trials, but there has since been considerable progress with LAAC. In the National Cardiovascular Data Registry (NCDR), procedural success was improved (98.3% vs 92.5% used in the model), and complications were reduced, including procedure-related stroke (0.17% vs 0.82%), pericardial tamponade (1.39% vs 3.69%), and device embolization (0.07% vs 0.68%).
A new generation LAAC device, which has replaced the original device after regulatory approval in 2020, has also demonstrated high implantation success (98.8%) and fewer complications, including less pericardial tamponade (0% in the PINNACLE-FLX study).56,57 Substituting these improved LAAC clinical outcomes would only further advantage this group, and improve the cost outcomes of this analysis. But importantly, since large, long-term randomized controlled trials (RCTs) directly comparing LAAC and NOACs have not yet been completed, the model was based on an indirect comparison of clinical trials and assumed similar study populations across trials. There may be differences in the demographic composition of patients who receive LAAC compared to those receiving oral anticoagulation therapy, which may be influenced by factors such as distinct therapeutic epochs and the overall health of the patients in the clinical trials.
The clinical studies used in this research had different follow-up lengths, requiring data to be extrapolated to the modeled time horizon. Additionally, the model assumed only one clinical event per year, while AF patients may experience more than one event per year. Furthermore, the model did not capture the increased risk of additional adverse events among patients who had already experienced the same events in the past. Therefore, the model may underestimate total warfarin costs, given the higher rate of strokes and disabilities observed through trials.
Acute myocardial infarction (AMI) was not an endpoint in the pooled PROTECT AF and PREVAIL clinical trials and was not impacted by the LAAC procedure. Therefore, the model did not consider AMI, although it has been reported in previous trials of warfarin and dabigatran for AF stroke prevention. This may have led to a lower than actual total cost for warfarin and NOACs.
Finally, while this model used the average cost among a large population of Medicare beneficiaries, individual circumstances may differ. Patients may have Medicare Advantage or supplemental insurances, thus impacting their total costs of different treatments. Additionally, some low-income Medicare beneficiaries are also eligible for full Medicaid benefits (dual eligibility). This analysis, however, only assumed dual eligibility in patients who had a disabling stroke. High disability costs frequently result in patients not previously on Medicaid becoming eligible for the program. Medicaid long-term care expenditures were included to provide a complete view on disabling stroke costs.
Conclusions
The continuing rise of Medicare expenditures will likely require patient out-of-pocket cost increases. In patient-centered care, there is no one-size-fits-all treatment, underscoring the importance of shared decision-making between providers and patients to ensure both accessibility and affordability of care.58 The findings from this research indicate that LAAC may reduce the overall cost burden, and especially the cost incurred by Medicare beneficiaries, compared to warfarin and NOACs. This is attributable to reduced therapy and complication costs. These considerations should be incorporated into shared decision-making discussions with patients when evaluating options for stroke risk reduction in NVAF.
Abbreviations
AF, atrial fibrillation; LAAC, left atrial appendage closure; NOACs, non-vitamin K oral anticoagulants; NVAF, non-valvular atrial fibrillation; TIA, transient ischemic attack; mRS, modified Rankin score; TEE, transesophageal echocardiography; INR, international normalized ratio.
Ethics Approval and Informed Consent
Since this study does not involve human participants, neither institutional review board approval nor participant consent was obtained.
Acknowledgements
The authors wish to acknowledge the contributions of Nicole Gordon and Dominic Allocco, MD, to this manuscript.
Author Contributions
All authors made a significant contribution to the work reported, whether that is in the conception, study design, execution, acquisition of data, analysis and interpretation, or in all these areas; took part in drafting, revising or critically reviewing the article; gave final approval of the version to be published; have agreed on the journal to which the article has been submitted; and agree to be accountable for all aspects of the work.
Funding
This work was supported by funding from Boston Scientific, which manufacturers the Watchman Device.
Disclosure
Dr. Reddy, Ms. Gavaghan, Ms. Hertz, Ms. Low, and Mr. Freeman are paid consultants to Boston Scientific. Dr. Reddy has also received grant support from Boston Scientific during the conduct of the study. He has served as a consultant for and has equity in Ablacon, Acutus Medical, Affera-Medtronic, Anumana, Apama Medical-Boston Scientific, APN Health, Aquaheart, Atacor, Autonomix, Axon Therapies, Backbeat, BioSig, CardiaCare, CardioNXT / AFTx, Circa Scientific, CoRISMA, Corvia Medical, Dinova-Hangzhou DiNovA EP Technology, East End Medical, EPD-Philips, EP Frontiers, Epix Therapeutics-Medtronic, EpiEP, Eximo, Farapulse-Boston Scientific, Field Medical, Focused Therapeutics, HRT, Intershunt, Javelin, Kardium, Keystone Heart, Laminar, LuxMed, Medlumics, Middlepeak, Nuvera-Biosense Webster, Oracle Health, Restore Medical, Sirona Medical, SoundCath, Valcare; unrelated to this work, has served as a consultant for Abbott, Adagio Medical, AtriAN, Biosense-Webster, BioTel Heart, Biotronik, Cairdac, Cardiofocus, Cardionomic, CoreMap, Fire1, Gore & Associates, Impulse Dynamics, Medtronic, Novartis, Novo Nordisk, Philips, Pulse Biosciences; and has equity in DRS Vascular, Manual Surgical Sciences, Newpace, Nyra Medical, Surecor, and Vizaramed, outside the submitted work. At the time of writing, Dr. Zhong and Ms. Amorosi were full-time employees of Boston Scientific. Ms. McGovern is a full-time employee of Boston Scientific. Dr. Holmes Jr has no relevant disclosures to report for this work.
References
1. Go AS, Hylek EM, Phillips KA. Prevalence of diagnosed atrial fibrillation in adults: national implications for rhythm management and stroke prevention: the anticoagulation and risk factors in atrial fibrillation (ATRIA) study. JAMA. 2001;285:2370–2375. doi:10.1001/jama.285.18.2370
2. Miyasaka Y, Barnes ME, Gersh BJ. Secular trends in incidence of atrial fibrillation in Olmsted county, Minnesota, 1980 to 2000, and implications on the projections for future prevalence. Circulation. 2006;114:119–125. doi:10.1161/CIRCULATIONAHA.105.595140
3. Colilla S, Crow A, Petkun W, Singer DE, Simon T, Liu X. Estimates of current and future incidence and prevalence of atrial fibrillation in the U.S. adult population. Am J Cardiol. 2013;112:1142–1147. doi:10.1016/j.amjcard.2013.05.063
4. Piccini JP, Hammill BG, Sinner MF. Incidence and prevalence of atrial fibrillation and associated mortality among medicare beneficiaries, 1993–2007. Circ Cardiovasc Qual Outcomes. 2012;5:85–93. doi:10.1161/CIRCOUTCOMES.111.962688
5. Al-Kawaz M, Omran SS, Parikh NS, Elkind MSV, Soliman EZ, Kamel H. Comparative risks of ischemic stroke in atrial flutter versus atrial fibrillation. J Stroke Cerebrovasc Dis. 2018;27:839–844. doi:10.1016/j.jstrokecerebrovasdis.2017.10.025
6. Coyne KS, Paramore C, Grandy S, Mercader M, Reynolds M, Zimetbaum P. Assessing the direct costs of treating nonvalvular atrial fibrillation in the United States. Value Health. 2006;9:348–356. doi:10.1111/j.1524-4733.2006.00124.x
7. Lee WC, Lamas GA, Balu S, Spalding J, Wang Q, Pashos CL. Direct treatment cost of atrial fibrillation in the elderly American population: a medicare perspective. J Med Econ. 2008;11:281–298. doi:10.3111/13696990802063425
8. Kimmel SE. The influence of patient adherence on anticoagulation control with warfarin: results from the international normalized ratio adherence and genetics (in-range) study. Arch Intern Med. 2007;167:229–235. doi:10.1001/archinte.167.3.229
9. Connolly SJ, Ezekowitz MD, Yusuf S; On behalf of RE-LY Steering Committee and Investigators. Dabigatran versus warfarin in patients with atrial fibrillation. N Engl J Med. 2009;361:1139–1151. doi:10.1056/NEJMoa0905561
10. Patel MR, Mahaffey KW, Garg J; On behalf of ROCKET AF investigators. Rivaroxaban versus warfarin in nonvalvular atrial fibrillation. N Engl J Med. 2011;365:883–891. doi:10.1056/NEJMoa1009638
11. Granger CB, Alexander JH, McMurray JJ; On behalf of ARISTOTLE committees and investigators. Apixaban versus warfarin in patients with atrial fibrillation. N Engl J Med. 2011;365:981–992. doi:10.1056/NEJMoa1107039
12. Giugliano RP, Ruff CT, Braunwald E. Edoxaban versus warfarin in patients with atrial fibrillation. N Engl J Med. 2013;369:2093–2104. doi:10.1056/NEJMoa1310907
13. Yao X, Abraham NS, Alexander GC. Effect of adherence to oral anticoagulants on risk of stroke and major bleeding among patients with atrial fibrillation. J Am Heart Assoc. 2016;5 doi:10.1161/JAHA.115.003074
14. January CT, Wann LS, Calkins H. AHA/ACC/HRS focused update of the 2014 AHA/ACC/HRS guideline for the management of patients with atrial fibrillation: a report of the American College of Cardiology/American heart association task force on clinical Practice guidelines and the heart rhythm society. J Am Coll Cardiol. 2019;74(1):104–132. doi:10.1016/j.jacc.2019.01.011
15. Boston Scientific Corp, Marlborough MA. WATCHMANTM [package insert]; 2015. Available from: http://www.bostonscientific.com/content/dam/Manuals/us/current-rev-en/90746221-01C_Watchman%20Device_DFU_en-US_s.pdf.
16. Reddy VY, Sievert H, Halperin J; on behalf of PROTECT AF steering committee and investigators. Percutaneous left atrial appendage closure vs warfarin for atrial fibrillation, a randomized clinical trial. JAMA. 2014;312:1988–1998. doi:10.1001/jama.2014.15192
17. Holmes DR, Kar S, Price MJ. Prospective randomized evaluation of the watchman left atrial appendage closure device in patients with atrial fibrillation versus long-term warfarin therapy – the PREVAIL trial. J Am Coll Cardiol. 2014;64:1–12. doi:10.1016/j.jacc.2014.04.029
18. Reddy VY, Doshi SK, Kar S. 5-year outcomes after left atrial appendage closure: from the PREVAIL and PROTECT AF trials. J Am Coll Cardiol. 2017;70:2964–2975. doi:10.1016/j.jacc.2017.10.021
19. Turagam MK, Osmancik P, Neuzil P, Dukkipati SR, Reddy VY. Left atrial appendage closure versus oral anticoagulants in atrial fibrillation: a meta-analysis of randomized trials. J Am Coll Cardiol. 2020;76:2795–2797. doi:10.1016/j.jacc.2020.08.089
20. Feinberg WM, Blackshear JL, Laupacis A. Prevalence, age distribution, and gender of patients with atrial fibrillation. Anal Implic Arch Intern Med. 1995;155(5):469–473. doi:10.1001/archinte.1995.00430050045005
21. Cubanski J, Neuman T, Damico A, Smith KE. Medicare beneficiaries’ out-of-pocket health care spending as a share of income now and projections for the future. Available from: https://www.kff.org/medicare/report/medicare-beneficiaries-out-of-pocket-health-care-spending-as-a-share-of-income-now-and-projections-for-the-future/.
22. Noel-Miller C. Medicare Beneficiaries’ Out-of-Pocket Spending for Health Care. AARP Public Policy Institute. Available from: https://www.aarp.org/content/dam/aarp/research/public_policy_institute/health/medicmed-beneficiaries-out-of-pocket-spending-AARP-ppi-health.pdf.
23. Reddy VY, Akehurst RL, Armstrong SO, Amorosi SL, Beard SM, Holmes DR. Time to cost-effectiveness following stroke reduction strategies in AF: warfarin versus NOACs versus LAA closure. J Am Coll Cardiol. 2015;66:2728–2739. doi:10.1016/j.jacc.2015.09.084
24. Reddy VY, Akehurst RL, Gavaghan MB, Amorosi SL, Holmes JDR. Cost-effectiveness of left atrial appendage closure for stroke reduction in atrial fibrillation: analysis of pooled, 5-year, long-term data. J Am Heart Assoc. 2019;8(13):e011577. doi:10.1161/JAHA.118.011577
25. Ezekowitz MD, Bridgers SL, James KE. on behalf of the veterans affairs stroke prevention in nonrheumatic atrial fibrillation investigators. Warfarin in the prevention of stroke associated with nonrheumatic atrial fibrillation. N Engl J Med. 1992;327:1406–1412. doi:10.1056/NEJM199211123272002
26. Boston Area Anticoagulation Trial for Atrial Fibrillation Investigators*. The effect of low-dose warfarin on the risk of stroke in patients with nonrheumatic atrial fibrillation. N Engl J Med. 1990;323:1501–1511.
27. Connolly S, Pogue J, Hart R. Clopidogrel plus aspirin versus oral anticoagulation for atrial fibrillation in the atrial fibrillation clopidogrel trial with irbesartan for prevention of vascular events (ACTIVE W): a randomised controlled trial. Lancet. 2006;367:1903–1912.
28. Connolly SJ, Laupacis A, Gent M, Roberts RS, Cairns JA, Joyner C. Canadian atrial fibrillation anticoagulation (CAFA) study. J Am Coll Cardiol. 1991;18:349–355. doi:10.1016/0735-1097(91)90585-W
29. Hart RG, Pearce LA, Aguilar MI. Meta-analysis: antithrombotic therapy to prevent stroke in patients who have nonvalvular atrial fibrillation. Ann Intern Med. 2007;146:857–867. doi:10.7326/0003-4819-146-12-200706190-00007
30. Freeman JV, Zhu RP, Owens DK. Cost-effectiveness of dabigatran compared with warfarin for stroke prevention in atrial fibrillation. Ann Intern Med. 2011;154:1–11. doi:10.7326/0003-4819-154-1-201101040-00289
31. Pisters R, Lane DA, Nieuwlaat R, Vos CB, Crijns HJGM, Lip GYH. A novel user-friendly score (HAS-BLED) to assess 1-year risk of major bleeding in patients with atrial fibrillation: the Euro heart survey. Chest. 2010;138:1093–1100. doi:10.1378/chest.10-0134
32. Dennis MS, Burn JP, Sandercock PA, Bamford JM, Wade DT, Warlow CP. Long-term survival after first-ever stroke: the Oxfordshire community stroke project. Stroke. 1993;24:796–800. doi:10.1161/01.STR.24.6.796
33. Ruff CT, Giugliano RP, Braunwald E, et al. Comparison of the efficacy and safety of new oral anticoagulants with warfarin in patients with atrial fibrillation: a meta-analysis of randomised trials. The Lancet. 2014;383(9921):955–962. doi:10.1016/S0140-6736(13)62343-0
34. Alkhouli M, Busu T, Shah K, Osman M, Alqahtani F, Raybuck B. Incidence and clinical impact of device-related thrombus following percutaneous left atrial appendage occlusion: a meta-analysis. JACC Clin Electrophysiol. 2018;4(12):1629–1637. doi:10.1016/j.jacep.2018.09.007
35. Stroke Prevention in Atrial Fibrillation Investigators. Stroke prevention in atrial fibrillation study. Final Results Circ. 1991;84:527–539.
36. Petersen P, Boysen G, Godtfredsen J, Andersen ED, Andersen B. Placebo-controlled, randomized trial of warfarin and aspirin for prevention of thromboembolic complications in chronic atrial fibrillation, the Copenhagen AFASAK study. Lancet. 1989;8631:175–178. doi:10.1016/S0140-6736(89)91200-2
37. Cipriano LE, Steinberg ML, Gazelle GS, Gonzalez RG. Comparing and predicting the costs and outcomes of patients with major and minor stroke using the Boston Acute Stroke Imaging Scale neuroimaging classification system. Am J Neuroradiol. 2009;30(703):709. doi:10.3174/ajnr.A1441
38. Mercaldi CJ, Sui K, Sander SD. Long term costs of ischemic stroke and major bleeding events among medicare patients with nonvalvular atrial fibrillation. Cardiol Res Pract. 2012;2012:1–13. doi:10.1155/2012/645469
39. Caro JJ, Huybrechts FK. Stroke treatment economic model (STEM): predicting long term costs from functional status. Stroke. 1999;30:2574–2579. doi:10.1161/01.STR.30.12.2574
40. Financial G, Inc. Compare Long Term Care Costs Across the United States. Available from: https://www.genworth.com/about-us/industry-expertise/cost-of-care.html.
41. FY 2023 IPPS Final Rule Home Page | CMS. Available from: https://www.cms.gov/medicare/acute-inpatient-pps/fy-2023-ipps-final-rule-home-page.
42. 2023 Medicare Parts A & B premiums and deductibles 2023 Medicare Part D income-related monthly adjustment amounts | CMS. Available from: https://www.medicare.gov/basics/costs/medicare-costs.
43. The Coding Institute. CPT® Code Lookup. Available from: https://www.supercoder.com/cpt-codes-range.
44. America DMD. Drug pricing database.
45. Lee B, Chatterjee C, Higgins MJ. Regulation and welfare: evidence from paragraph IV generic entry in the pharmaceutical industry. NBER Work Pap; 2011:17188. Available from: http://www.nber.org/papers/w17188.
46. Inpatient Rehabilitation Facility PPS | CMS. Available from: https://www.cms.gov/medicare/medicare-fee-for-service-payment/inpatientrehabfacpps.
47. Costs. Medicare. Available from: https://www.medicare.gov/basics/costs/medicare-costs.
48. Sorensen SV, Dewilde S, Singer DE, Goldhaber SZ, Monz BU, Plumb JM. Cost-effectiveness of warfarin: trial versus “real-world” stroke prevention in atrial fibrillation. Am Heart J. 2009;157:1064–1073.
49. Reaves EL, Found HJKF. Medicaid and long-term services and supports: a Primer; 2015. Available from: https://www.kff.org/medicaid/report/medicaid-and-long-term-services-and-supports-a-primer/.
50. Brook RH, Ware JE, Rogers WH The effect of coinsurance on the health of adults; 1984. Available form: https://www.rand.org/pubs/reports/R3055.html.
51. Brot-Goldberg ZC, Chandra A, Handel BR, Kolstad JT. What does a deductible do? The impact of cost-sharing on health care prices, quantities, and spending dynamics. Natl Bur Econ Res.132.
52. Heckman BW, Mathew AR, Carpenter MJ. Treatment burden and treatment fatigue as barriers to health. Curr Opin Psychol. 2015;5:31–36.
53. Lang K, Bozkaya D, Patel AA. Anticoagulant use for the prevention of stroke in patients with atrial fibrillation: findings from a multi-payer analysis. BMC Health Serv Res. 2014;14(329).
54. Alalwan AA, Voils SA, Hartzema AG. Trends in utilization of warfarin and direct oral anticoagulants in older adult patients with atrial fibrillation. Am J Health Syst Pharm. 2017;74:1237–1244.
55. Ziakas PD, Kourbeti IS, Poulou LS, Vlachogeorgos GS, Mylonakis E. Medicare part D prescribing for direct oral anticoagulants in the United States: cost, use and the “rubber effect. PLoS One. 2018;13:e0198674. doi:10.1371/journal.pone.0198674.
56. Freeman JV, Varosy P, Price MJ. The NCDR left atrial appendage occlusion registry. J Am Coll Cardiol. 2020;75:1503–1518.
57. Kar S, Doshi SK, Sadhu A. Primary outcome evaluation of a next-generation left atrial appendage closure device: results from the PINNACLE FLX trial. Circulation. 2021;143:1754–1762.
58. Haldorsen E. The right treatment to the right patient at the right time. Occup Env Med. 2003;60:235–236.
 © 2024 The Author(s). This work is published and licensed by Dove Medical Press Limited. The full terms of this license are available at https://www.dovepress.com/terms.php and incorporate the Creative Commons Attribution - Non Commercial (unported, v3.0) License.
By accessing the work you hereby accept the Terms. Non-commercial uses of the work are permitted without any further permission from Dove Medical Press Limited, provided the work is properly attributed. For permission for commercial use of this work, please see paragraphs 4.2 and 5 of our Terms.
© 2024 The Author(s). This work is published and licensed by Dove Medical Press Limited. The full terms of this license are available at https://www.dovepress.com/terms.php and incorporate the Creative Commons Attribution - Non Commercial (unported, v3.0) License.
By accessing the work you hereby accept the Terms. Non-commercial uses of the work are permitted without any further permission from Dove Medical Press Limited, provided the work is properly attributed. For permission for commercial use of this work, please see paragraphs 4.2 and 5 of our Terms.