Back to Journals » Infection and Drug Resistance » Volume 14
Comparative Analysis of Serum Proteins Between Hepatitis B Virus Genotypes B and C Infection by DIA-Based Quantitative Proteomics
Authors Chen Y ![]() , Wei D
, Wei D ![]() , Deng M
, Deng M
Received 23 August 2021
Accepted for publication 28 October 2021
Published 9 November 2021 Volume 2021:14 Pages 4701—4715
DOI https://doi.org/10.2147/IDR.S335666
Checked for plagiarism Yes
Review by Single anonymous peer review
Peer reviewer comments 3
Editor who approved publication: Professor Suresh Antony
Yunqing Chen,1,2 Dahai Wei,1– 3 Min Deng1– 3
1Department of Infectious Diseases, Affiliated Hospital of Jiaxing University, Jiaxing, People’s Republic of China; 2Department of Infectious Diseases, First Hospital of Jiaxing, Jiaxing, People’s Republic of China; 3Institute of Hepatology, Affiliated Hospital of Jiaxing University, Jiaxing, People’s Republic of China
Correspondence: Dahai Wei; Min Deng
Department of Infectious Diseases, The Affiliated Hospital of Jiaxing University, 1882 South Zhonghuan Road, Jiaxing, 314001, People’s Republic of China
Tel/Fax +86-573-89975669
Email [email protected]; [email protected]
Purpose: In clinical practice, the clinicopathological profiles and outcomes of patients infected with hepatitis B virus (HBV) are different between genotypes B and C. However, little is known about the potential mechanism and differences in specific biological pathways associated with the different genotype. This study aimed to compare the serum protein profile between patients infected with HBV genotype B and those infected with HBV genotype C.
Patients and Methods: A total of 54 serum samples from patients with chronic HBV genotype B infection and those with chronic HBV genotype C infection, and healthy controls were used for the proteomic analysis (n = 18 samples in per group). Serum proteomic profiles were analyzed using data-independent acquisition (DIA)-based liquid chromatography-mass spectrometry to identify differentially expressed proteins (up- or downregulation of at least 1.5-fold) between serum samples from HBV patients infected with HBV genotype B and those infected with genotype C.
Results: We identified 1010 proteins, 53 of which were differentially expressed between the serum samples of the healthy controls and those of HBV genotype B infected patients, and 59 that were differentially expressed between the samples of the healthy controls and those of HBV genotype C infected patients. Furthermore, our results indicated that two proteins identified as being differentially expressed (VWF and C8B) have potential as biomarkers for distinguishing genotype B infected HBV patients from those infected with genotype C.
Conclusion: The results of our DIA-based quantitative proteomic analysis revealed that HBV genotypes B and C are associated with different molecular profiles and may provide fundamental information for further detailed investigations of the molecular mechanism underlying these differences.
Keywords: serum protein profiles, complement and coagulation cascade, von Willebrand factor, complement C8 beta chain
Graphical Abstract:

Introduction
Hepatitis B virus (HBV) is an enveloped, non-cytopathic, hepatotropic, partially double-stranded DNA virus belonging to the family genus Orthohepadnavirus (family: Hepadnaviridae).1,2 Despite the significant progress in the availability of safe vaccines and antiviral therapies against HBV, this virus still affects approximately 257 million people worldwide, resulting in approximately 887,000 deaths each year.3 HBV infection, which is associated with acute and chronic liver failure, can result in chronic hepatitis or fulminant hepatitis and put patients at high risk of developing advanced liver fibrosis and cirrhosis, and even hepatocellular carcinoma (HCC).1,2,4 Many viral-derived factors, that can affect the disparity in clinical manifestations or disease prognosis during chronic HBV infection have been identified; among them, the viral genotype and HBV mutations ascribing the virus to a certain phenotype have been reported to the key determinants of viral pathogenesis, including changes in host immune recognition, enhanced virulence with increased HBV replication, and the facilitation of cell attachment or penetration.5–7
Ten HBV genotypes (A-J) have been characterized to date and have been assigned distinct geographical and ethnic distributions worldwide based on a greater than 8% intergenotypic sequence divergence. Genotypes B and C are dominant in Asia and the Pacific region, including China.8,9 Different genotypes exert varied effects on disease severity, course, the likelihood of complications, response to treatment, and possibly vaccination.10–12 It has been shown that compared with patients infected with genotype B, those infected with genotype C have a higher prevalence of basal core promoter A1762T/G1764A variants and spontaneous tyrosine-methionine-aspartate-aspartate (YMDD) mutations.13,14 A study of 332 patients in Hong Kong reported that patients with genotype C had a significantly higher prevalence of hepatitis B e antigen (HBeAg) (53% vs 69%, P < 0.01) at presentation and had a lower cumulative rate of HBeAg seroconversion during follow-up than those infected with genotype B. Accordingly, patients infected with genotype C experience delayed HBeAg seroconversion and thus have a significantly longer duration of high viral load compared with patients with genotype B.15 In another study of 150 patients with chronic HBV infection in China, the authors found that patients harboring genotype C had higher levels of viral replication (6.87 ± 0.35 vs 5.03 ± 0.55 log10 copies/mL, P < 0.01), alanine transferase (ALT) (500.35 ± 81.81 vs 269.51 ± 46.62 U/L, P < 0.01), nonspecific CTL (19.72 ± 1.07% vs 16.65 ± 2.21%, P < 0.01), but lower levels of HBV-specific cytotoxic T lymphocytes (CTL) (0.23 ±0.03% vs 0.37 ± 0.03%, P < 0.01), Follicular helper T cells (Tfh) (3.85 ± 2.43% vs 5.91 ± 1.84%, percentage of CD4 + T lymphocytes, P < 0.01), and interleukin-21 (IL-21) (15.80 ± 2.44 vs 43.26 ± 19.70 ng/L, P < 0.01).16 Furthermore, some specific viral mutations, a high HBV viral load and quantitative hepatitis B surface antigen (HBsAg) levels, which independently may be associated with more live disease complications and a higher chance of HCC transition, appear to occur at a significantly higher frequency in HBV genotype C than genotype B patients.17,18 Combined, these suggest that significant differences in clinical manifestations exist between patients infected with the two genotypes.
HBV regulates macromolecular synthesis in the host by modifying the host transcriptional and translational machinery and forcing the host to meet the requirements of the virus during infection.4,19,20 These requirements may lead to epigenetic modifications that are associated with various biological processes during almost every step of the HBV life cycle, from entry to secretion.10,19,21 Numerous epidemiological studies suggest that patients infected with HBV genotype C have a significantly lower level of T helper 1 (Th1) cytokine producing T cells and a higher level of Th2 cytokine-producing T cells than patients with genotype B, which suggests that HBV genotype C induces a greater Th2 and lesser Th1 response than genotype B.22–24 In our previous quantitative proteomics study, we found that proteins that were dysregulated in HBV genotype B-induced HCC were mainly involved in biological processes such as response to toxin, RNA splicing, and cellular macromolecular complex assembly, while the proteins that were dysregulated in genotype C-induced HCC were primarily associated with organic acid catabolic process, carboxylic acid catabolic process, and alcohol biosynthetic process.25 These results indicated that marked differences in molecular pathogenesis exist between HBV patients with genotype B and those with genotype C infection. However, the precise molecular mechanisms associated with these differences remain largely unknown.
Comparative proteomic approaches coupling data independent acquisition (DIA)-based liquid chromatography-tandem mass spectrometry (LC-MS/MS) are commonly used to analyze human, animal, and plant host responses during viral infections.26,27 In addition, DIA-based quantitative proteomics can be used to screen and identify key protein biomarkers for early disease recognition, diagnosis, monitoring, and treatment.28–30 Thus, serum proteomic analysis provides an overall understanding of the host factors involved in virus infections and provides insights into signaling pathway alterations, improving our understanding of the molecular pathogenesis of HBV infection. However, the application of quantitative proteomic analysis in the investigation of the differences in serum protein profiles between HBV genotype B and genotype C infection has not been reported to date. Here, to interpret the molecular differences underlying host resistance to genotypes B and C HBV, we undertook a comparative DIA-based quantitative proteomics analysis of the serum protein expression profile between patients with HBV genotype B infection and those infected with HBV genotype C. The results of this study will aid in the understanding of the molecular differences between patients infected with the two HBV genotypes, and might provide fundamental information for further detailed investigation of the molecular mechanisms underlying these differences.
Materials and Methods
Patients and Sample Collection
The study population consisted of healthy controls and eligible patients with chronic hepatitis B (CHB) who were identified as sero positive for HBV infection from January 2018 to June 2020 at the Department of Infectious Diseases of the Affiliated Hospital of Jiaxing University in East China. HBV genotyping of all the samples was performed by real-time fluorescence PCR using a commercially available HBV genotyping kit (Shanghai Fosun Pharmaceutical Co., Ltd. Shanghai, China) as recommended by the manufacturer and as previously described.9,25 Patients who were treated with nucleoside analogs or interferons in the preceding 2 years were excluded from the study. Patients with concurrent HIV, HAV, HCV, HDV, or other viral infections were also excluded, as were those presenting with liver diseases, such as cirrhosis or HCC. Anonymized relevant clinical information for the patients, including biochemical data, is presented in Table 1. The study was reviewed and approved by the Institutional Review Board of The Affiliated Hospital of Jiaxing University, and all participants provided written informed consent before enrolment (Approval Number: LS2019-327).
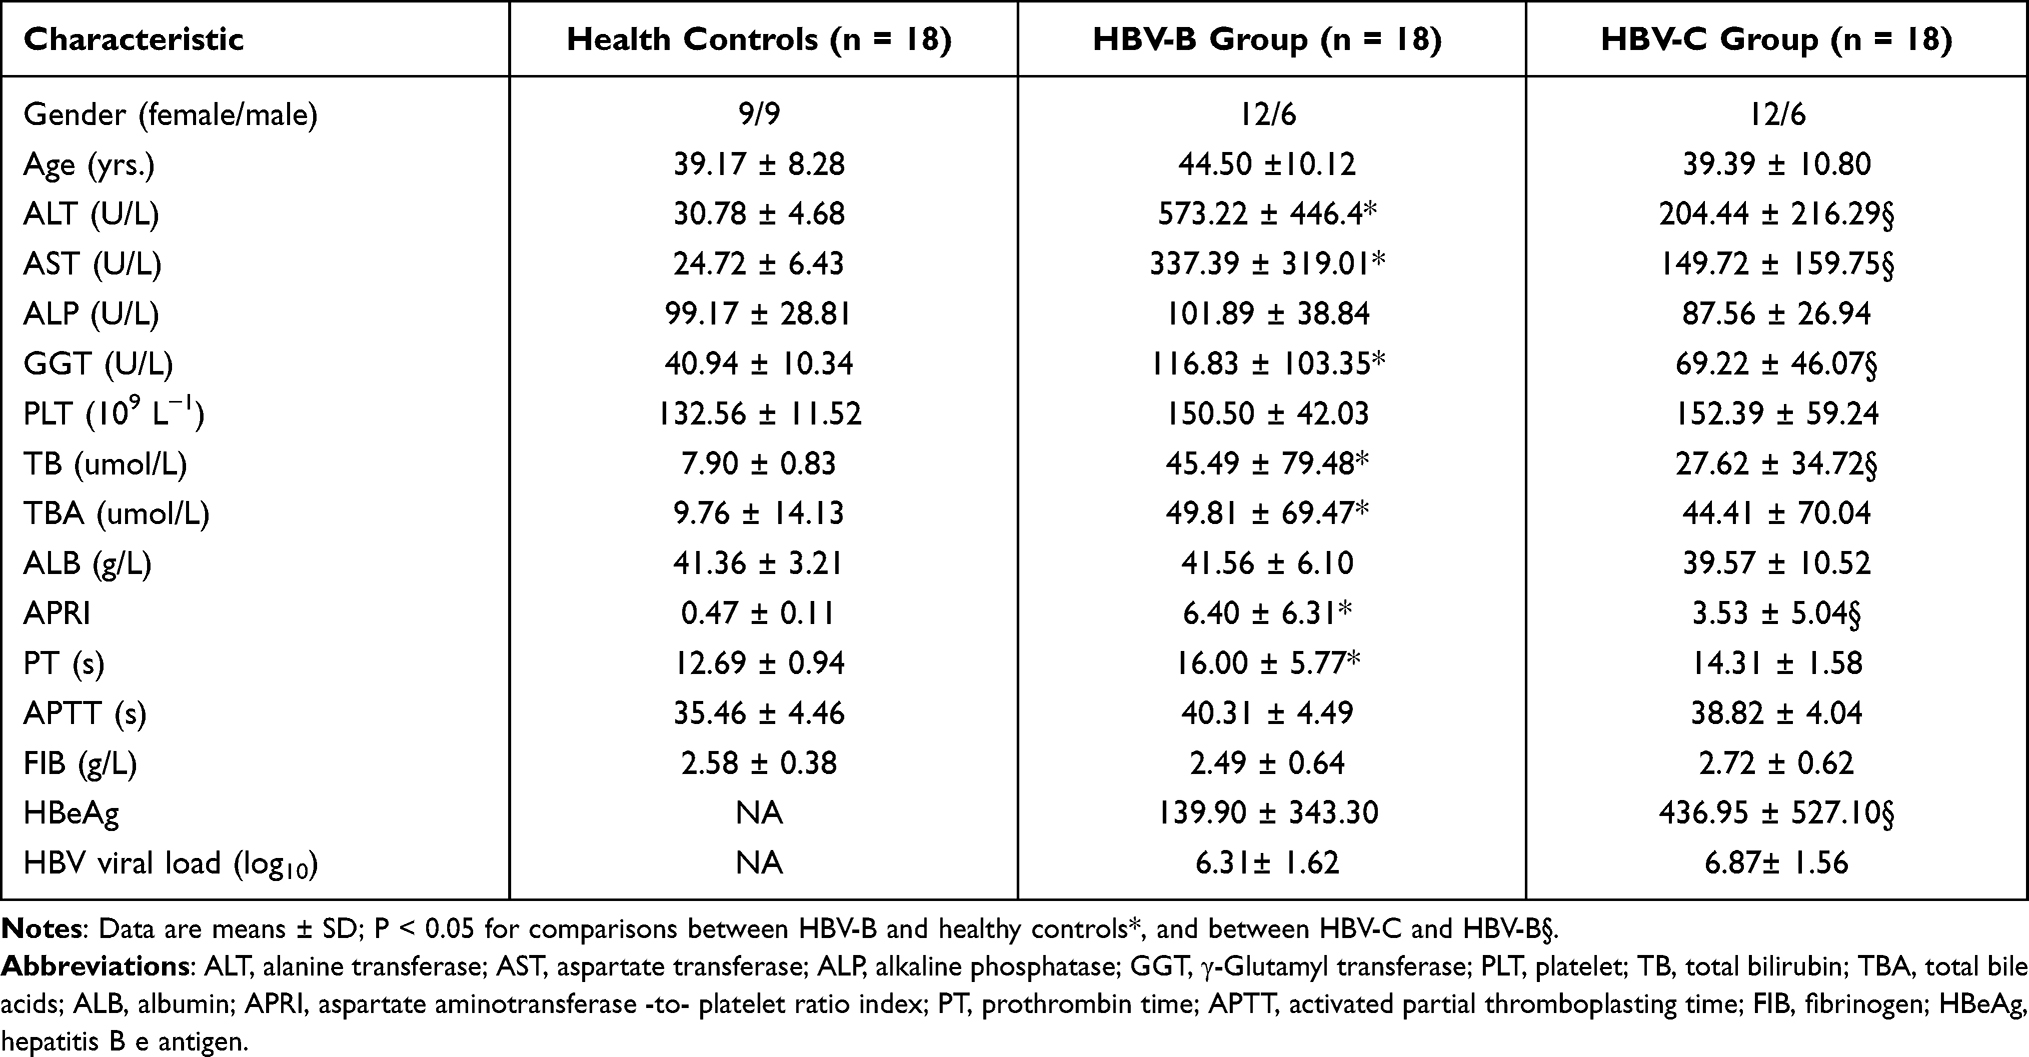 |
Table 1 Baseline Characteristics of Patients Enrolled in This Study |
Serum samples from 18 healthy controls and 36 patients infected with HBV genotype B or C (n = 18 each genotype) were divided into three groups: healthy controls (group A, n = 18), patients infected with HBV genotype B (HBV-B) (group B, n = 18) and patients infected with HBV genotype C (HBV-C) (group C, n = 18) according to standard operating procedures to minimize preanalytical variation. For each group, every 6 individual samples containing equal volumes of serum were mixed, and the pooled serum was then separated into high- and low-abundance protein fractions on a Human Multiple Affinity Removal System Column (Agilent Technologies, Santa Clara, CA, USA) according to the manufacturer’s instructions. Six repeated protein extracts were obtained per group to minimize the effects of individual differences among patients (Figure S1).
Sample Preparation
High- and low-abundance proteins were collected into 5-kDa ultrafiltration tubes (Sartorius, Germany) for the desalination and concentration of high- and low-abundance components. The proteins were precipitated with SDT lysis buffer at 95 °C for 15 min and then centrifuged at 14,000 g for 20 min. Protein concentrations were determined using a BCA Protein Assay Kit (Bio-Rad, USA) and the resulting supernatants were stored at −80 °C until use.
Protein digestion was performed using the filter-aided sample preparation method as previously described.30 In brief, 100 μL of iodoacetamide (IAA; 100 mM in UA buffer) was added to the protein samples, followed by incubation at room temperature in the dark for 30 min. The proteins were subsequently digested with 4 μg of trypsin (Promega, USA) in 40 μL of 25 mM NH4HCO3 buffer at 37 °C overnight, desalted using a C18 cartridge (Sigma, USA), and then vacuum-dried.
DDA- and DIA-Based LC-MS/MS
All fractions for data-dependent acquisition (DDA) library generation were analyzed using a Q Exactive HF -X mass spectrometer (Thermo Fisher Scientific, USA) equipped with an Easy -nLC 1200 chromatography system (Thermo Fisher Scientific). Peptides (1.5 μg) were first loaded onto an EASY-Spray C18 Trap Column (Thermo Fisher Scientific) and then separated on an EASY-Spray C18 LC Analytical Column (Thermo Fisher Scientific) using a linear gradient of buffer B (84% acetonitrile and 0.1% formic acid) at a flow rate of 250 nL/min over 120 min. In brief, the full MS scan ranging from 300 to 1800 m/z, was acquired with a resolution of 60,000 at m/z 200. The automatic gain control (AGC) was set to 3e6, and the maximum ion injection time (MIT) was set to 25 ms. Each full MS-SIM scan followed 20 ddMS2 scans. MS2 scans were performed at a resolution of 15,000, an AGC target of 5e4, an MIT of 250 ms, and normalized collision energy of 30 eV.
The peptides from each sample were analyzed by LC-MS/MS in DIA mode. Each DIA cycle contained one full MS-SIM scan and 30 DIA scans covering a mass range of 350–1800 m/z with a resolution of 120,000 at 200 m/z. The MIT was set to 50 ms, and the AGC was set to 3e6 in profile mode. The DIA scans were performed at a resolution of 15,000 (AGC target: 3e6; MIT: auto; and normalized collision energy: 30 eV). The run time was 120 min with a linear gradient of buffer B at a flow rate of 250 nL/min. To monitor the MS performance, QC samples were injected in DIA mode at the beginning of the analysis and after every six injections throughout the experiment.
MS Spectrometry Data Analysis
DDA library data was searched against the FASTA sequence database using Spectronaut software (version 14.4.200727.47784; Biognosys, Switzerland) as previously described.27 The human proteome database in UniProt (2020/11/22, 9951 sequences) appended with iRT peptide sequences was used. The searches were run using the following parameters: enzyme, trypsin; max missed cleavages, 2; fixed modification, carbamidomethyl (C); dynamic modification, oxidation (M) and acetyl (protein N-term). In addition, all data were reported based on a 99% confidence level for protein identification (false discovery rate [FDR] < 0.01) (Figure S2). The analysis results were then imported to Spectronaut Pulsar X (version 12.0.20491.4; Biognosys) for the generation of spectral libraries.
The raw DIA data were further searched against the abovementioned spectral library using Spectronaut software (version 14.4.200727.47784). For the main software parameters, retention time prediction was set to dynamic iRT, and interference in MS2 level correction and cross-run normalization were both enabled. The FDR threshold at the peptide level was set as 1% to obtain significant quantitative data. All MS raw data have been deposited to the ProteomeXchange Consortium via the PRIDE partner repository with the dataset identifier PXD025968.
Bioinformatics and Statistical Analysis
Significantly differentially expressed proteins were defined as those displaying a fold change ≥1.5 or ≤0.67 with a paired t-test P-value <0.05. All differentially expressed proteins were subjected to hierarchical clustering analysis with Cluster 3.0 (http://bonsai.hgc.jp/~mdehoon/software/cluster/software.htm) and Java Tree View software (http://jtreeview.sourceforge.net). Gene ontology (GO) and InterPro (IPR) analyses were conducted using the software program Blast2GO (http://www.blast2 go.com/b2 g home) based on functional annotations for biological processes, molecular functions, and cellular components.
The Kyoto Encyclopedia of Genes and Genomes (KEGG) database (http://geneontology.org/) was used to annotate the protein family and pathway with the KEGG Automatic Annotation Server (KAAS, https://www.genom e.jp/tools/kaas/).
All statistical analyses were performed using the Statistical Package for the Social Sciences (SPSS) 22.0 software (SPSS Inc., Chicago, IL, USA). Quantitative data are expressed as the mean ± standard deviation (SD). The statistical significance of the differences was analyzed using Student’s t-test for comparisons between two groups and one-way analysis of variance (ANOVA) for comparisons among multiple groups. Differences were considered statistically significant if the two-tailed p-value was less than 0.05.
Validation of the Selected Dysregulated Proteins by ELISA
To verify the results of the proteomic study, proteins exhibiting significantly different levels in the two groups were subjected to enzyme-linked immunosorbent assay (ELISA) and automated biochemical analyses as previously described.27 All serum samples collected from the three groups were evaluated using a commercially available ELISA kit (Abcam, USA) for selected dysregulated proteins according to the manufacturer’s protocol. ELISA of each sample was performed in triplicate. Optical density values were read at 450 nm using a microplate reader (BioTek ELx800), and concentrations were automatically calculated based on the standard curve and dilution factors. The inter- and intra-assay coefficients of variation were less than 5%.
Results
Clinical Characteristics of the Study Population
A total of 54 serum samples from patients with chronic HBV genotypes B and C infection and healthy controls were used for the proteomic analysis, with 18 samples per group. In each group, according to the genotype of HBV, patients were further randomly allocated into three subgroups, with 6 individuals in each. No significant differences were found in age, sex ratio, or alkaline phosphatase (ALP), total bile acids (TBA), and fibrinogen (FIB) levels among the three groups. However, compared with the healthy controls or patients in the HBV-B group, patients in the HBV-C group had significantly different laboratory results for ALT, aspartate transferase (AST), γ-glutamyl transferase (GGT), and HBeAg levels, platele (PLT) counts, and the AST-PLT ratio index (APRI) (Table 1).
Comparison of the Relative Serum Proteome Quantification Between Infection with HBV Genotype B and Genotype C
Through DIA-based quantitative proteomic analysis, we identified 1923 uniquely abundant proteins across the 9951 peptides from the human proteome database in UniProt (Figure 1A and B). Employing the results obtained using Spectronaut software with the integrated Andromeda search engine, we quantified 1303, 1206 and 1374 proteins in the three replicates used for DIA-based quantitative proteomic analysis. A total of 1010 proteins overlapped among the three groups, accounting for 63.72% of the total quantified proteins (Figure 1C).
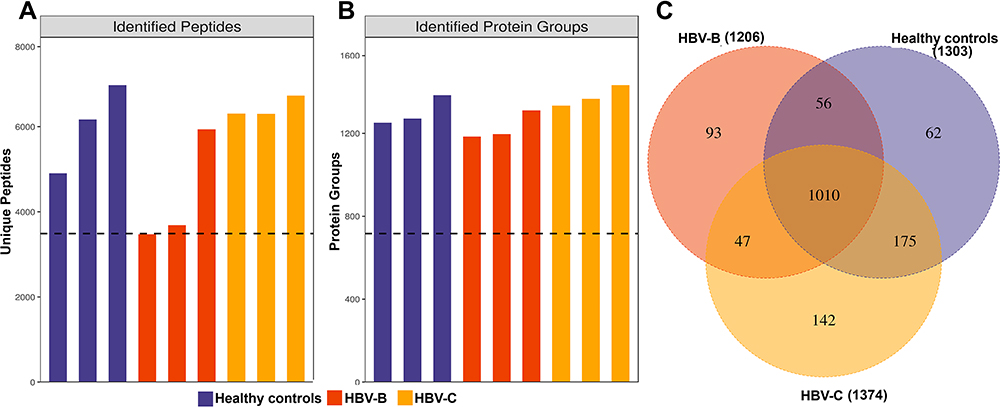 |
Figure 1 Identification of serum proteins in HBV patients infected with genotype B and those infected genotype C. (A) The number of identified peptides in 3 repeated experiments. (B) The number of identified protein groups in 3 repeated experiments. (C)The Venn diagrams show the numbers of identified proteins and the overlaps of protein identification in the 3 groups. |
Differentially Expressed Proteins Associated with Genotypes B and C Infection
To identify differentially expressed proteins, the relative protein expression values were compared between each HBV group and the healthy control group. Based on hierarchical clustering analysis, 53 proteins with a mean expression fold change of ≥± 1.5 (log2 = 0.58) were classified as differentially expressed in the serum of patients from the HBV-B group compared with that in the serum of healthy controls (Groups B vs A) (Figure 2A, Table S1). When the ratio of these 53 proteins was plotted on a heatmap, 45 and 8 proteins were found to be upregulated and downregulated, respectively, between the serum samples of the HBV-C and healthy control groups; moreover, these two sets of proteins were separated into distinct clusters (Figure 2B, Figure S3). The names of the typically dysregulated proteins are listed in Table 2 and Figure S4. We then performed GO enrichment analysis to analyze which biological processes these 53 dysregulated proteins were involved in and found that they were separated into distinct clusters. The top three most enriched biological process terms were cellular process (n = 6), metabolic process (n = 6) and response to stimulus (n = 5) (Figure 2C and D). These results indicated that the molecular mechanisms might differ between the HBV-B and healthy control groups.
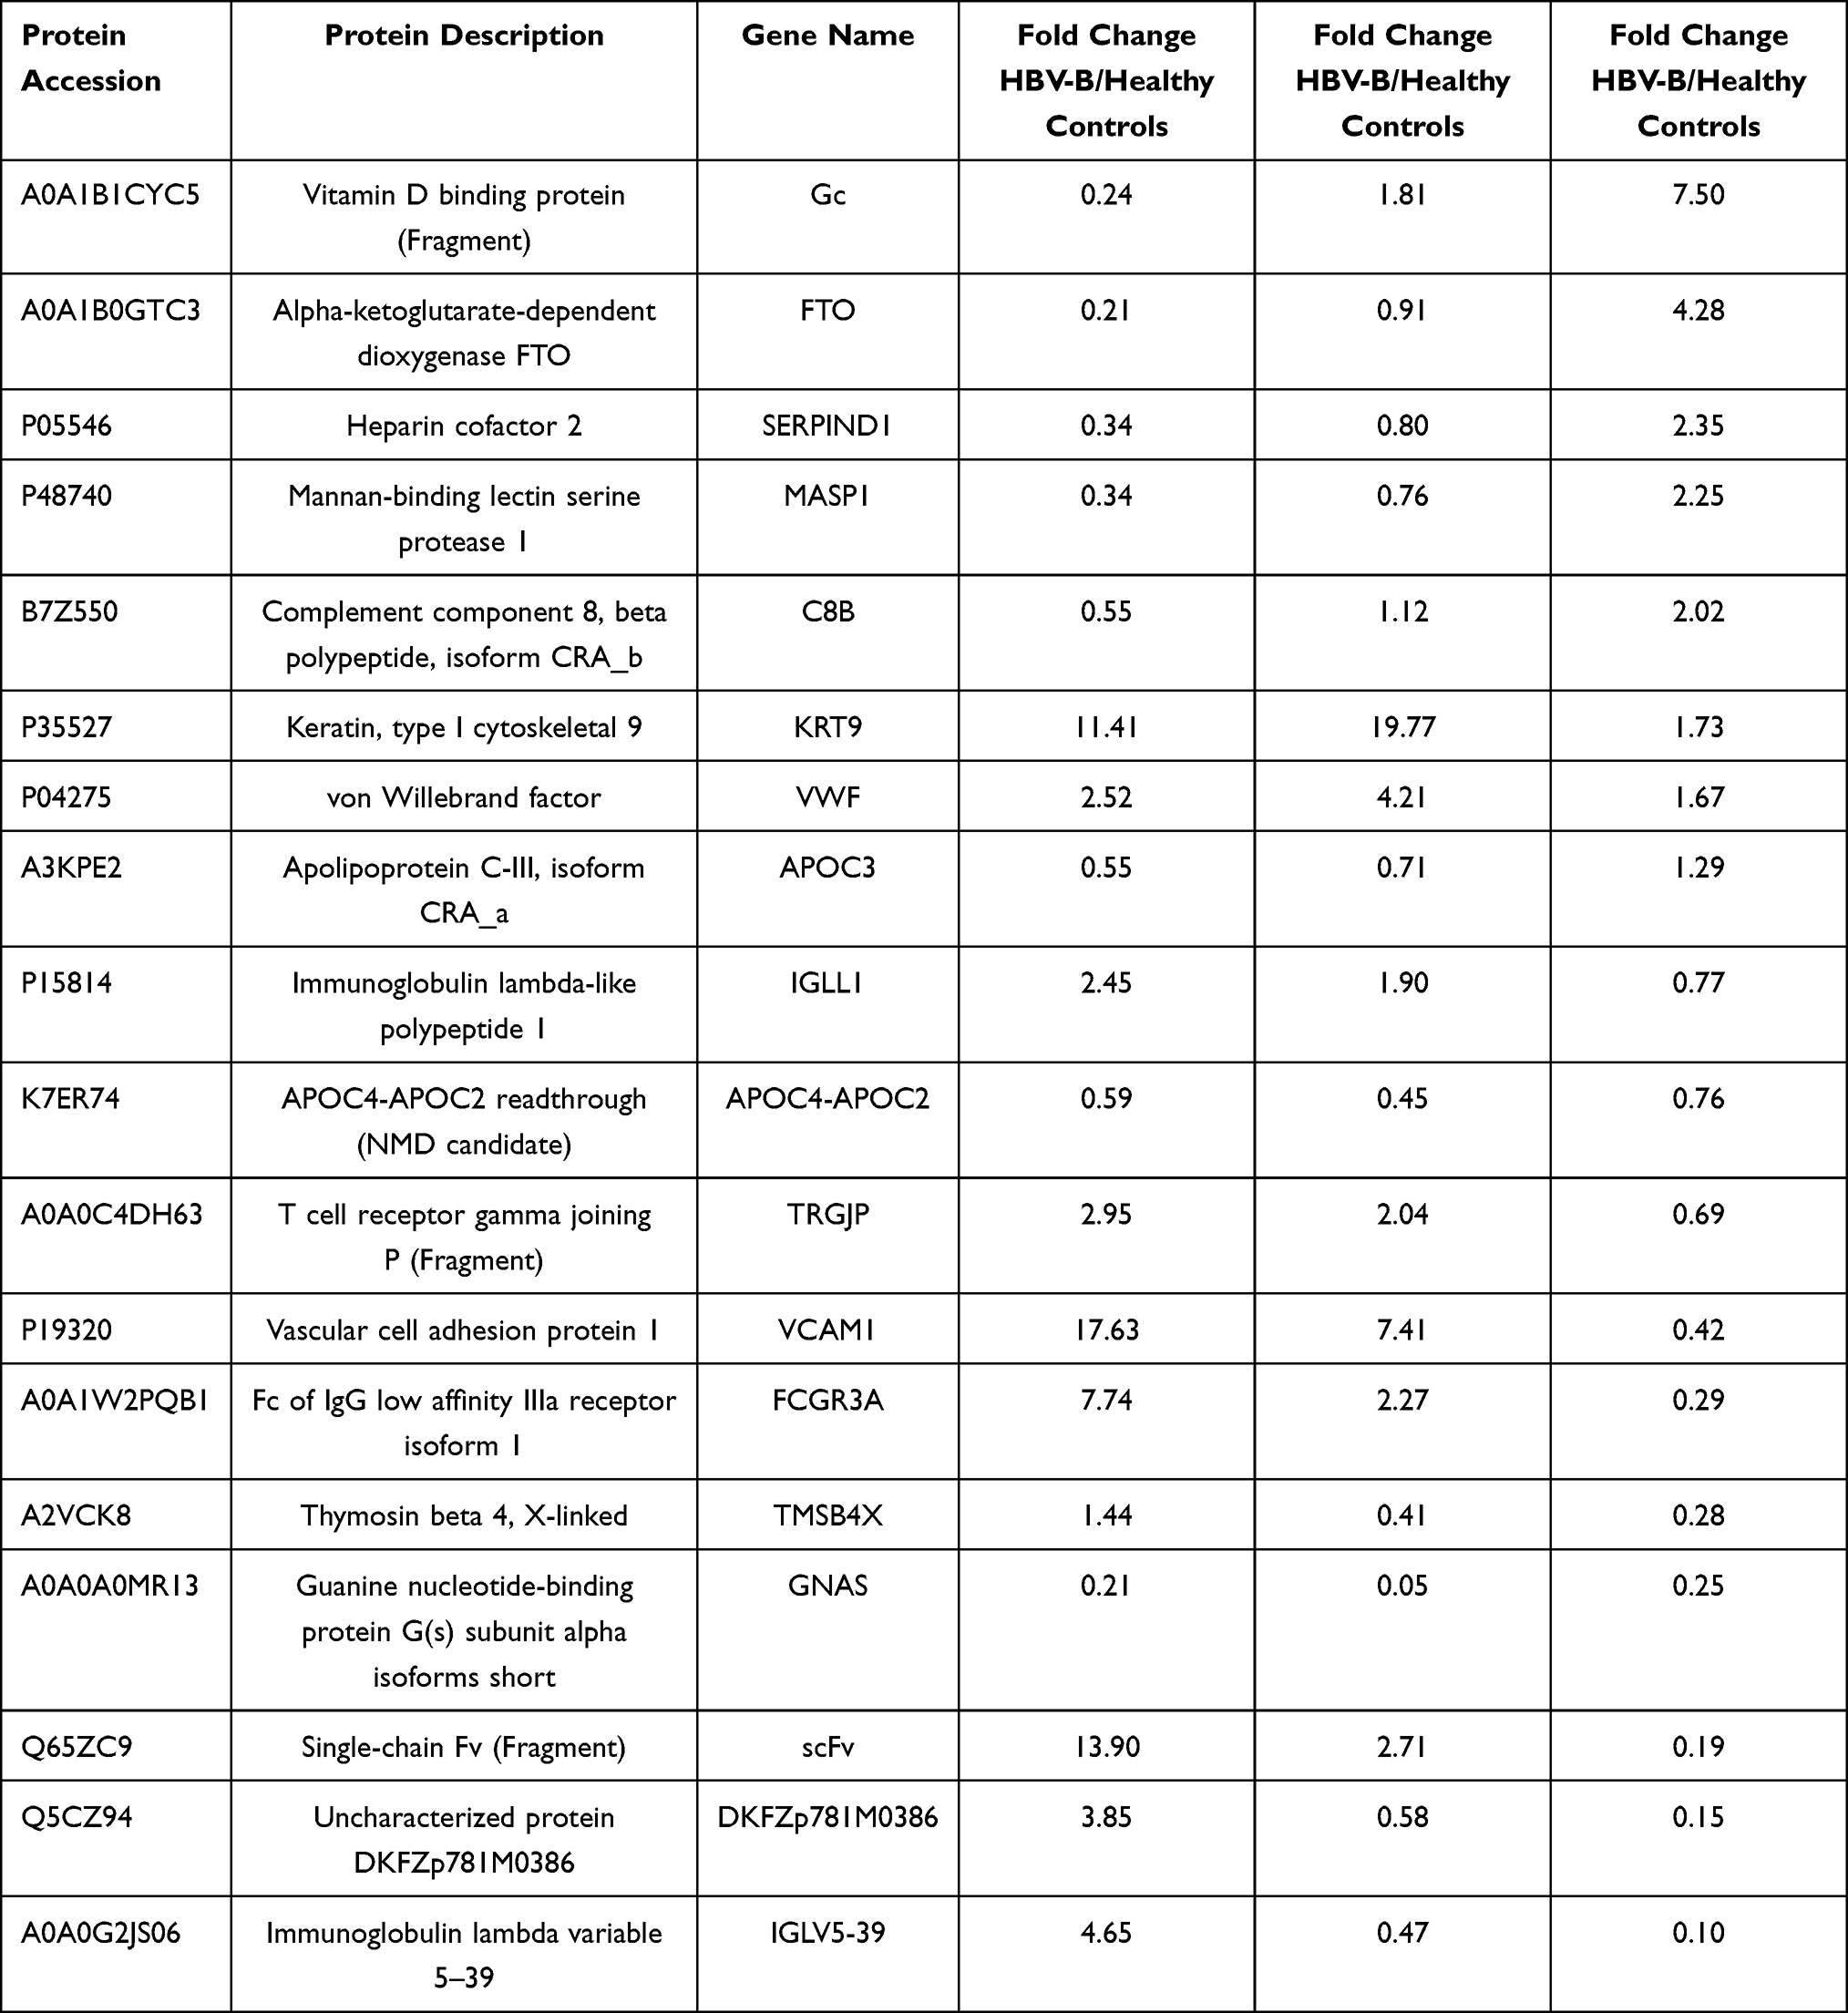 |
Table 2 List of the Typically Differentially Expressed Proteins Between the Serum Samples from HBV Patients Infected with Genotype B and Those Infected Genotype C |
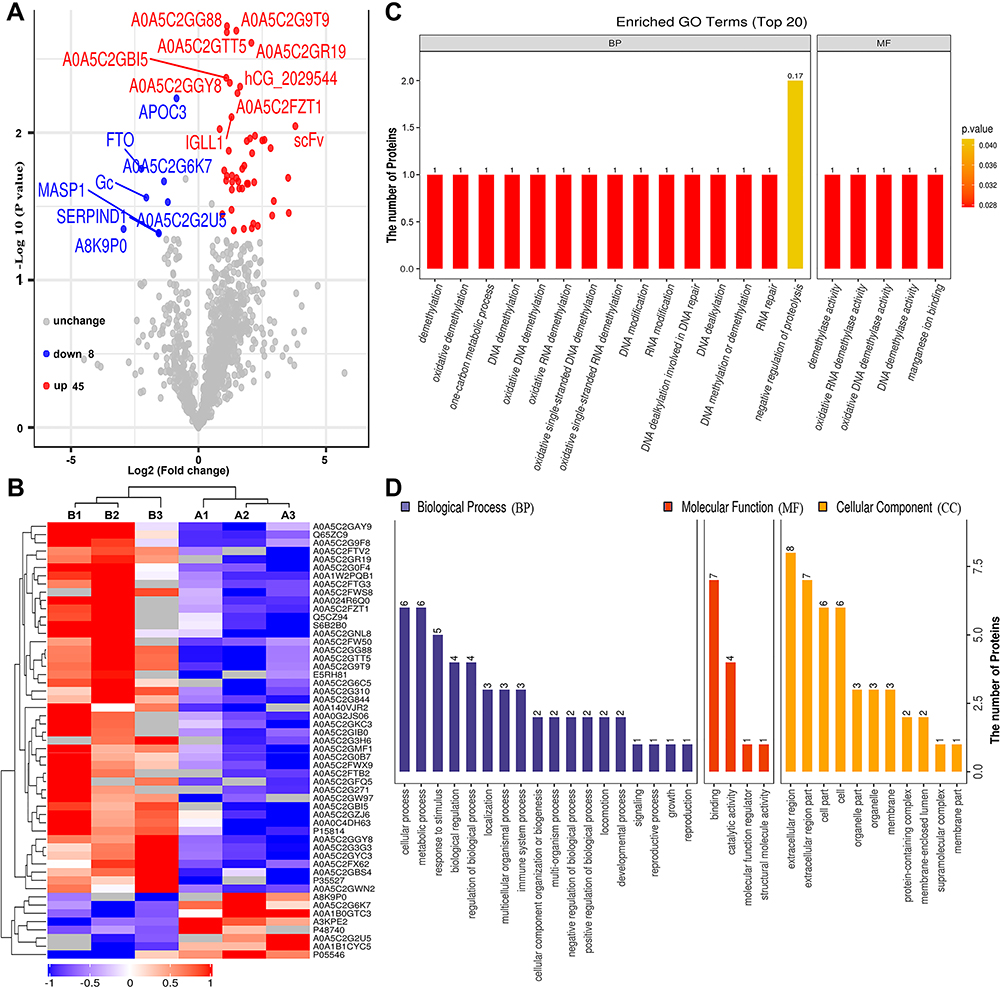 |
Figure 2 Bioinformatics analysis of differentially expressed proteins between the serum samples of the healthy controls and those of HBV-genotype B infected patients. (A) Volcano plot representing the protein abundance changes (groups B vs A). A total of 53 dysregulated proteins with fold change ≥±1.5 and p-values < 0.05 were identified. (B) Hierarchical clustering of the 53 dysregulated proteins (groups B vs A). (C) GO analysis of 53 dysregulated proteins (groups B vs A). The abscissa represents enriched GO function classifications, which were divided into three major categories: biological process (BP), molecular function (MF) and cellular component (CC). (D) KOG analysis of 53 dysregulated proteins (groups B vs A). |
Similarly, we undertook a comparative analysis between the serum samples of the HBV-C and healthy control groups (Groups C vs A) based on the abovementioned criteria (Figure 3A, Table S2). As shown in Figure 3A and B, 59 proteins were classified as differentially expressed (37 upregulated and 22 downregulated) between the serum of patients in the HBV-C group and that of healthy controls forming distinct clusters. Under biological processes, GO enrichment analysis indicated that the dysregulated proteins were mainly associated with cellular processes (n = 6), biological regulation (n = 5), and multicellular organismal processes (n = 5) (Figure 3C and D). For molecular functions, most of the aberrantly expressed proteins were primarily associated with binding (n = 9). The 59 differentially expressed proteins were also classified according to subcellular localization, and each protein was assigned to at least one term. Six proteins were annotated as belonging to the cell part, and the other four main cellular component terms associated with these proteins were the extracellular region part (n = 6), organelle (n = 6), cell extracellular region (n = 6), and organelle part (n = 6). These results also suggested that biological processes and molecular functions are indeed extensively differentially regulated between HBV patients with genotype B infection and those with genotype C infection, indicating that differential molecular characteristics are associated with infections with HBV infection with the two genotypes.
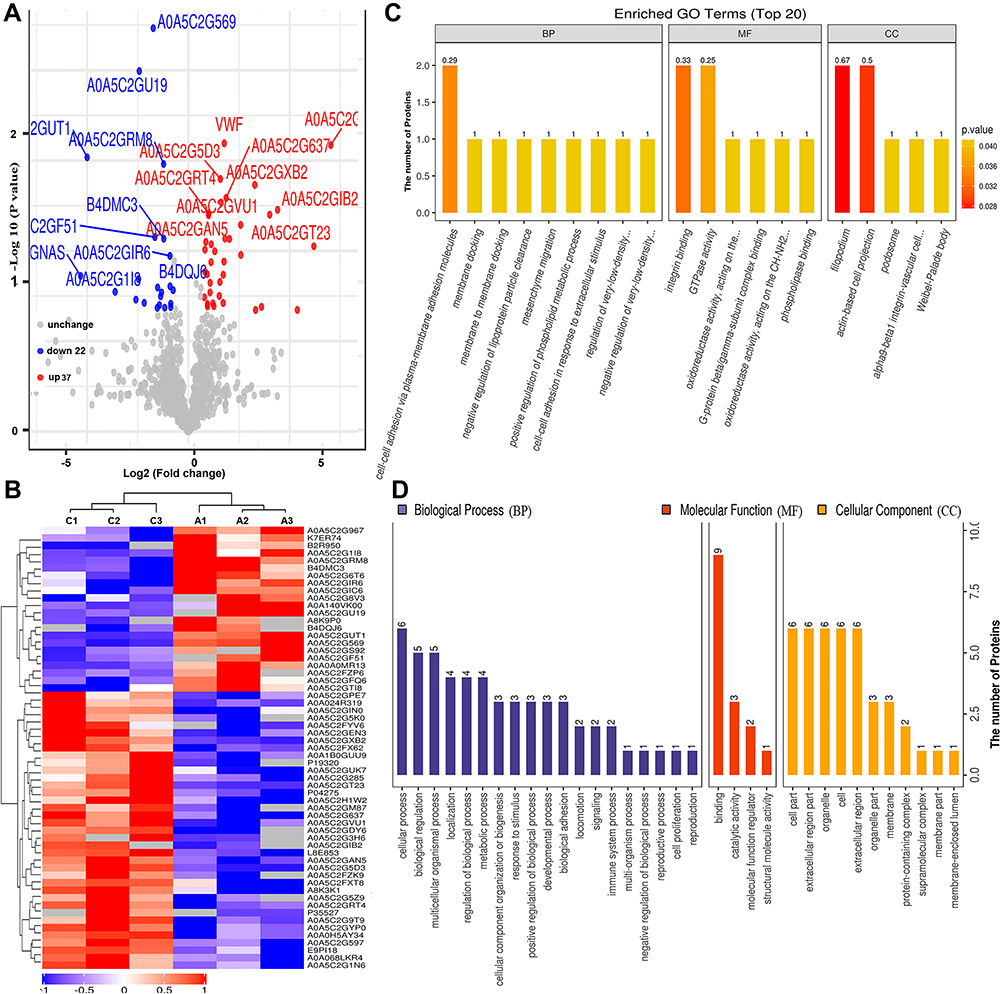 |
Figure 3 Bioinformatics analysis of differentially expressed proteins between the serum samples of the healthy controls and those of HBV-genotype C infected patients. (A) Volcano plot representing the protein abundance changes (groups C vs A). A total of 59 dysregulated proteins with fold change ≥±1.5 and p-values < 0.05 were identified. (B) Hierarchical clustering of the 66 dysregulated proteins (groups C vs A). (C) GO analysis of 59 dysregulated proteins (groups C vs A). The abscissa represents enriched GO function classifications, which were divided into three major categories: biological process (BP), molecular function (MF) and cellular component (CC). (D) KOG analysis of 59 dysregulated proteins (groups C vs A). |
KEGG Pathway Analysis of the Differentially Expressed Proteins
To further identify pathways differentially regulated by HBV genotypes B and C infection, we performed KEGG pathway-based enrichment analysis of the differentially expressed proteins. The results showed that specific signaling pathways were indeed involved in the molecular differences in host macromolecular synthesis between patients with HBV genotypes B and C infection, although some common signaling pathways were also identified. KEGG pathway enrichment analysis indicated that the differentially expressed proteins in the serum of patients in the HBV-B group were mostly involved in the regulation of complement and coagulation cascades and Staphylococcus aureus infection, while in the serum of patients in the HBV-C group primarily participated in the NF-κB signaling pathway, PI3K-Akt signaling pathway, focal adhesion, ECM–receptor interaction, cell adhesion, and complement and coagulation cascades (Figures 4 and 5). Interestingly, although all of the abovementioned signaling pathways were found to be differentially regulated between patients infected with the different HBV genotype, only “complement and coagulation cascades” is associated with both genotypes B and C infection. These results demonstrated that in HBV genotypes B and C infection, the complement and coagulation cascade signaling pathway may contribute to the modulation of the host innate immune response against HBV infection by regulating the identified differentially expressed proteins.
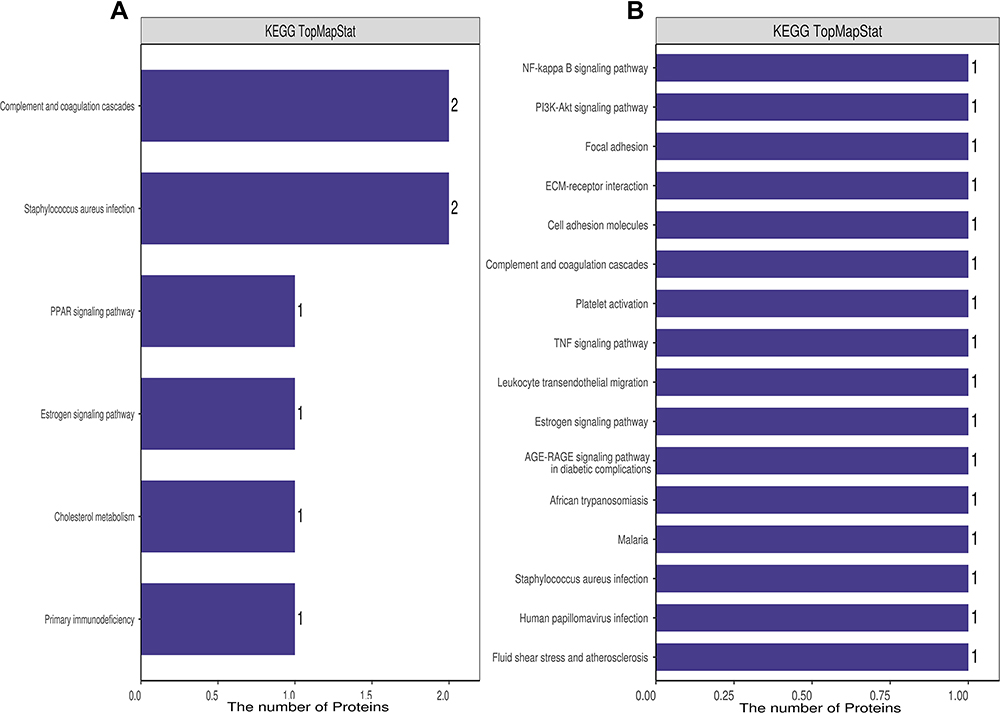 |
Figure 4 KEGG annotation of the dysregulated proteins from groups of healthy control individuals and HBV-B (A) and groups of healthy control individuals and HBV-C (B). |
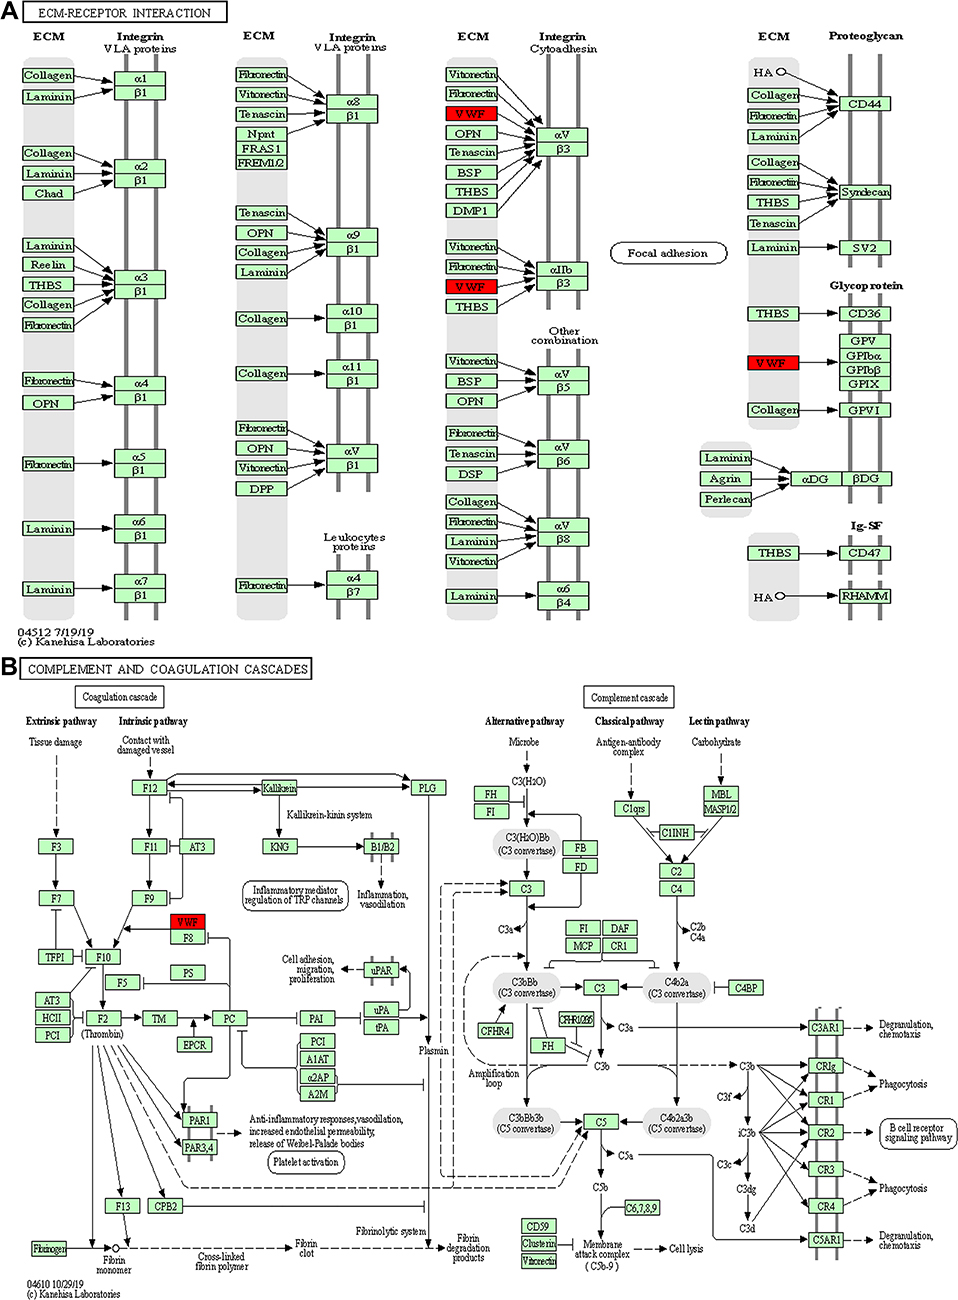 |
Figure 5 Key signaling pathways involved in the serum samples from HBV patients infected with genotype B and those infected genotype C. ECM–receptor interaction (A) and complement and coagulation cascades (B) obtained from KEGG pathway-based enrichment analysis of dysregulated proteins. |
Verification of the Selected Differential Expression of VWF and C8B
Based on the hierarchical clustering analysis results (Figure 3) and key modulated signaling pathways (Figure 5), the von Willebrand factor (VWF, 1.67-fold) and complement C8 beta chain (C8B, 2.02-fold) proteins were differentially expressed in the HBV-C and HBV-B groups of CHB patients. VWF, is a large multimeric glycoprotein that is synthesized predominantly by endothelial cells (ECs) and is constitutively deposited in the subendothelial extracellular matrix (ECM) and released into the plasma in the form of unusually large multimers, VWF predominantly functions in primary hemostasis by mediating platelet adhesion and aggregation at exposed subendothelial sites in damaged blood vessels.31,32 C8B, one of the three subunits of complement component 8 (C8), plays a pivotal role in the formation of the membrane attack complex (MAC) and cell perforation, and mediates the binding of C8 to C5b-7.33 Therefore, these factors might be biomarkers of interest for distinguishing genotypes B and C HBV-infected patients.
The changes in VWF and C8B expression were further verified at the protein level by ELISA using independent sets of 108 serum samples (36 from healthy controls, 36 from patients in the HBV-B group, and 36 from patients in the HBV-C group), and each sample was detected independently without pooling. Figure 6 shows the ELISA results for VWF and C8B expression in serum samples from individual healthy controls and patients in the HBV-B and HBV-C groups. Compared with serum samples from patients in the HBV-B group, both VWF and C8B were significantly up-regulated (2.01 -fold and 2.10 -fold, respectively, n = 36 patients, P < 0.01 for both proteins) in serum samples from patients in the HBV-C group.
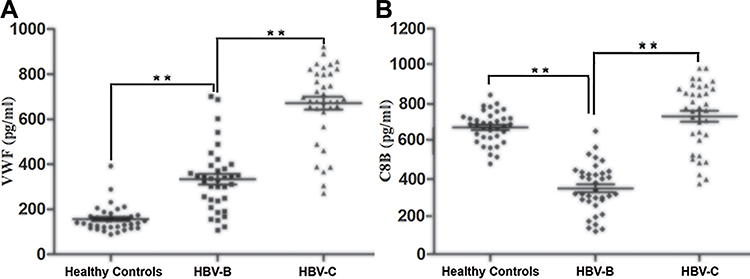 |
Figure 6 Validation of the selected differentially expressed proteins of VWF (A) and C8B (B) in the serum samples from HBV patients infected with genotype B and those infected genotype C by ELISA in the validation cohort. Data are expressed as the mean SEM (n = 36, *P < 0.05, **P < 0.01). |
In summary, we identified differences in the expression of VWF and C8B between CHB patients infected with genotype B and those infected with genotype C, consistent with the results obtained with the DIA-based quantitative proteomic analysis (Figure 3 and Table S2). The findings suggest that these two proteins may serve as biomarkers for distinguishing genotype B and from genotype C HBV-infected patients; however, the associated underlying molecular mechanisms require further investigation.
Discussion
Although the incidence of chronic HBV infection is gradually decreasing, it remains a major public health problem worldwide because of its widespread distribution and associated liver-related morbidity.1,2 HBV genotypes may be responsible for differences in the natural history of chronic HBV infection, and therefore play an important role in the clinical and virologic characteristics of infection, disease progression and response to antiviral therapy.7,34,35 Patients with HBV genotype C infection account for a significant proportion of severe liver disease cases. Moreover, previous studies have confirmed that genotype C represents a risk factor for perinatal infection and is associated with an increased risk of serious complications, including cirrhosis and the development of HCC, compared with genotype B.7,10,17 While much of the existing literature has focused on the disparities between HBV patients with genotype B infection and those with genotype C infection, little is known about the potential mechanisms and the differences in specific biological pathways associated with the different genotypes. To the best of our knowledge, the serum proteomic data presented in this study represent the first to report of the identification of biomarkers that can be used to distinguish between HBV genotypes B and C infection. This study is also the first to describe the differences between HBV genotype-B and genotype-C-infected patients at the proteome level. These results not only confirm those of earlier studies, namely, that the HBV genotype correlates with its clinical manifestation and that infection with HBV genotype C can lead to more severe hepatitis when compared with genotype B, but also provide new information regarding the molecular differences between infection with HBV genotypes B and C. These novel findings are likely to facilitate further detailed investigation relating to HBV genotype-specific pathology.
In the present study, using a DIA-MS-based quantitative proteomic approach, we performed a comparative analysis of the whole serum proteome of samples to obtain insights into the differential pathophysiology of HBV infection between patients with genotype B and those with genotype C. We quantified a total of 1923 proteins at an FDR of <1%, which is relatively high when compared with other studies that have taken serum proteomics analyses.36,37 Among the identified proteins, 63.72% were shared among all three groups, which strongly supported the stability of the work flow and the reliability of the research conclusions. Significant differences among the healthy control, HBV-B and HBV-C groups at the molecular level were identified through the comprehensive analysis of the differentially expressed proteins involved in signaling pathways. Based on the identification criteria for dysregulated proteins (fold change ≥± 1.5, P < 0.05), 53 differentially expressed proteins between the HBV-B and healthy control groups and 59 between the HBV-C and healthy control groups were identified in the serum samples. Although all the signaling pathways associated with the abovementioned dysregulated proteins are key players in the course of infection with genotypes B and C, only the complement and coagulation cascade signaling pathway was found to be extensively involved in both comparison groups (healthy control vs HBV-B groups, healthy control vs HBV-C groups) of CHB patients. This finding demonstrated that in patients infected with HBV genotypes B and C, the complement and coagulation cascade signaling pathway may contribute to the modulation of clinical features and progression of hepatitis B disease during the infectious process.
The complement and coagulation cascades, which function as major proteolytic cascades in blood serum, are consist of a large number of soluble plasma proteins and receptors.38 The complement and coagulation cascades are reported to be key mediators of host innate immunity and adaptive immune system responses against pathogens including HBV infection. These cascades be mediated through three distinct target recognition pathways, namely, the classical pathway (CP), which is activated via antigen-antibody complexes or by C-reactive protein, the lectin pathway (LP) triggered via any permissive surfaces and the alternative pathway (AP), which involves direct activation of C3 and then C5.38,39 In the context of viral infections, activated complement and coagulation cascades are not merely processes reactive to inflammation and immunity, but are also critical determinants of viral dissemination, the magnitude of pathogenesis, and liver disease pathogenesis.40–42 Our data support that the clinical manifestation of HBV infection with genotypes B and C are strongly dependent on the degree of complement and coagulation cascade signaling pathway activation or inhibition, which explains the involvement of this signaling pathway in both groups.
VWF expression was significantly up-regulated in the serum samples of patients in the HBV-C group compared with that in the samples from healthy controls and patients in the HBV-B group. VWF is synthesized in ECs of blood vessels for normal hemostatic function and is stored in platelet α-granules as unusually large multimers that are secreted in response to thrombogenic stimuli.31,32 The size of the VWF multimers suggests that they perform an important pathophysiological function in complement and coagulation cascade activation, that is, smaller VWF multimers enhance the cleavage of C3b, whereas large and ultra-large VWF (ULVWF) multimers do not affect C3b cleavage, instead facilitating default complement activation.43 Moreover, C3b binds to ULVWF multimeric strings secreted by and anchored to the surfaces of stimulated ECs to promote AP C3 convertase (C3bBb) and C5 convertase (C3bBb3b) activation.44,45 Meanwhile, it has also been reported that VWF is associated with liver fibrosis progression in chronic hepatitis and is inversely correlated with albumin levels, prothrombin time, and platelet count through angiogenesis and apoptosis, which is crucial for HCC development.31,46 Consistent with these functions, dyregulated VWF expression in the complement and coagulation cascades can influence susceptibility to complement-mediated liver fibrosis and HCC in patients with HBV. The results of this study indicated that the upregulation of VWF expression may increase AP-associated transcriptional activation via the formation of C3 and C5 convertases in the serum of patients with HBV-genotype C compared with that in the serum of patients with HBV-genotype B and healthy controls. Activated AP may play a role in promoting liver fibrosis through the assembly and activation of C3bBb and C3bBb3b because AP activation is required for the upregulation of many proteins, such as VWF.
The expression of C8B was also significantly upregulated in the serum of patients from the HBV-C group compared with that the serum of patients in the HBV-B group. C8B is the main component of the MAC and serves as an important innate immune effector that forms cytotoxic pores on the surface of bacteria and enveloped viruses following complement activation.33,47 Recent studies exploring the roles of C8B in patients with HBV related HCC revealed that high levels of C8B contributed to favorable overall survival and recurrence-free survival, even after adjusting for clinicopathological characteristics such as tumor node metastasis staging, Barcelona Clinic liver cancer staging, sex, and fibrinogen beta chain (FGB) expression.48 The complement and coagulation cascade signaling pathway performs a vital effector function in the innate immune system by providing an efficient means for targeting and eliminating infected cells and invading microorganisms. Accordingly, the KEGG pathway analysis results showed that many proteins associated with those functions, including C8B, were dysregulated in our study. In addition, consistent with these collective findings, our observations indicated that the upregulation of C8B and other soluble regulators of the complement and coagulation cascades pathway, including VWF, may enhance the activation of the complement and coagulation cascade signaling pathway in serum samples from genotype C HBV-infected patients relative to that in serum samples from patients infected with HBV genotype B. This suggests that the expression levels of VWF and C8B might be potential biomarkers for distinguishing genotypes B and C infection. These serum biomarkers may aid in the diagnosis of infection with HBV-genotype C, which may be of benefit to disease prevention and control. However, the mechanisms underlying how VWF and C8B regulate the complement and coagulation cascades during the disease course remain uncertain.
Overall, we profiled serum proteins from healthy controls and patients with HBV genotypes B and C and identified two potential biomarkers and possible therapeutic targets for the treatment of genotypes B and C HBV infection-related disease. However, this study had several limitations. The present study consisted of a relatively small sample size of patients with HBV genotypes B and C. Additionally, DIA-based MS analysis was performed on relatively few serum samples, and only the differential protein expression was outlined. It is necessary to investigate the functions of the key dysregulated proteins through studies involving large sample sizes.
Conclusion
Here, we applied DIA-based MS analysis to assess the differences in the serum proteome profiles among healthy controls, HBV patients with genotype B, and those with genotype C. As expected, our results clearly demonstrated that HBV genotypes B and C infection are associated with differential protein profiles and signaling pathway. To verify these results, the differences in the expression levels of VWF and C8B in samples from patients with genotypes B and C infection were investigated by ELISA. Taken together, although the analysis of quantitative proteomic analysis remains mostly descriptive, the results of the present study provide insight into molecular differences among individuals infected with HBV genotypes B and C and suggest the potential application of the dysregulated proteins associated with complement and coagulation cascades signaling pathway such as VWF and C8B proteins as biomarkers for distinguishing individuals infected with HBV genotype B from those infected with genotype C.
Acknowledgments
This work was supported by Zhejiang Provincial Medical Scientific Research Foundation of China under Grant No. 2021KY1108, Zhejiang Provincial Natural Science Foundation of China under Grant No. LY20C010004, 2019 Jiaxing Key Discipline of Medicine-Lemology (Supporting Subject, Grant No. 2019-zc-02), and the Construction Project of Key Laboratory of Infectious Disease Involved in Viruses in Jiaxing City.
Disclosure
The authors report no conflicts of interest in this work.
References
1. Seto WK, Lo YR, Pawlotsky JM, et al. Chronic hepatitis B virus infection. Lancet. 2018;392(10161):2313–2324. doi:10.1016/S0140-6736(18)31865-8.
2. Yuen MF, Chen DS, Dusheiko GM, et al. Hepatitis B virus infection. Nat Rev Dis Primers. 2018;4:18035. doi:10.1038/nrdp.2018.35.
3. Hepatitis B: key facts. Geneva: World Health Organization; 2020 Available from: https://www.who.int/en/news-room/fact-sheets/detail/hepatitis-b.
4. Gao Q, Zhu H, Dong L, et al. Integrated Proteogenomic Characterization of HBV-Related Hepatocellular Carcinoma. Cell. 2019;179(2):561–577.e22. doi:10.1016/j.cell.2019.08.052.
5. Sunbul M. Hepatitis B virus genotypes: global distribution and clinical importance. World J Gastroenterol. 2014;20(18):5427–5434. doi:10.3748/wjg.v20.i18.5427.
6. Velkov S, Protzer U, Michler T. Global Occurrence of Clinically Relevant Hepatitis B Virus Variants as Found by Analysis of Publicly Available Sequencing Data. Viruses. 2020;12(11):1344. doi:10.3390/v12111344.
7. Lin CL, Kao JH. Natural history of acute and chronic hepatitis B: the role of HBV genotypes and mutants. Best Pract Res Clin Gastroenterol. 2017;31(3):249–255. doi:10.1016/j.bpg.2017.04.010.
8. Liu J, Liang W, Jing W, et al. Countdown to 2030: eliminating hepatitis B disease, China. Bull World Health Organ. 2019;97(3):230–238. doi:10.2471/BLT.18.219469.
9. Wei DH, Liu HZ, Huang AM, et al. A new trend of genotype distribution of hepatitis B virus infection in southeast China (Fujian), 2006–2013. Epidemiol Infect. 2015;143(13):2822–2826. doi:10.1017/S0950268815000059.
10. An P, Xu J, Yu Y, et al. Host and Viral Genetic Variation in HBV-Related Hepatocellular Carcinoma. Front Genet. 2018;9:261. doi:10.3389/fgene.2018.00261.
11. Lin CL, Kao JH. Hepatitis B virus genotypes and variants. Cold Spring Harb Perspect Med. 2015;5(5):a021436. doi:10.1101/cshperspect.a021436.
12. Pujol F, Jaspe RC, Loureiro CL, et al. Hepatitis B virus American genotypes: pathogenic variants? Clin Res Hepatol Gastroenterol. 2020;44(6):825–835. doi:10.1016/j.clinre.2020.04.018.
13. Kao JH, Chen PJ, Lai MY, et al. Basal core promoter mutations of hepatitis B virus increase the risk of hepatocellular carcinoma in hepatitis B carriers. Gastroenterology. 2003;124(2):327–334. doi:10.1053/gast.2003.50053.
14. Zhao J, Guo Y, Yan Z, et al. The natural YMDD mutations of hepatitis B virus in Western China. Scand J Infect Dis. 2012;44(1):44–47. doi:10.3109/00365548.2011.598871.
15. Chu CJ, Hussain M, Lok AS. Hepatitis B virus genotype B is associated with earlier HBeAg seroconversion compared with hepatitis B virus genotype C. Gastroenterology. 2002;122(7):1756–1762. doi:10.1053/gast.2002.33588.
16. Xibing G, Xiaojuan Y, Juanhua W, et al. Relationship between HBV genotypes B, C and follicular helper T cells in patients with chronic hepatitis B and its significance. Hepat Mon. 2013;13(1):e6221. doi:10.5812/hepatmon.6221.
17. Haga H, Saito T, Okumoto K, et al. Incidence of development of hepatocellular carcinoma in Japanese patients infected with hepatitis B virus is equivalent between genotype B and C in long term. J Viral Hepat. 2019;26(7):866–872. doi:10.1111/jvh.13099.
18. Wai CT, Chu CJ, Hussain M, et al. HBV genotype B is associated with better response to interferon therapy in HBeAg(+) chronic hepatitis than genotype C. Hepatology. 2002;36(6):1425–1430. doi:10.1053/jhep.2002.37139.
19. Mitra B, Thapa RJ, Guo H, et al. Host functions used by hepatitis B virus to complete its life cycle: implications for developing host-targeting agents to treat chronic hepatitis B. Antiviral Res. 2018;158:185–198. doi:10.1016/j.antiviral.2018.08.014.
20. Wei D, Zhang X. Proteomic analysis of interactions between a deep-sea thermophilic bacteriophage and its host at high temperature. J Virol. 2010;84(5):2365–2373. doi:10.1128/JVI.02182-09.
21. Tong S, Revill P. Overview of hepatitis B viral replication and genetic variability. J Hepatol. 2016;64(1 Suppl):S4–S16. doi:10.1016/j.jhep.2016.01.027.
22. Saxena R, Kaur J. Th1/Th2 cytokines and their genotypes as predictors of hepatitis B virus related hepatocellular carcinoma. World J Hepatol. 2015;7(11):1572–1580. doi:10.4254/wjh.v7.i11.1572.
23. Yuen MF, Wong DK, Zheng BJ, et al. Difference in T helper responses during hepatitis flares in hepatitis B e antigen (HBeAg)-positive patients with genotypes B and C: implication for early HBeAg seroconversion. J Viral Hepat. 2007;14(4):269–275. doi:10.1111/j.1365-2893.2006.00799.x.
24. Han YF, Zhao J, Ma LY, et al. Factors predicting occurrence and prognosis of hepatitis-B-virus-related hepatocellular carcinoma. World J Gastroenterol. 2011;17(38):4258–4270. doi:10.3748/wjg.v17.i38.4258.
25. Wei D, Zeng Y, Xing X, et al. Proteome Differences between Hepatitis B Virus Genotype-B- and Genotype-C-Induced Hepatocellular Carcinoma Revealed by iTRAQ-Based Quantitative Proteomics. J Proteome Res. 2016;15(2):487–498. doi:10.1021/acs.jproteome.5b00838.
26. Khodadadi E, Zeinalzadeh E, Taghizadeh S, et al. Proteomic Applications in Antimicrobial Resistance and Clinical Microbiology Studies. Infect Drug Resist. 2020;13:1785–1806. doi:10.2147/IDR.S238446.
27. Huang J, Yin X, Zhang L, et al. Serum proteomic profiling in patients with advanced Schistosoma japonicum-induced hepatic fibrosis. Parasit Vectors. 2021;14(1):232. doi:10.1186/s13071-021-04734-1.
28. Shen Y, Xun J, Song W, et al. Discovery of Potential Plasma Biomarkers for Tuberculosis in HIV-Infected Patients by Data-Independent Acquisition-Based Quantitative Proteomics. Infect Drug Resist. 2020;13:1185–1196. doi:10.2147/IDR.S245460.
29. Sajic T, Liu Y, Aebersold R. Using data-independent, high-resolution mass spectrometry in protein biomarker research: perspectives and clinical applications. Proteomics Clin Appl. 2015;9(3–4):307–321. doi:10.1002/prca.201400117.
30. Bruderer R, Muntel J, Müller S, et al. Analysis of 1508 Plasma Samples by Capillary-Flow Data-Independent Acquisition Profiles Proteomics of Weight Loss and Maintenance. Mol Cell Proteomics. 2019;18(6):1242–1254. doi:10.1074/mcp.RA118.001288.
31. Takaya H, Kawaratani H, Tsuji Y, et al. von Willebrand factor is a useful biomarker for liver fibrosis and prediction of hepatocellular carcinoma development in patients with hepatitis B and C. United Eur Gastroenterol J. 2018;6(9):1401–1409. doi:10.1177/2050640618779660.
32. Wang Y, Gallant RC, Ni H. Extracellular matrix proteins in the regulation of thrombus formation. Curr Opin Hematol. 2016;23(3):280–287. doi:10.1097/MOH.0000000000000237.
33. Bubeck D, Roversi P, Donev R, et al. Structure of human complement C8, a precursor to membrane attack. J Mol Biol. 2011;405(2):325–330. doi:10.1016/j.jmb.2010.10.031.
34. Kramvis A. Genotypes and genetic variability of hepatitis B virus. Intervirology. 2014;57(3–4):141–150. doi:10.1159/000360947.
35. Biswas B, Kandpal M, Vivekanandan PA. G-quadruplex motif in an envelope gene promoter regulates transcription and virion secretion in HBV genotype B. Nucleic Acids Res. 2017;45(19):11268–11280. doi:10.1093/nar/gkx823.
36. Murphy S, Zweyer M, Mundegar RR, et al. Proteomic serum biomarkers for neuromuscular diseases. Expert Rev Proteomics. 2018;15(3):277–291. doi:10.1080/14789450.2018.1429923.
37. Chen Y, Huang A, Ao W, et al. Proteomic analysis of serum proteins from HIV/AIDS patients with Talaromyces marneffei infection by TMT labeling-based quantitative proteomics. Clin Proteomics. 2018;15:40. doi:10.1186/s12014-018-9219-8.
38. Conway EM. Complement-coagulation connections. Blood Coagul Fibrinolysis. 2018;29(3):243–251. doi:10.1097/MBC.0000000000000720.
39. Qin X, Gao B. The complement system in liver diseases. Cell Mol Immunol. 2006;3(5):333–340.
40. Mellors J, Tipton T, Longet S, et al. Viral Evasion of the Complement System and Its Importance for Vaccines and Therapeutics. Front Immunol. 2020;11:1450. doi:10.3389/fimmu.2020.01450.
41. Ling M, Murali M. Analysis of the Complement System in the Clinical Immunology Laboratory. Clin Lab Med. 2019;39(4):579–590. doi:10.1016/j.cll.2019.07.006.
42. Nag J, Mukesh RK, Suma SM, et al. A Factor I-Like Activity Associated with Chikungunya Virus Contributes to Its Resistance to the Human Complement System. J Virol. 2020;94(7):e02062–19. doi:10.1128/JVI.02062-19.
43. Feng S, Liang X, Kroll MH, et al. von Willebrand factor is a cofactor in complement regulation. Blood. 2015;125(6):1034–1037. doi:10.1182/blood-2014-06-585430.
44. Turner NA, Moake J. Assembly and activation of alternative complement components on endothelial cell-anchored ultra-large von Willebrand factor links complement and hemostasis-thrombosis. PLoS One. 2013;8(3):e59372. doi:10.1371/journal.pone.0059372.
45. Nolasco JG, Nolasco LH, Da Q, et al. Complement Component C3 Binds to the A3 Domain of von Willebrand Factor. TH Open. 2018;2(3):e338–e345. doi:10.1055/s-0038-1672189.
46. Takaya H, Namisaki T, Kitade M, et al. VWF/ADAMTS13 ratio as a potential biomarker for early detection of hepatocellular carcinoma. BMC Gastroenterol. 2019;19(1):167. doi:10.1186/s12876-019-1082-1.
47. Franc V, Zhu J, Heck AJR. Comprehensive Proteoform Characterization of Plasma Complement Component C8αβγ by Hybrid Mass Spectrometry Approaches. J Am Soc Mass Spectrom. 2018;29(6):1099–1110. doi:10.1007/s13361-018-1901-6.
48. Zhang Y, Chen X, Cao Y, et al. C8B in Complement and Coagulation Cascades Signaling Pathway is a predictor for Survival in HBV-Related Hepatocellular Carcinoma Patients. Cancer Manag Res. 2021;13:3503–3515. doi:10.2147/CMAR.S302917.
 © 2021 The Author(s). This work is published and licensed by Dove Medical Press Limited. The
full terms of this license are available at https://www.dovepress.com/terms
and incorporate the Creative Commons Attribution
- Non Commercial (unported, 3.0) License.
By accessing the work you hereby accept the Terms. Non-commercial uses of the work are permitted
without any further permission from Dove Medical Press Limited, provided the work is properly
attributed. For permission for commercial use of this work, please see paragraphs 4.2 and 5 of our Terms.
© 2021 The Author(s). This work is published and licensed by Dove Medical Press Limited. The
full terms of this license are available at https://www.dovepress.com/terms
and incorporate the Creative Commons Attribution
- Non Commercial (unported, 3.0) License.
By accessing the work you hereby accept the Terms. Non-commercial uses of the work are permitted
without any further permission from Dove Medical Press Limited, provided the work is properly
attributed. For permission for commercial use of this work, please see paragraphs 4.2 and 5 of our Terms.