Back to Journals » Diabetes, Metabolic Syndrome and Obesity » Volume 16
Comparative Analysis of Red Blood Cells, White Blood Cells, Platelet Count, and Indices in Type 2 Diabetes Mellitus Patients and Normal Controls: Association and Clinical Implications
Authors Essawi K ![]() , Dobie G
, Dobie G ![]() , Shaabi MF, Hakami W, Saboor M
, Shaabi MF, Hakami W, Saboor M ![]() , Madkhali AM, Hamami AA, Allallah WH, Akhter MS
, Madkhali AM, Hamami AA, Allallah WH, Akhter MS ![]() , Mobarki AA, Hamali HA
, Mobarki AA, Hamali HA ![]()
Received 10 June 2023
Accepted for publication 4 September 2023
Published 6 October 2023 Volume 2023:16 Pages 3123—3132
DOI https://doi.org/10.2147/DMSO.S422373
Checked for plagiarism Yes
Review by Single anonymous peer review
Peer reviewer comments 2
Editor who approved publication: Prof. Dr. Antonio Brunetti
Khaled Essawi,1 Gasim Dobie,1 Misk F Shaabi,1 Waleed Hakami,1 Muhammad Saboor,2 Aymen M Madkhali,1 Abdullah AH Hamami,3 Wael H Allallah,3 Mohammad S Akhter,1 Abdullah A Mobarki,1 Hassan A Hamali1
1Department of Medical Laboratory Technology, College of Applied Medical Sciences, Jazan University, Jazan, Saudi Arabia; 2Department of Medical Laboratory Sciences, College of Health Sciences, University of Sharjah, Sharjah, United Arab Emirates; 3Department of Laboratory & Blood Bank, Prince Mohammed bin Nasser Hospital, Ministry of Health, Jazan, Saudi Arabia
Correspondence: Hassan A Hamali, Department of Medical Laboratory Technology, Faculty of Applied Medical Sciences, Jazan University, P.O. Box 1906, Gizan, 45142, Saudi Arabia, Email [email protected]
Background: Diabetes mellitus (DM) is a major health burden affecting 537 million adults worldwide, characterized by chronic metabolic disorder and various complications. This case control study aimed to assess the impact of type 2 diabetes mellitus (T2DM), including hyperglycemia levels, on hematological parameters and complete blood count (CBC) derived parameters.
Methods: A total of 250 known diabetic patients from the Jazan Diabetic Center, Saudi Arabia, between January 2021 and December 2022, along with 175 healthy adult controls were recruited from Jazan Hospital’s blood donation center. Demographic characteristics, medical histories, and relevant factors such as gender, age, BMI, treatment, disease duration, and comorbidities were collected with informed consent.
Results: The results of the red blood cell (RBC) count, RBC indices, and mean platelet volume showed significant differences between patients and controls, while the white cell (WBC) and platelet count were comparable between the two groups. CBC-derived parameters, especially neutrophil/lymphocyte ratio (NLR), and platelet/neutrophil ratio (PNR) exhibited significant differences.
Conclusion: CBC and derived parameters serve as inexpensive tools for T2DM patients monitoring, indicating early blood cell alterations and potential development of anemia. Further studies are needed to explore their role in predicting T2DM pathogenesis and progression, aiming to reduce severe complications, mortality and morbidity.
Keywords: diabetes mellitus, complete blood count, neutrophil/lymphocyte ratio, platelet/lymphocyte ratio, platelet/neutrophil ratio, mean platelet volume/platelet count, disease complication
Introduction
Diabetes mellitus (DM) is one of the most prevalent disease, affecting 537 million adults worldwide. It is a significant health and financial burden on all countries, costing more than 966 billion US dollars in health expenses. In 2021, it caused 6.7 million deaths globally.1 The most common type of diabetes in adults is type 2 DM (T2DM). It is a chronic metabolic disorder characterized by insufficient insulin production or insulin resistance, both of which lead to chronic elevations in blood glucose levels (hyperglycemia). Chronic hyperglycemia induces many physiological and pathological processes, including oxidative stress, which affects the glycation of lipids and proteins in the cells, lipid metabolism, inflammatory response, cell replication, cell growth, and immunological and hematological parameters, which are clearly observed in poorly controlled diabetic patients.2 The increased oxidative stress induces hematological alteration, which affects the function, structure, and metabolism of red blood cells (RBCs), white blood cells (WBCs), and platelets.3 Additionally, chronic hyperglycemia causes vascular damage, leading to micro- and macrovascular consequences, such as diabetic microangiopathy, retinopathy, neuropathy, nephropathy, and cardiovascular diseases. Alteration of hematological parameters and indices can be utilized as a reliable indicator of blood changes caused by hyperglycemia as well as a predictor of DM complications.3 The clinical consequences caused by diabetes are responsible for significant morbidity and mortality. However, controlling hyperglycemia is the most preventative method to delay/stop the development of T2DM complications. T2DM should be monitored with glycated hemoglobin (HbA1C) to achieve the optimal goal. Controlled T2DM is observed by achieving an HbA1C of 6.5–7% (hence, T2DM should be carefully monitored to achieve the ideal HbA1C range of 6.5–7%). Increased HbA1C levels in DM patients are associated with worse outcomes.4
Complete blood count (CBC) is a simple, routinely requested test in all healthcare facilities. CBC report includes RBC count, RBC indices, WBC count, WBC differential count, platelet count and platelet indices. The effect of DM on hematological parameters has been investigated with controversial findings.5–9 The current study aimed to assess the effect of DM, including hyperglycemia levels, on the hematological parameters, ie, CBC and CBC-derived parameters (including neutrophil/lymphocyte ratio (NLR), platelets/lymphocyte ratio (PLR), platelet/neutrophil ratio (PNR), and mean platelet volume (MPV)/platelet count (MPR)). In addition, the association of HbA1C and demographic characteristics, CBC parameters, and CBC-derived parameters were also investigated in this study.
Materials and Methods
Study Design
The current study was a case-control study of 250 known adult diabetic patients visiting the Jazan Diabetic Center for follow-up, and 175 known adult healthy controls were recruited. This study was conducted between January 2021 and December 2022. The control group were healthy blood donors recruited from the blood donation center at Jazan Hospital, Saudi Arabia. The demographic characteristics and medical histories of the patients and controls, including gender, age, height, weight, calculated body mass index (BMI), treatment, duration of the disease, and comorbidities, were collected.
Blood specimen collection and laboratory analysis.
A venous blood sample of three mL was collected by a well trained and experienced nurse from diabetic patients and healthy controls using vacutainer tubes containing ethylenediaminetetraacetic acid (EDTA) for CBC analysis and HbA1C measurement.
Operational Definitions
Complete Blood Count
The CBC was performed using Sysmex XN–1000 Hematology Analyzer (Kobe, Japan).
Glycated Hemoglobin (HbA1C) Measurement
Glycated hemoglobin was measured using DxC 7000 AU Chemistry analyzer (Beckman Coulter, USA).
Complete Blood Count–Derived Parameters
The parameters derived from CBC were the neutrophil/lymphocyte ratio (NLR), platelet/lymphocyte ratio (PLR), platelet/neutrophil ratio (PNR), and mean platelet volume/platelet count (MPR). These parameters were calculated as described previously.10–12
Classification of HbA1C Based on the Level with CBC Parameters
The study parameters were sub-analyzed based on the levels of HbA1C >9.0%, HbA1C 7.0–9.0%, and HbA1C <7.0%.13
Ethical Consideration
The current study was approved by the Jazan Health Ethics Committee (Reference No: 2038) and conducted in accordance with the Declaration of Helsinki.
Statistical Analysis
GraphPad Prism version 8.0 (GraphPad Software Inc., San Diego, CA, USA) was applied for statistical analysis. The data in the current study are presented as mean ± standard deviation (SD) unless otherwise stated. The unpaired t-test was used for the analysis of normally distributed data and Mann-Whitney was used for the analysis of non-normally distributed data. A one-way ANOVA was used to evaluate the association pattern between the studied parameters. Pearson correlation test and Multivariate analyses were performed for the association of baseline variables and comorbidities. Statistical significance was considered when P < 0.05.
Results
Demographic and Clinical Characteristics
Two hundred fifty adult T2DM patients (patient group) and 175 healthy controls (control group) were evaluated (Table 1). The mean age of the patients was 53±12 years, and for controls, it was 32.4±7.2 years; the differences were statistically significant (P<0.0001). The mean duration of diabetes incidence in the patient group was 12±7.4 years. The BMI in the patients was higher compared to the controls (29.7±11.7 vs 27.6±6.8; P=0.0504). HbA1C was significantly higher in the patients compared to controls (9.2%±2.2 vs 5.3%±0.7; P<0.0001).
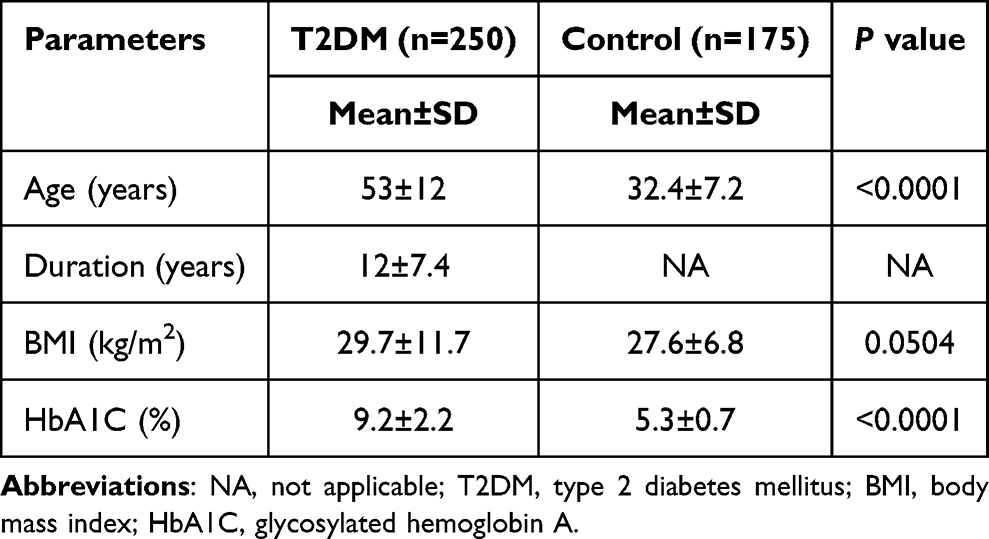 |
Table 1 Demographic Characteristics of the Study Participants (Patients with Type 2 Diabetes Mellitus n=250 and Healthy Controls n=175) |
Comorbidities Among the Patient Group
The comorbidities among T2DM were present in 132 patients (52.8%) with chronic disease, whereas 118 patients (47.2%) had no history of chronic diseases (Table 2). Hypertension (HTN) was the most common comorbidity observed in 121 of the patients (48.2%), followed by chronic kidney disease (CKD) and HTN (1.6%), cardiovascular disease (CVD) and HTN (1.2%), followed by CVD, CKD, hypothyroidism, Hepatitis B, and HTN with 0.4% for each condition.
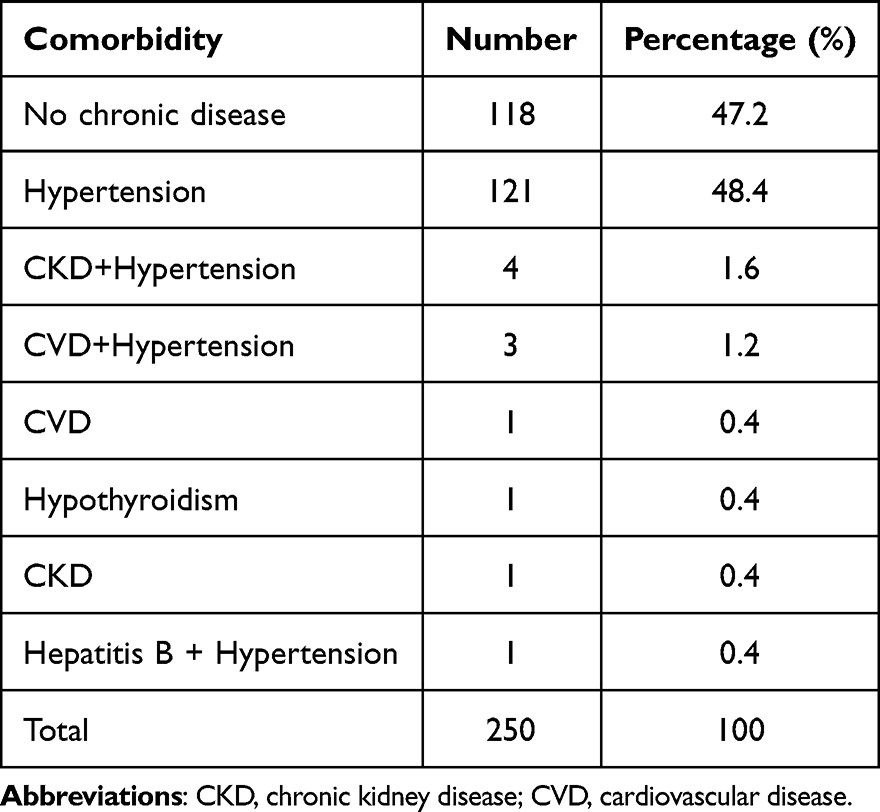 |
Table 2 Prevalence and Patterns of Comorbid Clinical Conditions in the Patient Group with Type 2 Diabetes Mellitus (n=250) |
Comparison of Hematological Parameters
Red Blood Cell Count and Red Blood Cell Indices
The results of the RBC count and RBC indices showed significant differences between patients and controls (P<0.01; Table 3). Red blood cells (RBCs), hemoglobin (Hb), hematocrit (HCT), mean cell volume (MCV), mean cell hemoglobin (MCH), and red blood cell distribution width (RDW) were significantly lower in the diabetic patients compared to controls, whereas mean cell hemoglobin concentration (MCHC) was higher in T2DM patients compared to controls.
 |
Table 3 Complete Blood Count and Complete Blood Count-Calculated Parameters in Patient and Control Groups |
White Blood Cells
The total count of WBCs and absolute lymphocyte count were comparable in the patient and control groups (P>0.05; Table 3). The absolute neutrophil count was significantly higher in patients compared to controls (3.7±1.5 vs 2.9±1.3; P<0.0001), whereas the absolute monocyte count was significantly lower in patients compared to controls (0.2±0.1 vs 0.6±0.2; P<0.0001).
Platelet Count and Indices
Platelet count and plateletcrit (PCT) were comparable in patients and controls (P>0.05; Table 3). Mean platelet volume (MPV) and platelet distribution width (PDW) were significantly lower in patients compared to controls (P<0.01), whereas P-LCR was significantly higher in patients compared to controls (P<0.0001).
Complete Blood Count-Calculated Parameters
NLR and PNR showed statistically significant differences in the patient group compared to the control group (Table 3). The NLR was slightly higher in the patient compared to controls (1.4±0.7 vs 1.2±0.6; P<0.0001). MPR and PLR were comparable among the study groups (P>0.05; Table 3).
Comparison of Hematological Parameters Among Diabetic Patients Based on the HbA1C Levels
Clinical characteristics, hematological data, and CBC-derived parameters were further categorized based on the HbA1C levels into three groups: group 1 HbA1C; < 7.0%, group 2 HbA1C; 7.0–9.0%, and group 3 HbA1C; >9.0% (Table 4). The age difference between the groups was statistically significant. The duration of the disease and HbA1C levels increased significantly from group 1 to group 3 (P<0.04). BMI was higher in group 2 compared to group 1 but lower in group 3 compared to group 2 (P>0.05). Total WBC count was slightly reduced with increasing HbA1C concentration (P>0.05) and a comparable count of neutrophils and monocytes. The RBC count, Hb, RDW, HCT, and RBC indices were compared in all three groups (P>0.05). Platelet count showed a slight increase in group 3 (HbA1C>9.0), whereas MPV, PCT, PDW, and P-LCR were comparable in the three groups. MPR and NLR were comparable in the three groups, whereas PLR and PNR were increased in group 3 (P>0.050).
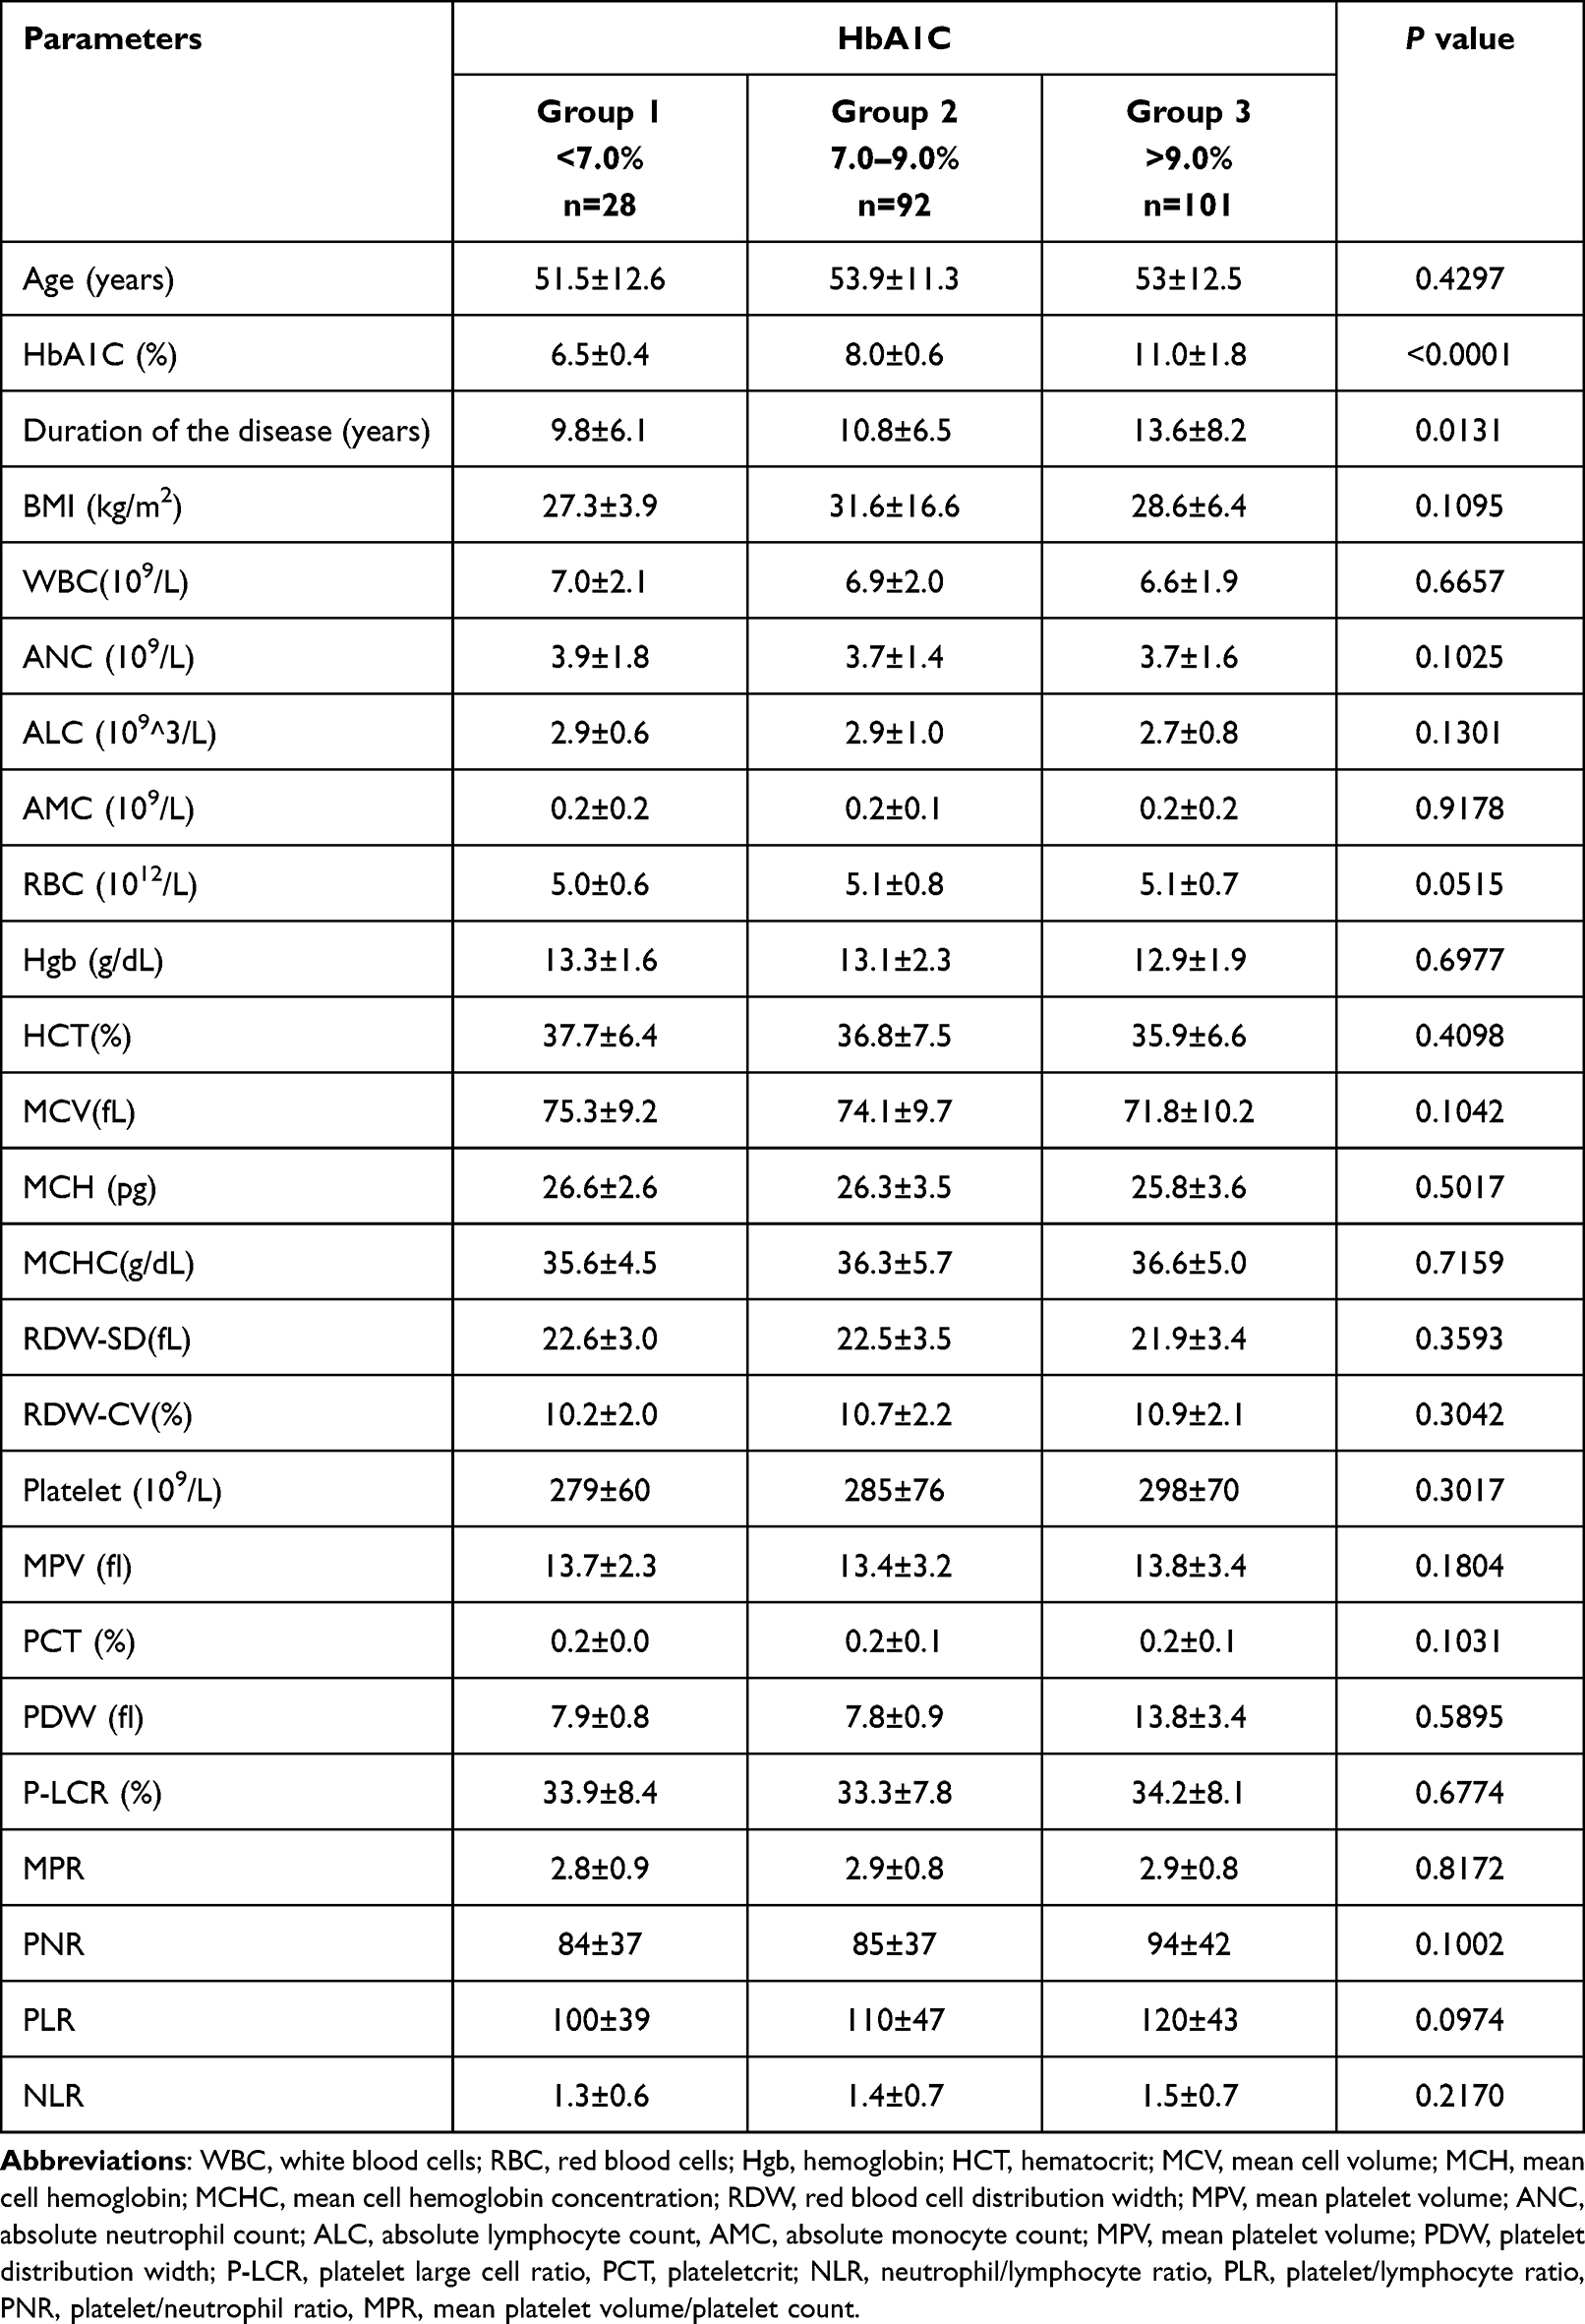 |
Table 4 Categorization of Diabetics Based on the HbA1C Levels (n = 250) |
Correlation of Hematological Parameters with HbA1C Levels and Duration of Diabetes
No positive or negative correlation were found between HbA1C vs all parameters including BMI, WBC, Hct, Hgb, platelet count, all platelet indices, NLR, MPR, PNR, PLR (Table 5). However, a strong significant positive correlation was found between HbA1C and duration of the disease (r=0.1774, R= squared 0.03147; P<0.01) and a strong significant negative correlation was found between RBC count and duration of the disease (r=−0.1473, R= squared 0.02170; P<0.05) (Table 5).
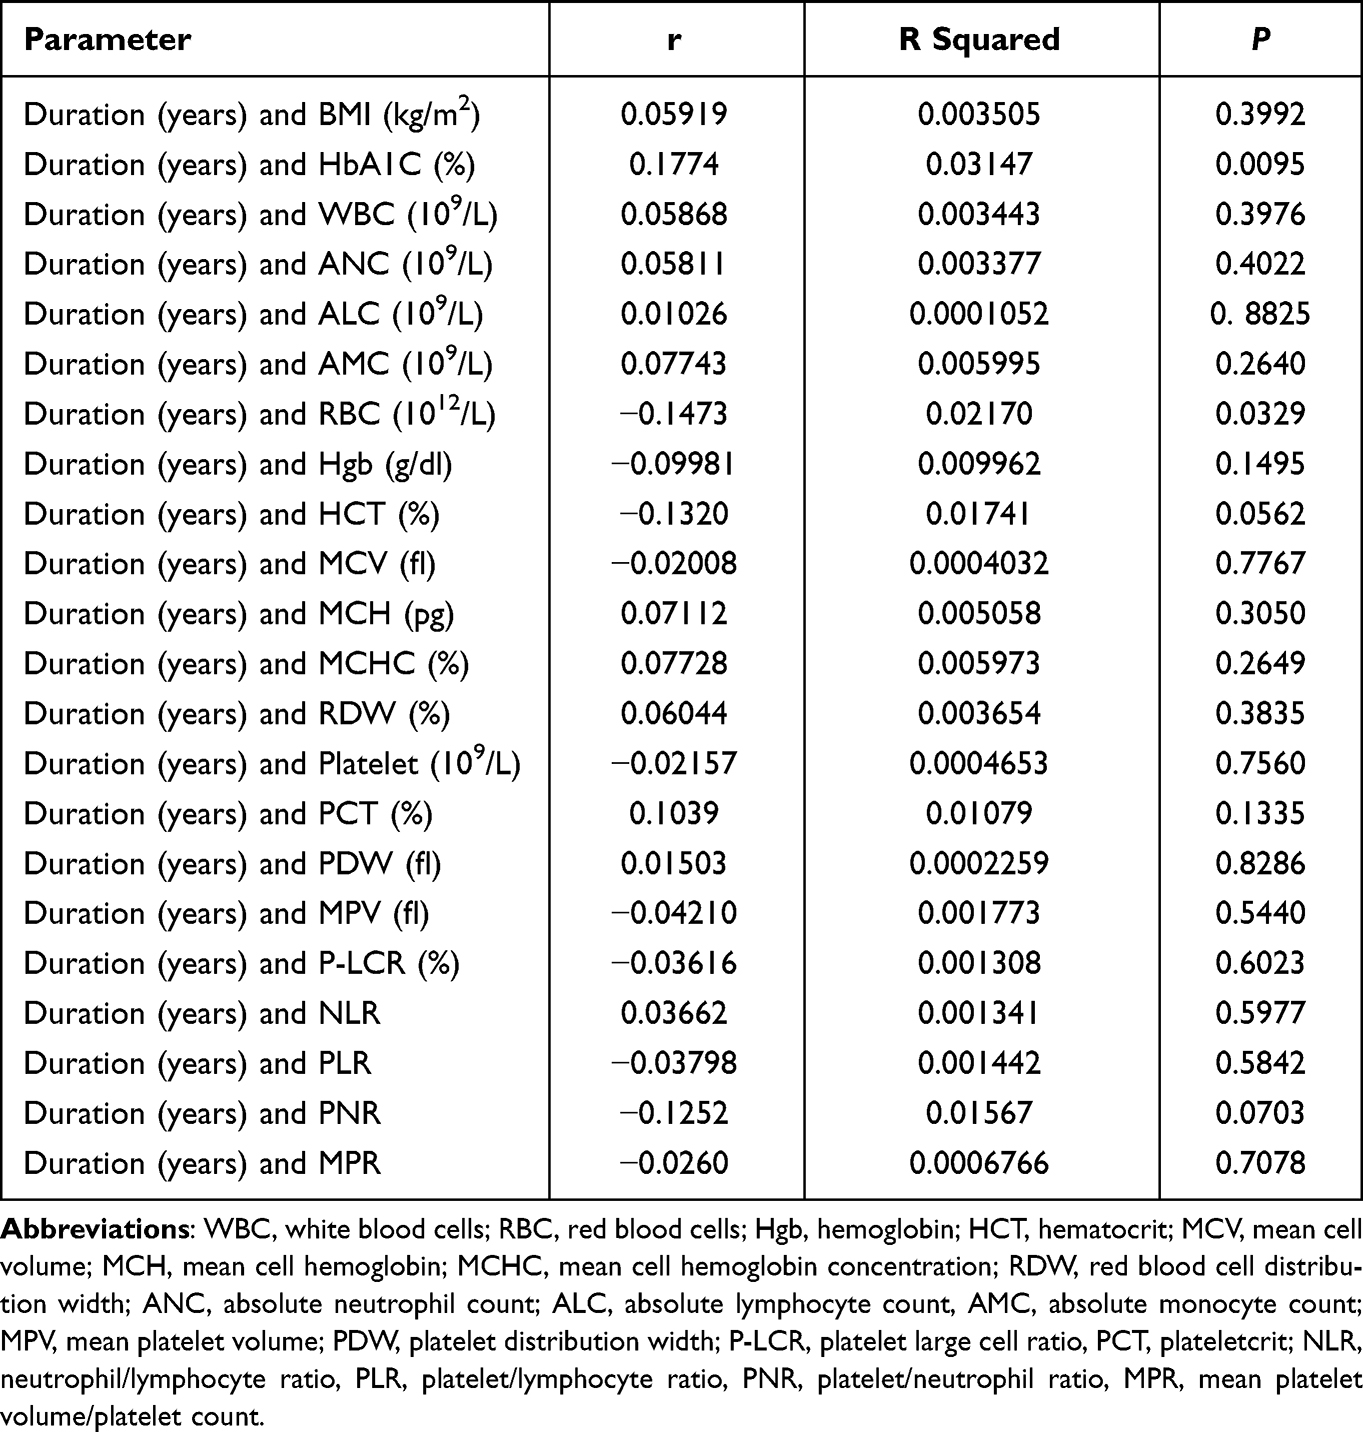 |
Table 5 Correlation Between Duration of the Disease and the Levels of (i) HbA1C, (ii) Complete Blood Count Parameters and (iii) CBC-Derived Parameters in the Patient Group |
Discussion
The current study found a significant effect of T2DM on CBC parameters, including RBC count, Hb and RBC indices, neutrophils, monocytes, MCHC, and MPV compared to healthy controls. Statistically significant lower values of RBCs, Hb, HCT, MCV, and MCH were observed in T2DM patients compared to healthy controls. Low counts of RBC among diabetic patients have been attributed to the effects of chronic hyperglycemia. Hyperglycemia increases reactive oxygen species production,5,14 which ultimately affects RBC deformability and lifespan.6 The changes in RBC in DM affect microcirculation and therefore contribute to microangiopathy 6. In contrast, other studies have reported higher RBC, Hb, and HCT counts in DM, which may be due to insulin resistance.7,8
RBC count is considered an independent risk for microvascular complications. This independent risk increases when the RBC count decreases.15 Despite the RBC count, which is within the normal range, Hb, HCT, MCV, and MCH were low in diabetic patients, indicating the presence of microcytic hypochromic anemia. These findings are in agreement with previous reports5,9 and in contrast to others.7,8 Ezenwaka et al have reported a high prevalence of anemia among T2DM Caribbean diabetic patients as compared to non-diabetic controls.5 In addition, the count of RBCs, Hb levels, and other parameters were divided according to the level of HbA1C. The levels of Hb, HCT, MCV, and MCHC were further reduced from group 1 to group 3 (Table 4). In group 1 compared to group 3, the mean values of Hb were 13.3±1.6 compared to 12.9±1.9, HCT was 37.7±6.4 compared to 35.9±6.6, MCV was 75.3±9.2 compared to 71.8±10.2, and MCH was 75.3±9.2 compared to 25.8±3.6; however, the differences were statistically non-significant (P>0.05). Furthermore, the current study reports no correlation between HbA1C and RBC count, Hb, HCT, MCV, MCH, and MCHC (P>0.05).
Similar to RBC count, low Hb is also an independent risk for microvascular complications, which can be used to predict renal outcomes.15–17 The cause of the anemia in the current study should be investigated and treated to improve the quality of life in anemic diabetic patients.17 However, it is known that acquired and inherited anemia are highly prevalent in Saudi Arabia, particularly in the Jazan region.18,19 Anemia among diabetic patients has been reported to be associated with cardiovascular complications.20 On the other hand, the MCHC was significantly higher in our patient group despite the low values of the RBC, Hb, HCT, MCV, and MCH. Significantly high values of MCHC have been reported in diabetic patients compared to healthy controls.7,9 As Jazan is an endemic region for both acquired, mainly nutritional, and inherited anemias, and this could be the possible explanation for similarities with some studies and discrepancies with others. In addition, socio-demographic characteristics and the study population differ from study to study.
Indeed, the disease has been shown to affect the deformability of the RBCs, which participate in the development of inflammation and microvascular complications. Furthermore, red blood cell distribution width (RDW) has been proposed to reflect the deterioration in glucose regulation in T2DM. The current RDW was significantly lower than that of healthy controls. The mean value of RDW in the patient group was 10.5%, which is below the normal values of RDW-CV (normal values: 11.5% to 14.5%). This finding contrasts with other studies reported in DM patients. The RDW is an indicative marker of the homogeneity/heterogeneity of the RBC size, which is normally obtained as an auxiliary index in the CBC. It is widely used for the differential diagnosis of subtypes of microcytic anemia. High values of RDW in microcytic anemia are mainly associated with iron deficiency anemia, unlike thalassemia. RDW is associated with increased risk factors for CVD and overall cardiovascular mortality.21
The current study reported no effect of T2DM on WBC count, similar to other studies,7,22 as the counts of WBCs were in the normal ranges. The WBC count reflects the inflammatory response of the body.23 The chronic inflammatory process contributes to the pathogenesis of T2DM. It was found that the inflammatory pathways were upregulated in T2DM.23,24 The chronic inflammatory response is a key player in the development of DM complications.25 The association between WBCs and inflammation is well documented.25
CBC-derived parameters, including NLR, PNR, PLR, and MPR, were also investigated in the study. These parameters are considered novel markers to predict the inflammatory process.26 The NLR was slightly higher but within the normal range in diabetic patients compared to healthy controls (P<0.0001). The mean value of NLR in the current study was 1.4±0.7, which is similar to reported NLR values from diabetic patients27 and less than NLR reported from viral infections, including COVID-19.28 However, the increase in NLR among large-scale diabetic patients from1,13 NLR in quartile 1 (Q1) to 3.08 NLR in quartile 2 (Q4) has been suggested to be associated with diabetic complications, including CVD and diabetic kidney disease.27 Furthermore, the mean value of NLR in the current study was slightly increased with increasing HbA1C levels: 1.5 (HbA1C >9.0%), >1.4 (HbA1C 7.0–9.0%), and >1.3 (HbA1C <7.0%) (Table 4).22 Hence, it is very important to mention that an NLR in the 2.3–3.0 range can suggest an early sign of worsening the inflammatory state.26 Moreover, the NLR has been reported to increase in poorly controlled diabetic patients.29
In addition to their key role in hemostasis and thrombosis, platelets participate in inflammation, immunity, angiogenesis, and cancer.30 The role of platelets in deriving the prothrombotic state in DM, including T2DM, has been suggested.31
In the current study, platelet count was comparable in diabetic patients and healthy controls (290±72 vs 286±67; P>0.05),32,33 and both counts were within the reported normal ranges.34 Platelet count has been suggested to be associated with diabetic complications, including nephropathy.35 The platelet count with diabetic nephropathy was around 281±65, as reported by Sterner et al.35 However, it is worth mentioning that platelet counts have shown variable results, being either higher or lower36 in patients with diabetes as compared to controls.
Platelet indices, including mean platelet volume (MPV; reflects the rate of platelet production, average size, and activity), platelets distribution width (PDW; measures platelets’ heterogeneity), and platelet-large cell ratio (P-LCR; measures larger platelets), were investigated in the current study. MPV was significantly lower in our patient cohort compared to healthy controls. The MPV was reported to be higher in diabetic patients with and without complications compared to healthy controls.32,33 Increased MPV is associated with a variety of complications, including myocardial infarction37 and an increased risk of microvascular complications in DM.38 In addition, the current study reports no correlation between MPV and HbA1C or the duration of the disease.36 PDW and P-LCR were significantly higher in diabetic patients as compared to controls (P<0.01) in the current study and elsewhere.32,33 The data on these two parameters are limited in diabetes and need further exploration.32 The PDW and P-LCR have been found to be raised in patients with acute coronary artery disease compared to controls and stable coronary artery disease patients.37 The study exhibits notable strengths, including a robust sample size with comprehensive assessment of comorbidities and a valuable comparison with HbA1C levels. However, one of the limitations lies in the omission of evaluating additional inflammatory markers and their correlation with CBC and CBC-derived parameters and potential association with T2DM.
Conclusion
Complete blood count is a routine, simple test with significant results. The CBC can show the contribution of RBCs, WBCs, and platelets to the progression of T2DM and the inflammatory activity using the calculated parameters, including NLR, PLR, MPR, and PNR. Therefore, CBC and CBC-calculated parameters are inexpensive tools for follow up of patients with T2DM. These parameters could be providing an early sign of alteration in the blood cell including the development of anemia. Further studies are needed to explore these parameters to predict the pathogenesis and progression of T2DM, and therefore, intervention is made to reduce severe complications, mortality and morbidity in those patients.
Ethical Approval
All procedures performed in the current studies involving human participants were in accordance with the ethical standards of the Jazan Health Ethics Committee, Ministry of Health, Saudi Arabia and with the 1964 Helsinki declaration and its later amendments or comparable ethical standards.
Informed Consent
Informed consent was obtained from all study participants.
Author Contributions
All authors made a significant contribution to the work reported, whether that is in the conception, study design, execution, acquisition of data, analysis and interpretation, or in all these areas; took part in drafting, revising or critically reviewing the article; gave final approval of the version to be published; have agreed on the journal to which the article has been submitted; and agree to be accountable for all aspects of the work.
Funding
The authors extend their appreciation to the deanship of Scientific Research, Jazan University, for supporting the research work through the Research Unit support Program, (Grant Number RUP2-05).
Disclosure
The authors declare no conflicts of interest in this work.
References
1. IDF. Diabetes Atlas.
2. Sobczak AIS, Stewart AJ. Coagulatory defects in type-1 and type-2 diabetes. Int J Mol Sci. 2019;20(24):6345. doi:10.3390/ijms20246345
3. Twig G, Afek A, Shamiss A, et al. White blood cells count and incidence of type 2 diabetes in young men. Diabetes Care. 2013;36(2):276–282. doi:10.2337/dc11-2298
4. Demirtunc R, Duman D, Basar M, Bilgi M, Teomete M, Garip T. The relationship between glycemic control and platelet activity in type 2 diabetes mellitus. J Diabetes Complications. 2009;23(2):89–94. doi:10.1016/j.jdiacomp.2008.01.006
5. Ezenwaka CE, Jones-Lecointe A, Nwagbara E, Seales D, Okali F. Anaemia and kidney dysfunction in Caribbean type 2 diabetic patients. Cardiovasc Diabetol. 2008;7(1):25. doi:10.1186/1475-2840-7-25
6. Cho YI, Mooney MP, Cho DJ. Hemorheological disorders in diabetes mellitus. J Diabetes Sci Technol. 2008;2(6):1130–1138. doi:10.1177/193229680800200622
7. Ziaee A, Ghorbani A, Kalbasi S, Hejrati A, Moradi S. Association of hematological indices with prediabetes: a cross-sectional study. Electron Physician. 2017;9(9):5206–5211. doi:10.19082/5206
8. Biadgo B, Melku M, Abebe SM, Abebe M. Hematological indices and their correlation with fasting blood glucose level and anthropometric measurements in type 2 diabetes mellitus patients in Gondar, Northwest Ethiopia. Diabetes Metab Syndr Obes. 2016;9:91–99. doi:10.2147/DMSO.S97563
9. Ebrahim H, Fiseha T, Ebrahim Y, Bisetegn H, Akash MSH. Comparison of hematological parameters between type 2 diabetes mellitus patients and healthy controls at Dessie comprehensive specialized hospital, Northeast Ethiopia: comparative cross-sectional study. PLoS One. 2022;17(7):e0272145. doi:10.1371/journal.pone.0272145
10. Hamali HA, Saboor M, Dobie G, et al. Procoagulant microvesicles in COVID-19 patients: possible modulators of inflammation and prothrombotic tendency. Infect Drug Resist. 2022;15:2359–2368. doi:10.2147/IDR.S355395
11. Zhong Q, Peng J. Mean platelet volume/platelet count ratio predicts severe pneumonia of COVID-19. J Clin Lab Anal. 2021;35(1):e23607. doi:10.1002/jcla.23607
12. Sayed AA, Allam AA, Sayed AI, Alraey MA, Joseph MV. The use of neutrophil-to-lymphocyte ratio (NLR) as a marker for COVID-19 infection in Saudi Arabia. Saudi Med J. 2021;42(4):370 LP–376 . doi:10.15537/smj.2021.42.4.20200818
13. Nada AM. Red cell distribution width in type 2 diabetic patients. Diabetes Metab Syndr Obes. 2015;8:525–533. doi:10.2147/DMSO.S85318
14. Arkew M, Yemane T, Mengistu Y, Gemechu K, Tesfaye G, Johnson C. Hematological parameters of type 2 diabetic adult patients at debre berhan referral hospital, Northeast Ethiopia: a comparative cross-sectional study. PLoS One. 2021;16(6):e0253286. doi:10.1371/journal.pone.0253286
15. Wang Z-S, Song Z-C, Bai J-H, et al. Red blood cell count as an indicator of microvascular complications in Chinese patients with type 2 diabetes mellitus. Vasc Health Risk Manag. 2013;9:237–243. doi:10.2147/VHRM.S43211
16. Keane WF, Brenner BM, de Zeeuw D, et al. The risk of developing end-stage renal disease in patients with type 2 diabetes and nephropathy: the RENAAL study. Kidney Int. 2003;63(4):1499–1507. doi:10.1046/j.1523-1755.2003.00885.x
17. Thomas MC. Anemia in diabetes: marker or mediator of microvascular disease? Nat Clin Pract Nephrol. 2007;3(1):20–30. doi:10.1038/ncpneph0378
18. Hamali HA, Saboor M. Undiagnosed hemoglobinopathies: a potential threat to the premarital screening program. Pakistan J Med Sci. 2019;35(6):1611–1615. doi:10.12669/pjms.35.6.976
19. Hamali HA, Mobarki AA, Saboor M, et al. Prevalence of anemia among Jazan University students. Int J Gen Med. 2020;13:765–770. doi:10.2147/IJGM.S275702
20. Vlagopoulos PT, Tighiouart H, Weiner DE, et al. Anemia as a risk factor for cardiovascular disease and all-cause mortality in diabetes: the impact of chronic kidney disease. J Am Soc Nephrol. 2005;16(11):3403–3410. doi:10.1681/ASN.2005030226
21. Pan J, Borné Y, Engström G. The relationship between red cell distribution width and all-cause and cause-specific mortality in a general population. Sci Rep. 2019;9(1):16208. doi:10.1038/s41598-019-52708-2
22. Duman TT, Aktas G, Atak BM, Kocak MZ, Erkus E, Savli H. Neutrophil to lymphocyte ratio as an indicative of diabetic control level in type 2 diabetes mellitus. Afr Health Sci. 2019;19(1):1602–1606. doi:10.4314/ahs.v19i1.35
23. Duncan BB, Schmidt MI, Pankow JS, et al. Low-grade systemic inflammation and the development of type 2 diabetes: the atherosclerosis risk in communities study. Diabetes. 2003;52(7):1799–1805. doi:10.2337/diabetes.52.7.1799
24. Pradhan AD, Manson JE, Rifai N, Buring JE, Ridker PM. C-reactive protein, interleukin 6, and risk of developing type 2 diabetes mellitus. JAMA. 2001;286(3):327–334. doi:10.1001/jama.286.3.327
25. Fujita T, Hemmi S, Kajiwara M, et al. Complement-mediated chronic inflammation is associated with diabetic microvascular complication. Diabetes Metab Res Rev. 2013;29(3):220–226. doi:10.1002/dmrr.2380
26. Zahorec R. Neutrophil-to-lymphocyte ratio, past, present and future perspectives. Bratisl Lek Listy. 2021;122(7):474–488. doi:10.4149/BLL_2021_078
27. Wan H, Wang Y, Fang S, et al. Associations between the neutrophil-to-lymphocyte ratio and diabetic complications in adults with diabetes: a cross-sectional study. J Diabetes Res. 2020;2020:6219545. doi:10.1155/2020/6219545
28. Mobarki AA, Dobie G, Saboor M, et al. MPR and NLR as prognostic markers in ICU-admitted patients with COVID-19 in Jazan, Saudi Arabia. Infect Drug Resist. 2021;14:4859–4864. doi:10.2147/IDR.S342259
29. Sefil F, Ulutas KT, Dokuyucu R, et al. Investigation of neutrophil lymphocyte ratio and blood glucose regulation in patients with type 2 diabetes mellitus. J Int Med Res. 2014;42(2):581–588. doi:10.1177/0300060513516944
30. Hamali HA. The mighty role of platelets in immunity, inflammation, cancer and angiogenesis. Majmaah J Heal Sci. 2020;8(1):65–81. doi:10.5455/mjhs.2020.01.008
31. Schneider DJ. Factors contributing to increased platelet reactivity in people with diabetes. Diabetes Care. 2009;32(4):525–527. doi:10.2337/dc08-1865
32. Jindal S, Gupta S, Gupta R, et al. Platelet indices in diabetes mellitus: indicators of diabetic microvascular complications. Hematology. 2011;16(2):86–89. doi:10.1179/102453311X12902908412110
33. Ebrahim H, Asrie F, Getaneh Z. Basic coagulation profiles and platelet parameters among adult type 1 and type 2 diabetes patients at Dessie Referral Hospital, Northeast Ethiopia: comparative cross-sectional study. J Blood Med. 2021;12:33–42. doi:10.2147/JBM.S287136
34. Kodiatte TA, Manikyam UK, Rao SB, et al. Mean platelet volume in Type 2 diabetes mellitus. J Lab Physicians. 2012;4(1):5–9. doi:10.4103/0974-2727.98662
35. Sterner G, Carlson J, Ekberg G. Raised platelet levels in diabetes mellitus complicated with nephropathy. J Intern Med. 1998;244(6):437–441. doi:10.1111/j.1365-2796.1998.00349.x
36. Hekimsoy Z, Payzin B, Örnek T, Kandoğan G. Mean platelet volume in type 2 diabetic patients. J Diabetes Complications. 2004;18(3):173–176. doi:10.1016/S1056-8727(02)00282-9
37. Khandekar MM, Khurana AS, Deshmukh SD, Kakrani AL, Katdare AD, Inamdar AK. Platelet volume indices in patients with coronary artery disease and acute myocardial infarction: an Indian scenario. J Clin Pathol. 2006;59(2):146–149. doi:10.1136/jcp.2004.025387
38. Papanas N, Symeonidis G, Maltezos E, et al. Mean platelet volume in patients with type 2 diabetes mellitus. Platelets. 2004;15(8):475–478. doi:10.1080/0953710042000267707
 © 2023 The Author(s). This work is published and licensed by Dove Medical Press Limited. The
full terms of this license are available at https://www.dovepress.com/terms
and incorporate the Creative Commons Attribution
- Non Commercial (unported, 3.0) License.
By accessing the work you hereby accept the Terms. Non-commercial uses of the work are permitted
without any further permission from Dove Medical Press Limited, provided the work is properly
attributed. For permission for commercial use of this work, please see paragraphs 4.2 and 5 of our Terms.
© 2023 The Author(s). This work is published and licensed by Dove Medical Press Limited. The
full terms of this license are available at https://www.dovepress.com/terms
and incorporate the Creative Commons Attribution
- Non Commercial (unported, 3.0) License.
By accessing the work you hereby accept the Terms. Non-commercial uses of the work are permitted
without any further permission from Dove Medical Press Limited, provided the work is properly
attributed. For permission for commercial use of this work, please see paragraphs 4.2 and 5 of our Terms.