Back to Journals » Diabetes, Metabolic Syndrome and Obesity » Volume 13
Common and Unique Factors and the Bidirectional Relationship Between Chronic Kidney Disease and Nonalcoholic Fatty Liver in Type 2 Diabetes Patients
Authors Lee YJ, Wang CP, Hung WC, Tang WH, Chang YH ![]() , Hu DW, Lu YC, Yu TH, Wu CC
, Hu DW, Lu YC, Yu TH, Wu CC ![]() , Chung FM, Hsu CC
, Chung FM, Hsu CC ![]()
Received 7 November 2019
Accepted for publication 27 March 2020
Published 17 April 2020 Volume 2020:13 Pages 1203—1214
DOI https://doi.org/10.2147/DMSO.S237700
Checked for plagiarism Yes
Review by Single anonymous peer review
Peer reviewer comments 2
Editor who approved publication: Dr Konstantinos Tziomalos
Yau-Jiunn Lee,1 Chao-Ping Wang,2,3 Wei-Chin Hung,2,4 Wei-Hua Tang,1 Yu-Hung Chang,1 Der-Wei Hu,1 Yung-Chuan Lu,3,5 Teng-Hung Yu,2,4 Cheng-Ching Wu,2,4,6 Fu-Mei Chung,2 Chia-Chang Hsu4,7,8
1Lee’s Endocrinology Clinic, Pingtung 90000, Taiwan; 2Division of Cardiology, Department of Internal Medicine, E-Da Hospital, Kaohsiung 82445, Taiwan; 3School of Medicine for International Students, College of Medicine, I-Shou University, Kaohsiung 82445, Taiwan; 4The School of Chinese Medicine for Post Baccalaureate, College of Medicine, I-Shou University, Kaohsiung 82445, Taiwan; 5Division of Endocrinology and Metabolism, Department of Internal Medicine, E-Da Hospital, Kaohsiung 82445, Taiwan; 6Division of Cardiology, Department of Internal Medicine, E-Da Cancer Hospital, Kaohsiung 82445, Taiwan; 7Division of Gastroenterology and Hepatology, Department of Internal Medicine, E-Da Hospital, Kaohsiung 82445, Taiwan; 8Health Examination Center, E-Da Dachang Hospital, Kaohsiung 80794, Taiwan
Correspondence: Chia-Chang Hsu
Division of Gastroenterology and Hepatology, Department of Internal Medicine, E-Da Hospital, Kaohsiung 82445, Taiwan
Tel +886-7-615-1100 ext. 5914 or 5018
Email [email protected]
Purpose: This study aimed to investigate the common and unique risk factors and bidirectional relationship between chronic kidney disease (CKD) and nonalcoholic fatty liver disease (NAFLD) in patients with type 2 diabetes mellitus (T2DM).
Patients and Methods: This was a cross-sectional study of patients with T2DM enrolled in a disease management program at two specialized diabetes outpatient clinics. Common and unique risk factors for CKD and NAFLD were examined using structural equation models (SEMs). SEMs were also used to examine direct and indirect effects of NAFLD on CKD and those of CKD on NAFLD.
Results: A total of 1992 subjects with T2DM were enrolled in this study. In multivariate analysis, NAFLD was independently associated with the odds of CKD (adjusted odds ratio=1.59, 95% confidence interval=1.12– 2.25, P=0.009). SEMs showed that age, triglyceride, uric acid (UA), albumin, and HbA1c levels had statistically significant direct effects on CKD, and the final model could explain 22% of the variability in CKD. Age, triglycerides, body mass index (BMI), UA, white blood cell (WBC) count, serum glutamic pyruvic transaminase (SGPT) level, and smoking status had statistically significant direct effects on NAFLD, and the final model could explain 43% of the variability in NAFLD. The common risk factors contributing to both CKD and NAFLD were age, triglycerides, and UA. The unique risk factors were albumin and HbA1c for CKD, and BMI, WBC, SGPT, and smoking for NAFLD. In addition, SEM analysis also confirmed the bidirectional causal relationship between NAFLD and CKD.
Conclusion: Common and unique risk factors and a bidirectional relationship existed between CKD and NAFLD in our patients with T2DM.
Keywords: bidirectional relationship, chronic kidney disease, nonalcoholic fatty liver disease, risk factor, structural equation modeling, type 2 diabetes mellitus
Introduction
The incidence of diabetes mellitus is increasing worldwide, and it is the most common cause of chronic kidney disease (CKD) and end-stage renal disease (ESRD). Diabetic nephropathy has been reported to affect 20–40% of people with diabetes.1 In addition, nonalcoholic fatty liver disease (NAFLD) has also been associated with type 2 diabetes mellitus (T2DM), with an incidence in the general population ranging from 20–30% and up to 75% in patients with T2DM.2 CKD is also a global health issue, and it is associated with increased risks of ESRD, cardiovascular disease, high rates of morbidity and mortality, and high health care costs.3 NAFLD has increasingly been reported to be a common cause of chronic liver disease, and to be associated with both liver-related morbidity and mortality4 and increased risks of developing cardiovascular disease (CVD) and adverse CVD outcomes.5
An increasing number of epidemiologic studies have reported an association between NAFLD and CKD, especially in people with T2DM,6,7 and there has also been increased focus on NAFLD-related CKD.8 Diverse and complex factors have been associated with the development and progression of CKD and NAFLD. Previous studies have consistently reported that an older age, diabetes, hypertension, dyslipidemia, and obesity are associated with either CKD or NAFLD.9–11 However, few studies have examined the characteristics of the risk factors for both NAFLD and CKD,9–11 and the relationships among the unique risk factors for NAFLD and CKD in patients with T2DM. Although CKD and NAFLD may share many common pathogenic mechanisms and cardio-metabolic risk factors, it would seem that as yet unknown unique risk factors and pathways are involved in NAFLD and CKD in patients with T2DM.12 To fill this information gap, we evaluated associations among NAFLD and other factors with CKD in patients with T2DM in this study, and assessed the effects of demographic data, inflammation factors, anthropometric and metabolic variables on CKD and NAFLD using structural equation models (SEMs). In addition, we also used an SEM to explore the potential mediators and bidirectional relationship between CKD and NAFLD.
Patients and Methods
Study Participants
In this cross-sectional analysis, we enrolled patients with T2DM who participated in a disease management program from October 2006 to May 2017 at two specialized diabetes outpatient clinics in Pingtung Christian Hospital and E-Da Hospital (n = 2,283).13 The diagnosis of T2DM was based on World Health Organization criteria.14 Patients with liver cirrhosis, positive hepatitis B surface antigen or hepatitis C virus antibodies (n = 61), history of cancer (n = 12), CVD (including myocardial infarction, angina, symptomatic peripheral artery disease, ischemic stroke, coronary/peripheral revascularization procedures) (n = 22), alcohol intake ≥ 30 g/day in men or ≥ 20 g/day in women (n = 75), and those receiving medical treatment for current chronic glomerulonephritis other than diabetic kidney disease (n = 11) were excluded. Patients with missing information on alcohol intake (n = 108) and variables required to calculate NAFLD fibrosis score (n = 2) were also excluded. Since more than one exclusion criterion could have applied to each patient, we finally enrolled 1,992 patients (682 men and 1,310 women). All of the patients provided written informed consent for collection of data and samples, and also for the analysis of these data. This study was performed in accordance with the principles of the Declaration of Helsinki, and the study protocol and procedures were approved by the Ethics Committees of Pingtung Christian Hospital and E-Da Hospital with a Clinical Trial Approval Certificate of Pingtung Christian Hospital on 16th Dec 2005 and E-Da Hospital Institutional Review Board number EMRP-106-058. All experiments were performed according to the relevant regulations and guidelines.
Data Collection
Data on demographics, alcohol consumption, smoking status, medical history, psycho-social factors, diabetic self-management behavior, and the use of medications were collected using a standardized questionnaire. Current smokers were defined as those who had smoked within 1 year of the examination, and nonsmokers were defined as those who had stopped smoking for > 1 year before the examination. Most of the participants did not drink alcohol (88%) or drank in moderation (alcohol intake < 20 g/day; 12%). Trained nurses measured the weight, height, and sitting blood pressure of each patient. Body mass index (BMI) was calculated as weight (kg)/height (m2). In addition, venous blood was drawn in the morning after an overnight fast. The kinetic Jaffé method was used to measure levels of serum creatinine using a SYNCHRON CX System analyzer (SYNCHRON, Los Angeles, CA) with reagents purchased from Beckman Coulter Diagnostics (Beckman Coulter Inc., Los Angeles, CA). Standard commercial methods were used to measure levels of total cholesterol, high-density lipoprotein cholesterol (HDL-C), low-density lipoprotein cholesterol (LDL-C), serum triglycerides, albumin, glucose, uric acid (UA), and white blood cell (WBC) count using a parallel-multichannel analyzer (SYNCHRON). High performance liquid chromatography was used to measure levels of hemoglobin A1c (HbA1c). Serum glutamic pyruvic transaminase (SGPT) was measured according to the International Federation of Clinical Chemistry methods.
Measurement of Estimated Glomerular Filtration Rate (eGFR) and Definition of CKD Risk Status
EGFR was calculated using the CKD-EPI two-concentration race equation,15 and CKD status was confirmed with follow-up eGFR measurements taken 3 months later according to the modified National Kidney Foundation classification of CKD.16 In this study, we classified patients with an eGFR < 60 mL/min per 1.73m2 into the CKD group, but not those with stage 1 or 2 CKD (eGFR ≥ 60 mL/min per 1.73m2).17
Liver Ultrasonography and Fatty Liver Index (FLI) Calculation
All of the participants underwent hepatic ultrasonography which was performed by the two experienced physicians who were blinded to their clinical data. Hepatic steatosis was diagnosed according to the following sonographic features: evidence of diffuse hyperechogenicity in the liver relative to the kidneys, poor visualization of intrahepatic structures, and ultrasound beam attenuation. As patients with excess alcohol intake (≥ 30 g/day for men and ≥ 20 g/day for women) in addition to other identifiable causes of fatty liver were excluded from this study, a fatty liver was considered to indicate NAFLD.
The FLI was calculated as follows:
FLI = [e0.953×loge (triglycerides) + 0.139×BMI + 0.718×loge (GGT) + 0.053×waist circumference-15.745)]/[1+ e0.953×loge (triglycerides) + 0.139×BMI + 0.718×loge (GGT) + 0.053×waist circumference-15.745] ×100, with GGT in U/l, triglycerides in mmol/l, and waist circumference in cm, as previously reported by Bedogni et al.18
Statistical Analysis and SEMs
The Kolmogorov–Smirnov test was used to analyze normality of the data. Normally distributed continuous variables are presented as mean ± SD, and non-normally distributed variables as median (interquartile range). Statistical differences in variables were compared using unpaired Student’s t-tests for normally distributed variables. Levels of serum triglycerides, SGPT, and urine albumin to creatinine ratio (UACR) were logarithmically transformed before performing the statistical tests to achieve normal distribution. Categorical variables are presented as frequencies and/or percentages, and the χ2 test was used for inter-group comparisons. Multivariate logistic regression models were used to investigate whether NAFLD was independently associated with CKD. Adjusted odds ratios and 95% confidence intervals were estimated to assess the independent effects of potential risk factors. All tests were two-tailed, and a P-value of <0.05 was considered to be statistically significant. Statistical Package for Social Science software was used for all statistical analyses (SPSS for Windows, version 21.0; SPSS Inc., Chicago, Ill, USA).
To explore the common and unique risk factors for CKD and NAFLD, we performed measured variable path analysis (MVPA), a type of SEM, to evaluate relationships among age, education, BMI, triglycerides, HbA1c, systolic blood pressure (SBP), UA, and albumin on CKD, and relationships among age, education, BMI, triglycerides, HbA1c, SGPT, UA, WBC, and smoking on NAFLD. In addition, a path model based on covariance structural analysis was then constructed to investigate relationships between BMI and UA, and in particular to identify the factors associated with BMI and UA that were most likely to have causal effects on the risks of CKD and NAFLD.19
Given the potential bidirectional relationship between CKD and NAFLD, we used the following analytic approach: first, we tested for mediation according to the study by Baron and Kenny,20 and then we used SEMs to analyze the direct and indirect effects of CKD on NAFLD and of NAFLD on CKD. The basic theoretical forms of the SEMs are shown in Figure S1.
Initial analysis revealed that obesity and UA were common mediators contributing to the pathogenesis of both CKD and NAFLD. We then used a logistic regression model with BMI as a function of NAFLD and other potential risk factors in the final model of CKD (Figure S1). As NAFLD has been associated with CKD,21 we used a further model with BMI added to the CKD-NAFLD model to assess whether the relationship remained after adding BMI. A similar process was used to assess whether UA mediated the relationship between CKD and NAFLD as with obesity. We fitted the following SEMs: (1) Model A for CKD risk status: NAFLD, BMI, and UA leading to CKD risk status, with NAFLD leading to obesity. (2) Model B for CKD risk status: NAFLD, BMI, and UA leading to CKD risk status, with obesity leading to NAFLD. (3) Model C for NAFLD outcomes: CKD risk status leading to NAFLD, with BMI and UA leading to CKD risk status. (4) Model D for NAFLD outcomes: CKD and BMI leading to NAFLD, with BMI and UA leading to CKD.
IBM SPSS AMOS version 24 (Amos Development Corporation, Meadville, PA, USA) software was used to fit the path model and SEMs are depicted in Figures 1–3. We used standard criteria including standardized root mean square residual (SRMSR) < 0.06, root mean square error of approximation (RMSEA) < 0.08, and comparative fit index (CFI) > 0.90 as indices of the statistical fit of the models to the data.22 In addition, we used the maximum likelihood method to estimate the fit of a model. The results are presented as standardized path coefficients with their statistical significance.
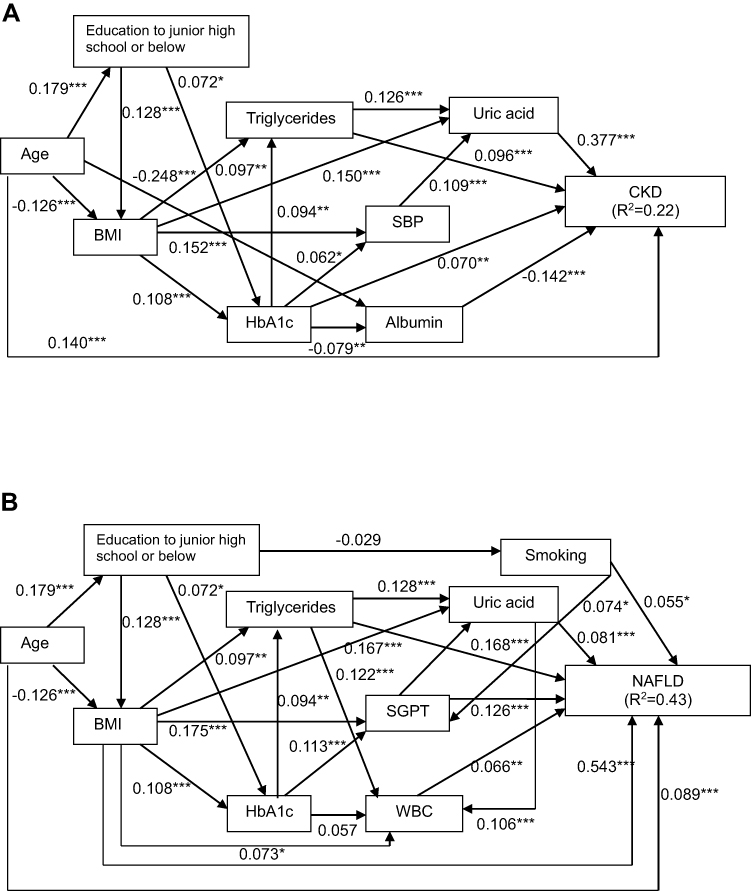 |
Figure 1 Structural equation model for chronic kidney disease in the patients with type 2 diabetes mellitus. χ2 = 57.90, p <0.05; Comparative Fit Index (CFI), 0.934; Goodness of Fit Index (GFI), 0.989; root mean square error of approximation (RMSEA), 0.046; standardized root mean square residual (SRMR), 0.034. *P<0.05, **P<0.01, and ***P<0.001. Path loadings are standardized coefficients (A). Structural equation model for nonalcoholic fatty liver disease in the patients with type 2 diabetes mellitus. χ2 = 53.54, p <0.05; CFI, 0.965; GFI, 0.991; RMSEA, 0.037; SRMR, 0.029. *P<0.05, **P<0.01, and ***P<0.001. Path loadings are standardized coefficients (B). Variables that were included in the structural equation model are presented in Supplemental Tables 1 and 2. Abbreviations: BMI, body mass index; SBP, systolic blood pressure; CKD, chronic kidney disease; SGPT, serum glutamic pyruvic transaminase; WBC, white blood cell; NAFLD, nonalcoholic fatty liver disease. |
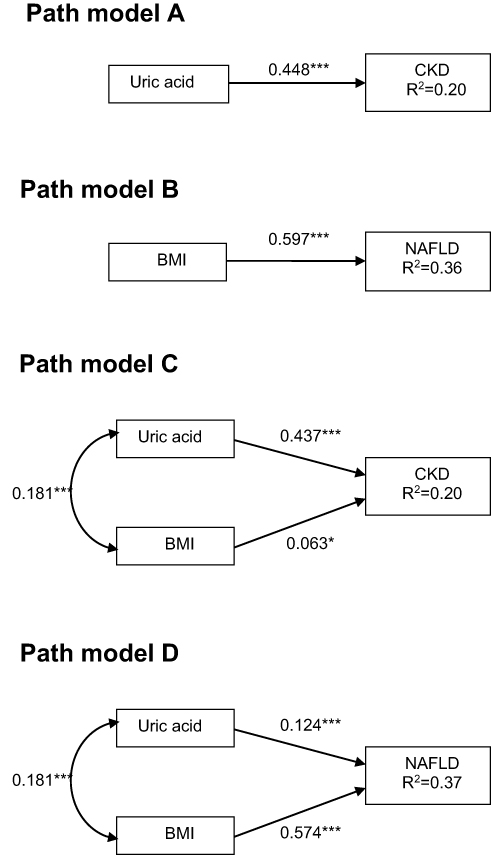 |
Figure 2 Path models (A–D). The paths are displayed with coefficients that indicate the standardized coefficient of the regressing independent variable on the dependent variable of the relevant path (path model (A), uric acid to chronic kidney disease (CKD) risk status; path model (B), body mass index (BMI) to nonalcoholic fatty liver disease (NAFLD); path model (C), uric acid and/or BMI to CKD risk status; path model (D), uric acid and/or BMI to NAFLD). *P<0.05 and ***P<0.001. Abbreviations: CKD, chronic kidney disease; NAFLD, nonalcoholic fatty liver disease; BMI, body mass index; R2, squared multiple correlation. |
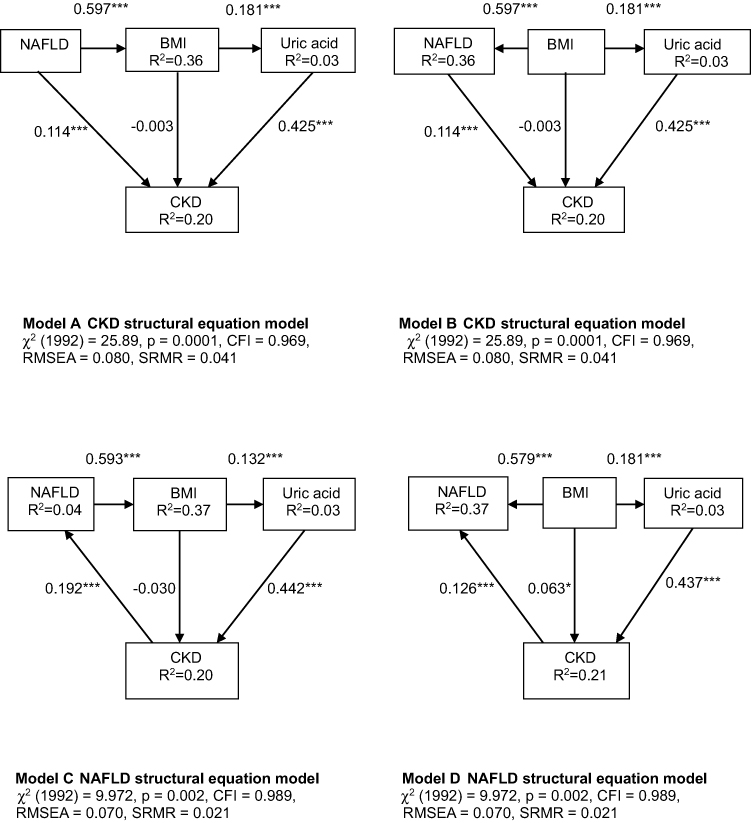 |
Figure 3 Structural equation models outlining four possible bidirectional relationships between the risk of chronic kidney disease (A and B) and nonalcoholic fatty liver disease (C and D), mediated by body mass index and uric acid. *P<0.05 and ***P<0.001. Path loadings are standardized coefficients. Abbreviations: CKD, chronic kidney disease; NAFLD, nonalcoholic fatty liver disease; BMI, body mass index; R2, squared multiple correlation. |
Results
Baseline Clinical and Biochemical Characteristics in the T2DM Patients with and Without CKD
Baseline clinical and biochemical characteristics in the T2DM patients with and without CKD are shown in Table 1. The CKD patients had higher rates of illiteracy, education to elementary school, being a widow or widower, NAFLD, and obesity, and lower rates of education to high school and college, and single marital status than the patients without CKD (P<0.05). In addition, the patients with CKD were older and had a higher known duration of diabetes (DMDU), fatty liver index, BMI, waist circumference, SBP, fasting glucose, HbA1c, triglycerides, UA, creatinine, and UACR than the patients without CKD (P<0.05). The patients with CKD also had a lower Mini-Mental State Examination (MMSE) score, and lower levels of HDL-C, albumin, SGPT, and eGFR than the patients without CKD (P<0.05).
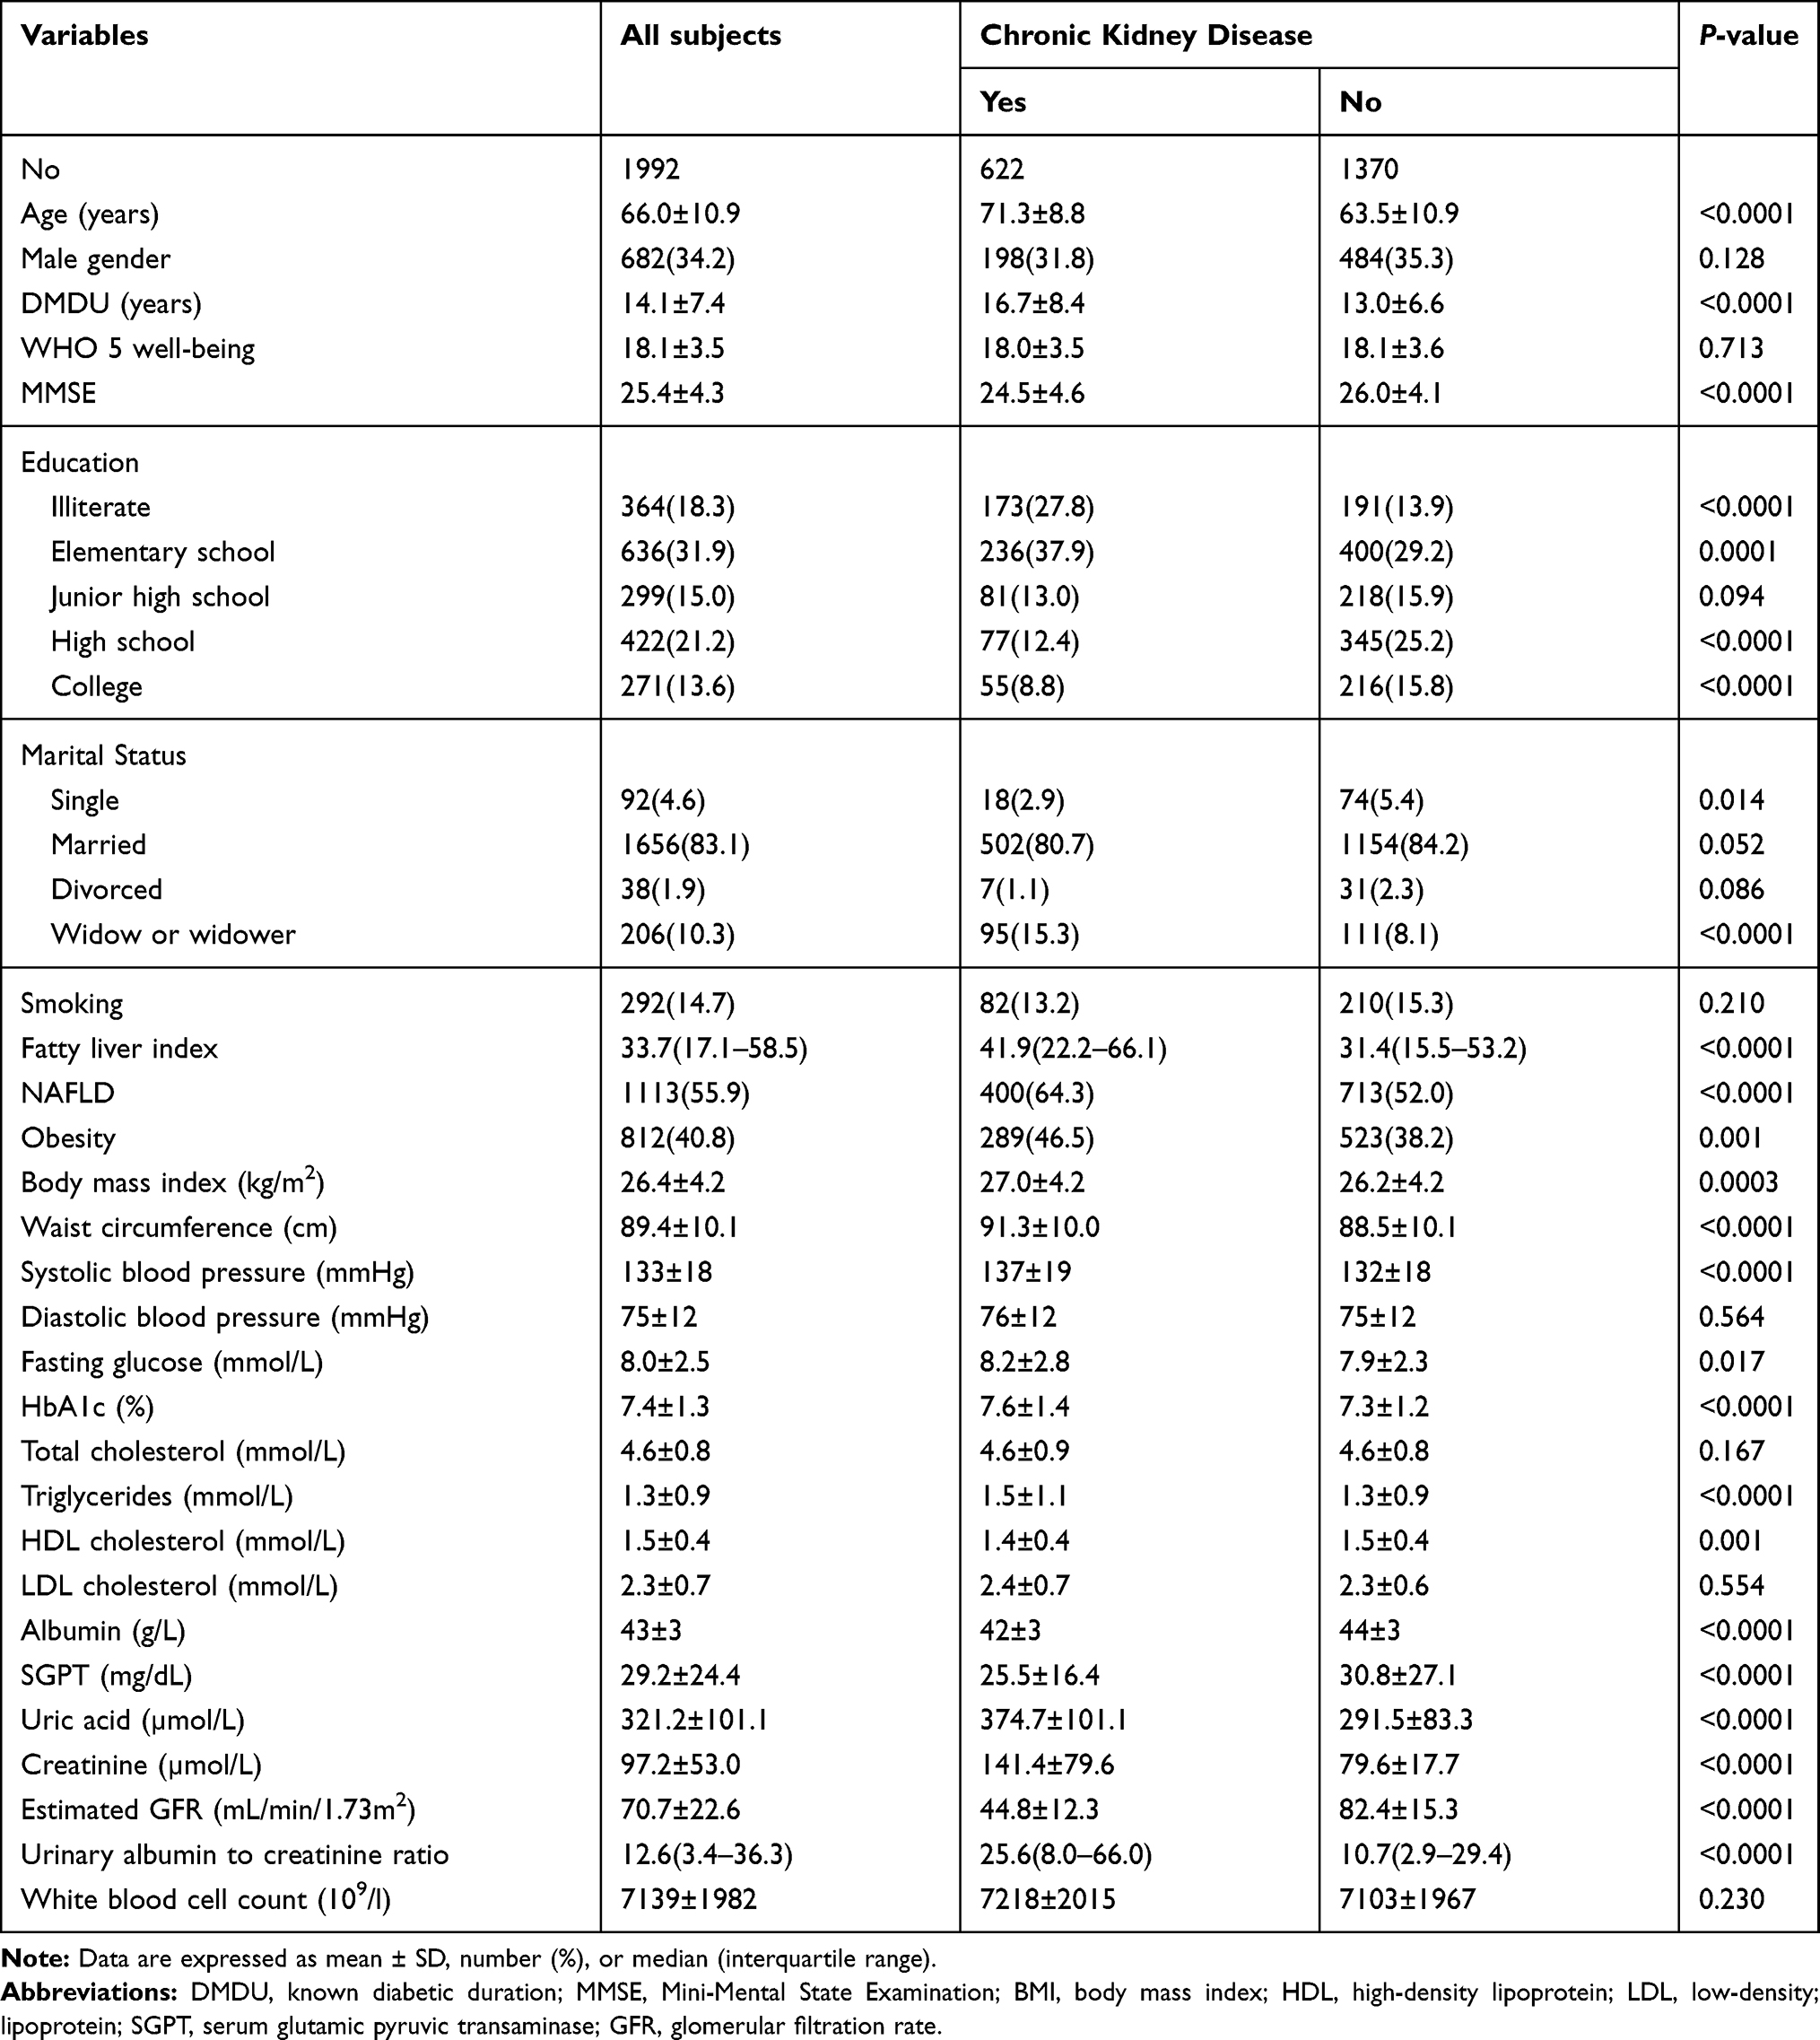 |
Table 1 Baseline Clinical and Biochemical Characteristics in Type 2 Diabetes Patients with and Without Chronic Kidney Disease |
Baseline Clinical and Biochemical Characteristics of the T2DM Patients with and Without NAFLD
The baseline clinical and biochemical characteristics of the T2DM patients with and without NAFLD are shown in Table 2. The NAFLD patients were predominantly male, younger, had a higher rate of education to junior high school, cut-off value of FLI ≥60, smoking, CKD, and obesity, and a lower rate of education to high school than the patients without NAFLD (P<0.05). In addition, the patients with NAFLD had a higher BMI, waist circumference, SBP, diastolic blood pressure, fasting glucose, HbA1c, total cholesterol, triglycerides, LDL-C, SGPT, FLI, fibrosis-4 index, UA, creatinine level, UACR, and WBC count than the patients without NAFLD (P<0.05). The patients with NAFLD also had a lower MMSE score and lower levels of DMDU, HDL-C, and eGFR than the patients without NAFLD (P<0.05).
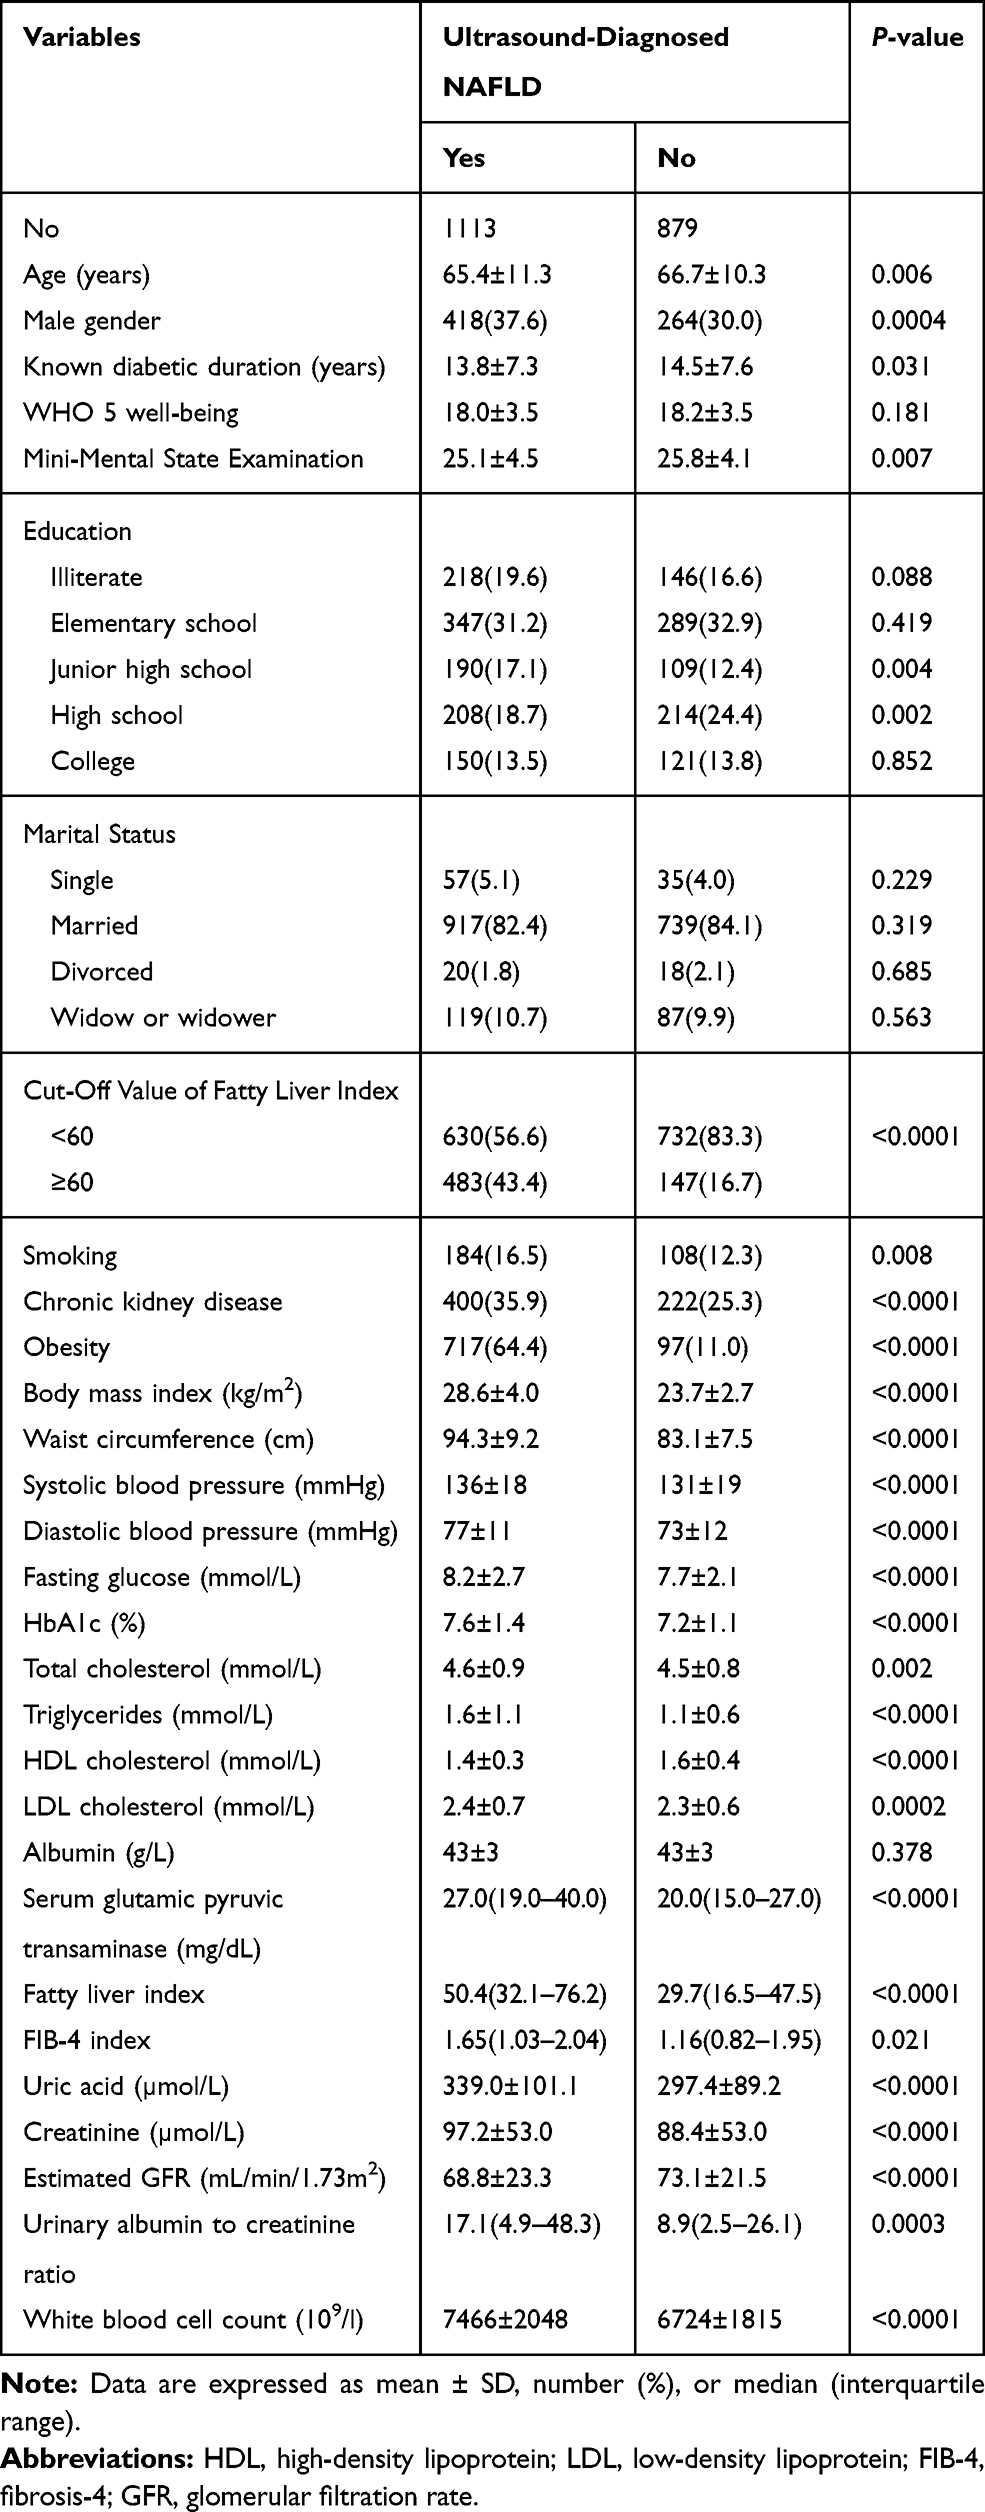 |
Table 2 Baseline Clinical and Biochemical Characteristics in Type 2 Diabetes Patients with and Without Nonalcoholic Fatty Liver Disease |
Associations Among NAFLD and Other Factors with CKD in the Patients with T2DM
In univariate regression analysis (Table 3), NAFLD was associated with an increased odds of CKD. Older age, diabetes duration, BMI, SBP, triglycerides, HbA1c, UA, SGPT, obesity, and current use of medications (insulin, lipid-lowering, antihypertensive drugs) were also associated with an increased odds of CKD, whereas gender, smoking, and LDL-C were not. In multivariate regression analysis (Table 3), the association between NAFLD and CKD (OR=1.83, 95% CI, 1.38–2.42, P<0.0001) was not significantly affected by adjustments for gender and age (model 1). Additional adjustments for baseline confounding factors did not alter the significant relationship between NAFLD and CKD (OR=1.59, 95% CI, 1.12–2.25, P=0.009) (model 2).
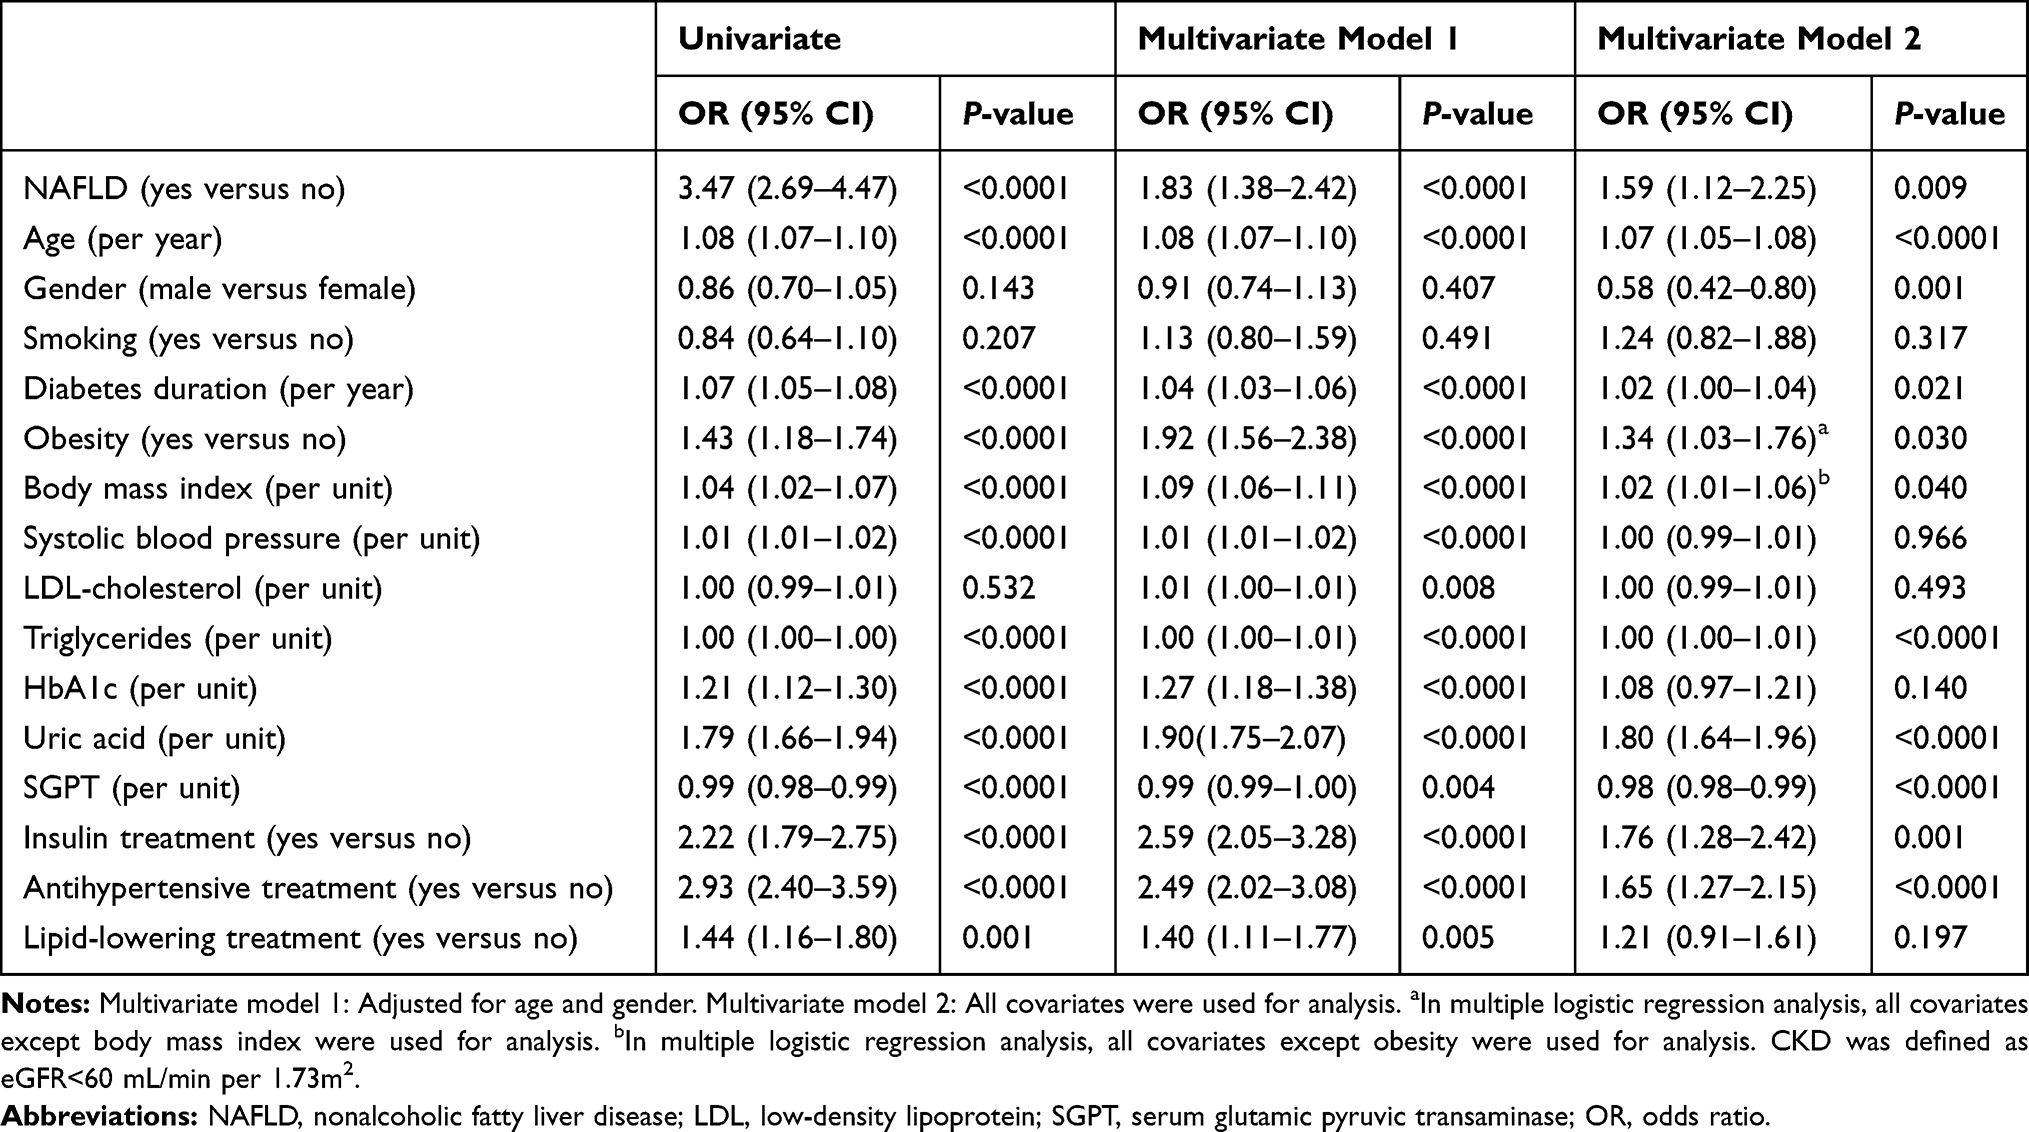 |
Table 3 Univariate and Multivariate Logistic Regression Analyses Showing Associations Among Nonalcoholic Fatty Liver Disease and Other Factors with Chronic Kidney Disease Among the Patients with Type 2 Diabetes |
SEM Analysis
As with the multiple logistic regression models described above (Table 3), we designed two SEM models to assess the common and unique risk factors for CKD and NAFLD. The estimated MVPA with parameters and statistical significance of individual paths is shown in Figure 1. The estimated model demonstrated good model fit, with CFI, 0.93; RMSEA, 0.05; and SRMSR, 0.03 (Figure 1A). There were statistically significant positive direct effects from triglycerides, UA, age, and HbA1c on CKD, and a statistically significant negative direct effect from albumin on CKD (Figure 1A). The model explained 22% of the variability in CKD. Although BMI, education to junior high school or below, and SBP had no direct effect on CKD, BMI had an indirect effect on CKD (β=0.097) through triglycerides. Education to junior high school or below had an indirect effect on CKD (β=0.072) through HbA1c. SBP had an indirect effect on CKD (β=0.109) through UA. In addition, the estimated model demonstrated good model fit, with CFI, 0.97; RMSEA, 0.04; and SRMSR, 0.03 (Figure 1B). There were statistically significant positive direct effects from triglycerides, BMI, WBC count, UA, SGPT, age, and smoking on NAFLD (Figure 1B). The model explained 43% of the variability in NAFLD. Although education to junior high school or below and HbA1c had no direct effect on NAFLD, education to junior high school or below had an indirect effect on NAFLD (β=0.072) through HbA1c. In addition, HbA1c had an indirect effect on NAFLD through triglycerides and SGPT (β=0.094, β=0.113). The variables included in the SEMs are shown in Tables S1 and S2. According to these results, the risk factors common to CKD and NAFLD were age, triglycerides, and UA, while the unique risk factors were albumin and HbA1c for CKD, and BMI, WBC, SGPT, and smoking for NAFLD.
Path Analysis
The hypothesis and results of the initial path models a and b are illustrated in Figure 2. This approach was predicated on the hypothesis that UA and BMI may have exerted causal effects on CKD risk status and NAFLD. The simple path model for confirmation factor analysis showed that UA (β=0.448, P<0.001) and BMI (β=0.597, P<0.001) significantly influenced CKD risk status and NAFLD, respectively. Path models c and d were drawn in a similar manner from UA and BMI to CKD risk status and NAFLD. Associations between UA and BMI were illustrated using two-way arrows (Figure 2). After standardizing all of the variables, the final model showed that CKD risk status was predicted by UA (β=0.437, P<0.001) and BMI (β=0.063, P<0.05), and that NAFLD was also predicted by UA (β=0.124, P<0.001) and BMI (β=0.574, P<0.001). Both UA and BMI were associated with the risks of CKD and NAFLD, and we believe that this model is consistent with the renal-metabolic law.
Bidirectional Relationship Between CKD and NAFLD
As with the multiple logistic regression models and path models described above, we designed four SEMs to assess whether there was a bidirectional relationship between NAFLD and CKD risk status (Figure 3). Models a and b depicted the SEMs for CKD risk status outcomes. Model a showed that in assessments of the role of NAFLD leading to obesity (β=0.597, P<0.001), NAFLD had a significant direct effect on CKD risk status (β=0.114, P<0.001), and that this effect was indirectly through BMI and UA. AMOS analysis showed that the model had a close fit (CFI, 0.97; SRMSR, 0.04), indicating the statistical plausibility of this pathway. We then assessed the role of obesity leading to NAFLD in model b, and the results also showed an acceptable fit of the model (CFI, 0.97; SRMSR, 0.04), providing additional support for the significant direct effect of NAFLD on the risk of CKD (β=0.114, P<0.001), and the significant indirect effect of BMI on CKD through NAFLD (β=0.597, P<0.001) and UA (β=0.181, P<0.001).
The SEMs for the outcome of NAFLD were assessed in models c and d. In model c, CKD was shown to have a significant direct effect on NAFLD (β=0.192, P<0.001) in assessments of the role of NAFLD leading to obesity (β=0.593, P<0.001), whereas BMI had a significant indirect effect on NAFLD through CKD risk status and UA. These results suggested that an increase in NAFLD was associated with an increase in BMI, which in turn led to an increase in UA level, which in turn led to an increase in the risk of CKD. The direct effect of BMI on the risk of CKD was not significant, however the indirect effect of BMI on the risk of CKD (through UA (β=0.132, P<0.001)) was significant. Model c (CFI, 0.99; SRMSR, 0.02) had a better fit than model a, suggesting that model c represented a more plausible explanation of these associations than model a. In addition, the closer fit of model d (CFI, 0.99; SRMSR, 0.02) compared to model c with regards to the role of obesity leading to NAFLD (β=0.579, P<0.001) suggested that the risk of CKD had a significant direct effect on NAFLD (β=0.126, P<0.001). BMI seemed to both directly and indirectly affect NAFLD through an elevated UA level and the risk of CKD. Taken together, models a, c, and d appeared to be the most plausible, with each model suggesting that there may have been a bidirectional relationship between NAFLD and CKD risk status. NAFLD impacted the risk of CKD directly, CKD impacted NAFLD directly, and NAFLD indirectly affected the risk of CKD through BMI and UA.
Discussion
In the patients with T2DM in this study, NAFLD was associated with an increased risk of CKD, and CKD was associated with an increased risk of NAFLD. Moreover, this association remained after controlling for conventional risk factors including age, gender, BMI, SBP, UA, SGPT, diabetes duration, HbA1c, LDL-C, triglycerides, smoking, and current use of medications. The risk factors common to CKD and NAFLD were age, triglycerides, and UA, while the unique risk factors were albumin and HbA1c for CKD, and BMI, WBC, SGPT, and smoking for NAFLD. Three of four SEMs were plausible and suggested a bidirectional relationship between NAFLD and CKD, and that this relationship was mediated by BMI and UA. To the best of our knowledge, this is the first study to investigate the common and unique risk factors and bidirectional relationship between CKD and NAFLD in patients with T2DM.
In this study, SEM analysis demonstrated that age, triglyceride, UA, albumin, and HbA1c levels had statistically significant direct effects on CKD, and the final model could explain 22% of the variability in CKD. Age, triglycerides, BMI, UA, WBC count, SGPT, and smoking had statistically significant direct effects on NAFLD, and the final model could explain 43% of the variability in NAFLD. According to these results, the risk factors common to CKD and NAFLD were age, triglycerides, and UA. These findings are consistent with previous studies in which hyperuricemia, old age, and higher level of triglycerides were strongly associated with the risk of CKD23,24 and NAFLD25,26 in patients with T2DM. Furthermore, the risk factors unique to CKD were albumin and HbA1c, and those unique to NAFLD were BMI, WBC, SGPT, and smoking. Previous studies have also reported that hypoalbuminemia and hyperglycemia were uniquely associated with the progression of kidney disease in patients with T2DM.27,28 As expected, we found a strong significant association between NAFLD and BMI. As NAFLD is associated with insulin resistance, dyslipidemia, hypertension, and obesity, it is considered to be a liver manifestation of the metabolic syndrome.29 Both excessive BMI and visceral obesity are known risk factors for NAFLD, and around 66% of patients with obesity and T2DM have been reported to exhibit hepatic steatosis.2,30 Furthermore, some prior studies have indicated that WBC,31 SGPT,32 and smoking33 are better predictors of NAFLD. The findings of the current study support that these factors do have direct effects on NAFLD. Surprisingly, our results did not show associations between WBC, SGPT, or smoking and CKD. WBC34 and smoking35 have been reported to be risk factors for a decline in kidney function. However, consistent with our findings, Sato et al did not find an association between WBC36 and eGFR. Similarly, we found that the patients with CKD also had lower levels of SGPT than the patients without CKD (Table 1). This finding is consistent with a previous study that reported lower SGPT levels in patients with CKD on hemodialysis (with or without viral hepatitis) than in patients with normal renal function.37 This may explain the lack of an association between SGPT and CKD in the present study.
Our findings regarding NAFLD and CKD are consistent with those of previous studies.6,7 Targher et al reported that patients with diabetes and NAFLD had higher rates of diabetic nephropathy.6 In addition, Hwang et al reported a close association between microalbuminuria and NAFLD in prediabetic patients and in those with newly diagnosed diabetes.38
In the present study, multivariate logistic regression models 1 and 2 indicated the robustness of the effect of NAFLD on CKD. Furthermore, path models based on covariance structure analysis confirmed that the relationship between NAFLD and CKD was mediated by BMI and UA. Moreover, four biologically plausible SEMs39 identified a bidirectional relationship between NAFLD and CKD in addition to mediation of this effect through BMI and UA. Obesity has been associated with CKD,40 and this was shown in model 2 (Table 1) which incorporated another 14 potential risk factors. Relationships among CKD, obesity, and NAFLD were further investigated using the mediation approach propose by Baron and Kenny,20 and the results showed that BMI and UA mediated the relationship between CKD and NAFLD. The results of the direct and indirect effects in the four path models supported the bidirectional relationship between CKD and NAFLD, and that BMI and UA mediated this relationship.
In addition to the novel application of complex statistical methods in this study, the results suggest potential pathways that could be used to prevent and detect CKD via screening of NAFLD. Furthermore, the significance of our results is supported by a previous consensus statement on the association with hepatorenal syndrome.41 This consensus statement states that liver disease may increase the risk of CKD based on evidence from many studies that have supported the association between NAFLD and increased systemic inflammation, and that this inflammatory component of NAFLD may also be linked to CKD.
There are several limitations to this study. First, causal inference is generally not possible in cross-sectional studies as temporal associations cannot be assessed. Therefore, we used SEM analysis as it allowed us to test the statistical plausibility of the hypothesized causal relationships. The SEMs were shown to have a close fit, therefore suggesting the plausibility of the proposed causal relationships given the potentially complex relationships between CKD and NAFLD,42 and the paths could be tested for significance. Further longitudinal studies are warranted to examine this potential bidirectional relationship in greater detail. Second, we included a middle-aged, elderly Chinese population, and thus our results may not be generalizable to other populations. Third, we only included WBC count in the SEM models to assess the common and unique risk factors for CKD and NAFLD. However, other systemic inflammatory factors including C reactive protein, serum amyloid A protein, and fibrinogen should also be tested in future studies. Fourth, patients with NAFLD who consumed a low-fat/low-calorie diet and exercise often have reduced liver inflammation and scarring. However, patients with CKD who consume a low-protein diet and are inactive have reduced physical functioning and performance. Hence, diet and physical activity are different between patients with NAFLD and CKD, and this may affect the disease status. In the present study, all patients were managed through a comprehensive diabetes program that was reimbursed by the National Health Insurance system, and a dietitian reviewed and modified their dietary habits. However, analyzing detailed diet records and the nutritional content of the diets and physical activity of the patients was beyond the scope of this study. Fifth, in the present study, the NAFLD was assessed by ultrasound but was not confirmed pathologically. Although liver biopsy is the gold standard to diagnose fatty liver,43 it is difficult to perform liver biopsies to assess NAFLD in clinical practice. Furthermore, in accordance with the Taiwan Bureau of National Health Insurance guidelines, liver biopsy is not routinely measured in patients with fatty liver, and thus no liver biopsies to confirm the diagnosis of NAFLD data were available in the current study. Moreover, Joy et al has been reported that the sensitivity and specificity of ultrasound in the diagnosis of fatty liver, as assessed by liver biopsy, were 60–94% and 84–95%, respectively.44 Furthermore, a previous meta-analysis also reported that the sensitivity and specificity of ultrasound in the diagnosis of fatty liver, as assessed by liver biopsy, were 84.8% and 93.6%,45 respectively, and demonstrated that ultrasonography allowed for the accurate and reliable detection of moderate to severe fatty liver compared to histology. Because of its safety, low cost, and accessibility, ultrasound is likely to be the imaging technique of choice for screening fatty liver in most clinical settings. In addition, Koh et al showed that serum adipocyte fatty acid-binding protein levels were associated with NAFLD in T2DM patients, and that the severity of NAFLD could only be detected by ultrasound.46
Conclusions
We used SEMs to simultaneously model direct and indirect effects of the common and unique risk factors and bidirectional relationship between CKD and NAFLD in patients with T2DM. The results showed that the risk factors common to CKD and NAFLD were age, triglycerides, and UA, while the unique risk factors for CKD were albumin and HbA1c, and for NAFLD were BMI, WBC, SGPT and smoking. In addition, NAFLD was independently associated with CKD in a bidirectional relationship mediated by BMI and UA in our Chinese population with T2DM. Further prospective studies on the bidirectional relationship between CKD and NAFLD are warranted to assess the causal inference. As both NAFLD and CKD are common diseases worldwide, our findings may provide important public health implications for the prevention and management of both conditions.
Acknowledgments
The authors would like to thank E-Da Hospital of the Republic of China, Taiwan, for financially supporting this research under Contract EDAHP108009. The authors would also like to express their gratitude to the staff and members of the diabetes care team for their assistance with various measurements and other organizational aspects of this study.
Author Contributions
All authors contributed toward data analysis, drafting and revising the paper, gave final approval of the version to be published and agree to be accountable for all aspects of the work.
Disclosure
The authors report no conflict of interest in this work.
References
1. American Diabetes Association. Microvascular complications and foot care. Sec. 9. In standards of medical care in diabetes-2015. Diabetes Care. 2015;38(Supplement_1):S58–S66. doi:10.2337/dc15-S012
2. Leite NC, Salles GF, Araujo AL, Villela-Nogueira CA, Cardoso CR. Prevalence and associated factors of non-alcoholic fatty liver disease in patients with type 2 diabetes mellitus. Liver Int. 2009;29(1):113–119. doi:10.1111/j.1478-3231.2008.01718.x
3. Keith DS, Nichols GA, Gullion CM, Brown JB, Smith DH. Longitudinal follow-up and outcomes among a population with chronic kidney disease in a large managed care organization. Arch Intern Med. 2004;164(6):659–663. doi:10.1001/archinte.164.6.659
4. Whalley S, Puvanachandra P, Desai A, Kennedy H. Hepatology outpatient service provision in secondary care: a study of liver disease incidence and resource costs. Clin Med (Lond). 2007;7(2):119–124. doi:10.7861/clinmedicine.7-2-119
5. Targher G, Day CP, Bonora E. Risk of cardiovascular disease in patients with nonalcoholic fatty liver disease. N Engl J Med. 2010;363(14):1341–1350. doi:10.1056/NEJMra0912063
6. Targher G, Chonchol M, Bertolini L, et al. Increased risk of CKD among type 2 diabetics with nonalcoholic fatty liver disease. J Am Soc Nephrol. 2008;19(8):1564–1570. doi:10.1681/ASN.2007101155
7. Li Y, Zhu S, Li B, et al. Association between non-alcoholic fatty liver disease and chronic kidney disease in population with prediabetes or diabetes. Int Urol Nephrol. 2014;46(9):1785–1791. doi:10.1007/s11255-014-0796-9
8. Musso G, Gambino R, Tabibian JH, et al. Association of non-alcoholic fatty liver disease with chronic kidney disease: a systematic review and meta-analysis. PLoS Med. 2014;11(7):e1001680. doi:10.1371/journal.pmed.1001680
9. Fox CS, Larson MG, Leip EP, Culleton B, Wilson PW, Levy D. Predictors of new-onset kidney disease in a community-based population. JAMA. 2004;291(7):844–850. doi:10.1001/jama.291.7.844
10. Iseki K, Ikemiya Y, Kinjo K, Inoue T, Iseki C, Takishita S. Body mass index and the risk of development of end-stage renal disease in a screened cohort. Kidney Int. 2004;65(5):1870–1876. doi:10.1111/j.1523-1755.2004.00582.x
11. Kabir MA, Uddin MZ, Siddiqui NI, et al. Prevalence of non-alcoholic fatty liver disease and its biochemical predictors in patients with type-2 diabetes mellitus. Mymensingh Med J. 2018;27(2):237–244.
12. Byrne CD, Targher G. NAFLD: a multisystem disease. J Hepatol. 2015;62(1 Suppl):S47–S64. doi:10.1016/j.jhep.2014.12.012
13. Chang YH, Lei CC, Lin KC, Chang DM, Hsieh CH, Lee YJ. Serum uric acid level as an indicator for CKD regression and progression in patients with type 2 diabetes mellitus-a 4.6-year cohort study. Diabetes Metab Res Rev. 2016;32(6):557–564. doi:10.1002/dmrr.2768
14. American Diabetes Association. Diagnosis and classification of diabetes mellitus. Diabetes Care. 2012;35(Supplement_1):S64–S71. doi:10.2337/dc12-s064
15. Kong X, Ma Y, Chen J, et al. Chinese eGFR investigation collaboration. Evaluation of the chronic kidney disease epidemiology collaboration equation for estimating glomerular filtration rate in the Chinese population. Nephrol Dial Transplant. 2013;28(3):641–651. doi:10.1093/ndt/gfs491
16. Levey AS, de Jong PE, Coresh J, et al. The definition, classification, and prognosis of chronic kidney disease: a KDIGO controversies conference report. Kidney Int. 2011;80(1):17–28. doi:10.1038/ki.2010.483
17. Hanna EB, Chen AY, Roe MT, Wiviott SD, Fox CS, Saucedo JF. Characteristics and in-hospital outcomes of patients with non-ST-segment elevation myocardial infarction and chronic kidney disease undergoing percutaneous coronary intervention. JACC Cardiovasc Interv. 2011;4(9):1002–1008. doi:10.1016/j.jcin.2011.05.022.
18. Bedogni G, Bellentani S, Miglioli L, et al. The fatty liver index: a simple and accurate predictor of hepatic steatosis in the general population. BMC Gastroenterol. 2006;6:33. doi:10.1186/1471-230X-6-33
19. Pais R, Bourron O. Fatty liver and renal function impairment-time for awareness? J Hepatol. 2017:
20. Baron RM, Kenny DA. The moderator-mediator variable distinction in social psychological research: conceptual, strategic, and statistical considerations. J Pers Soc Psychol. 1986;51(6):1173–1182. doi:10.1037/0022-3514.51.6.1173
21. Chinnadurai R, Ritchie J, Green D, Kalra PA. Non-alcoholic fatty liver disease and clinical outcomes in chronic kidney disease. Nephrol Dial Transplant. 2019;34(3):449–457. doi:10.1093/ndt/gfx381
22. Byrne BM. Structural Equation Modeling with AMOS: Basic Concepts, Applications, and Programming.
23. De Cosmo S, Viazzi F, Pacilli A, et al.; AMD-annals study group. Serum uric acid and risk of CKD in type 2 diabetes. Clin J Am Soc Nephrol. 2015;10(11):1921–1929. doi:10.2215/CJN.03140315
24. Zaman SB, Karim MA, Hossain N, Al Kibria GM, Islam SMS. Plasma triglycerides as a risk factor for chronic kidney disease in type 2 diabetes mellitus: evidence from northeastern Thailand. Diabetes Res Clin Pract. 2018;138:238–245. doi:10.1016/j.diabres.2018.02.011
25. Hossain IA, Faruque MO, Akter S, Bhuiyan FR, Rahman MK, Ali L. Elevated levels of serum uric acid and insulin resistance are associated with nonalcoholic fatty liver disease among prediabetic subjects. Trop Gastroenterol. 2016;37(2):101–111. doi:10.7869/tg.334
26. Tomizawa M, Kawanabe Y, Shinozaki F, et al. Triglyceride is strongly associated with nonalcoholic fatty liver disease among markers of hyperlipidemia and diabetes. Biomed Rep. 2014;2(5):633–636. doi:10.3892/br.2014.309
27. Leehey DJ, Kramer HJ, Daoud TM, Chatha MP, Isreb MA. Progression of kidney disease in type 2 diabetes-beyond blood pressure control: an observational study. BMC Nephrol. 2005;6(1):8. doi:10.1186/1471-2369-6-8
28. Bash LD, Selvin E, Steffes M, Coresh J, Astor BC. Poor glycemic control in diabetes and the risk of incident chronic kidney disease even in the absence of albuminuria and retinopathy: Atherosclerosis Risk in Communities (ARIC) Study. Arch Intern Med. 2008;168(22):2440–2447. doi:10.1001/archinte.168.22.2440
29. Loomba R, Abraham M, Unalp A, et al. Nonalcoholic steatohepatitis clinical research network. Association between diabetes, family history of diabetes, and risk of nonalcoholic steatohepatitis and fibrosis. Hepatology. 2012;56(3):943–951. doi:10.1002/hep.25772
30. Targher G, Bertolini L, Padovani R, et al. Prevalence of nonalcoholic fatty liver disease and its association with cardiovascular disease among type 2 diabetic patients. Diabetes Care. 2007;30(5):1212–1218. doi:10.2337/dc06-2247
31. Chung GE, Yim JY, Kim D, et al. Associations between white blood cell count and the development of incidental nonalcoholic fatty liver disease. Gastroenterol Res Pract. 2016;2016:7653689. doi:10.1155/2016/7653689
32. Sanyal D, Mukherjee P, Raychaudhuri M, Ghosh S, Mukherjee S, Chowdhury S. Profile of liver enzymes in non-alcoholic fatty liver disease in patients with impaired glucose tolerance and newly detected untreated type 2 diabetes. Indian J Endocrinol Metab. 2015;19(5):597–601. doi:10.4103/2230-8210.163172
33. Hamabe A, Uto H, Imamura Y, et al. Impact of cigarette smoking on onset of nonalcoholic fatty liver disease over a 10-year period. J Gastroenterol. 2011;46(6):769–778. doi:10.1007/s00535-011-0376-z
34. Fan F, Jia J, Li J, Huo Y, Zhang Y. White blood cell count predicts the odds of kidney function decline in a Chinese community-based population. BMC Nephrol. 2017;18(1):190. doi:10.1186/s12882-017-0608-4
35. Orth SR, Hallan SI. Smoking: a risk factor for progression of chronic kidney disease and for cardiovascular morbidity and mortality in renal patients–absence of evidence or evidence of absence? Clin J Am Soc Nephrol. 2008;3(1):226–236. doi:10.2215/CJN.03740907
36. Sato KK, Hayashi T, Harita N, et al. Elevated white blood cell count worsens proteinuria but not estimated glomerular filtration rate: the Kansai Healthcare Study. Am J Nephrol. 2011;34(4):324–329. doi:10.1159/000330845
37. Sette LH, Almeida Lopes EP. Liver enzymes serum levels in patients with chronic kidney disease on hemodialysis: a comprehensive review. Clinics (Sao Paulo). 2014;69(4):271–278. doi:10.6061/clinics/2014(04)09
38. Hwang ST, Cho YK, Yun JW, et al. Impact of nonalcoholic fatty liver disease on microalbuminuria in patients with prediabetes and diabetes. Intern Med J. 2010;40(6):437–442. doi:10.1111/j.1445-5994.2009.01979.x
39. Kline RB. Principles and Practice of Structural Equation Modeling.
40. Kovesdy CP, Furth SL, Zoccali C. World kidney day steering committee. obesity and kidney disease: hidden consequences of the epidemic. Can J Kidney Health Dis. 2017;4:2054358117698669. doi:10.1177/2054358117698669.
41. Ng CK, Chan MH, Tai MH, Lam CW. Hepatorenal syndrome. Clin Biochem Rev. 2007;28(1):11–17.
42. Marcuccilli M, Chonchol M. NAFLD and chronic kidney disease. Int J Mol Sci. 2016;17(4):562. doi:10.3390/ijms17040562
43. Angulo P. Nonalcoholic fatty liver disease. N Engl J Med. 2002;346(16):1221–1231. doi:10.1056/NEJMra011775
44. Joy D, Thava VR, Scott BB. Diagnosis of fatty liver disease: is biopsy necessary? Eur J Gastroenterol Hepatol. 2003;15(5):539–543. doi:10.1097/01.meg.0000059112.41030.2e
45. Hernaez R, Lazo M, Bonekamp S, et al. Diagnostic accuracy and reliability of ultrasonography for the detection of fatty liver: a meta- analysis. Hepatology. 2011;54(3):1082–1090. doi:10.1002/hep.24452
46. Koh JH, Shin YG, Nam SM, Lee MY, Chung CH, Shin JY. Serum adipocyte fatty acid-binding protein levels are associated with nonalcoholic fatty liver disease in type 2 diabetic patients. Diabetes Care. 2009;32(1):147–152. doi:10.2337/dc08-1379
 © 2020 The Author(s). This work is published and licensed by Dove Medical Press Limited. The
full terms of this license are available at https://www.dovepress.com/terms
and incorporate the Creative Commons Attribution
- Non Commercial (unported, 3.0) License.
By accessing the work you hereby accept the Terms. Non-commercial uses of the work are permitted
without any further permission from Dove Medical Press Limited, provided the work is properly
attributed. For permission for commercial use of this work, please see paragraphs 4.2 and 5 of our Terms.
© 2020 The Author(s). This work is published and licensed by Dove Medical Press Limited. The
full terms of this license are available at https://www.dovepress.com/terms
and incorporate the Creative Commons Attribution
- Non Commercial (unported, 3.0) License.
By accessing the work you hereby accept the Terms. Non-commercial uses of the work are permitted
without any further permission from Dove Medical Press Limited, provided the work is properly
attributed. For permission for commercial use of this work, please see paragraphs 4.2 and 5 of our Terms.