Back to Journals » Cancer Management and Research » Volume 18

Combining Serum PVT1 Exon 4A and Exon 9 with Serum Prostate-Specific Antigen Shows Potential for Improving Identification and Risk Stratification of Prostate Cancer
Authors Asante-Asamani E, Bonacci RE, Hove T, Sewwandi de Silva SHD, Liss MA, Leach R, Ogunwobi OO
Received 3 April 2026
Accepted for publication 16 June 2026
Published 23 June 2026 Volume 2026:18 604901
DOI https://doi.org/10.2147/CMAR.S604901
Checked for plagiarism Yes
Review by Single anonymous peer review
Peer reviewer comments 2
Editor who approved publication: Dr Giuseppe Colloca
Emmanuel Asante-Asamani,1 Rachel E Bonacci,2 Tinovimba Hove,1 SH Dinuka Sewwandi de Silva,1,3 Michael A Liss,4 Robin Leach,5 Olorunseun O Ogunwobi2
1Department of Mathematics, Clarkson University, Potsdam, NY, USA; 2Department of Biochemistry and Molecular Biology, Michigan State University, East Lansing, MI, USA; 3Department of Mathematics, University of Kelaniya, Colombo, Sri Lanka; 4Center for Microbiome Innovation, University of California San Diego Health, San Diego, CA, USA; 5Department of Cell Systems and Anatomy, University of Texas Health, San Antonio, TX, USA
Correspondence: Olorunseun O Ogunwobi, Department of Biochemistry and Molecular Biology, Michigan State University, Biochemistry Building, 603 Wilson Road, Room 212A, East Lansing, MI, 48824, USA, Tel +1517-353-0804, Email [email protected]
Purpose: Prostate-specific antigen (PSA), a common screening tool for prostate cancer (PCa), has a high false-positive rate and is largely suboptimal. PSA is also weakly validated in men of African ancestry (moAA), who disproportionately bear the disease burden, necessitating investigation into its widespread use. Previously, we found that plasmacytoma variant translocation 1 (PVT1) exons 4A, 4B, and 9 are overexpressed in PCa tissues. Here, we report on the first serum-based evaluation of these exons to determine their utility in improving detection and risk stratification of PCa.
Patients and Methods: Total RNA was extracted from serum samples obtained retrospectively from 144 multiracial men with elevated PSA who underwent prostate biopsy. Likelihood ratio test was used to evaluate the potential benefit of utilizing these alone or in combination with PSA. Regression analysis was used to evaluate the association of individual biomarkers with the odds of PCa and for evaluating endpoint predictions. Model generalizability was assessed using cross-validation and area under the receiver operating characteristic curve (ROC-AUC). All statistical tests were performed at a 5% level of significance using the Sklearn library in Python.
Results: Our results indicate that combining PSA with PVT1 exon 4A or 9 improves PCa risk stratification in the general population, increasing AUC from 0.72 to 0.75 as well as PCa detection, increasing specificity from 0.41 to 0.59. Within moAA, combining PSA with PVT1 exon 4A improves PCa detection substantially, increasing AUC from 0.44 to 0.67. Remarkably, PVT1 exon 4A alone achieves an AUC of 0.79.
Conclusion: Our study provides preliminary exploratory evidence to support PVT1 exon 4A and PVT1 exon 9 as promising PCa risk biomarkers that can reduce disparity in PCa detection and management. Further validation in larger patient cohorts will be necessary to establish the clinical utility of these novel biomarkers.
Keywords: prostate cancer, biomarkers, long-noncoding RNA, PVT1
Introduction
Since its introduction to routine healthcare in the 1980s, prostate-specific antigen (PSA) screening has enhanced the detection of new cases of early-stage prostate cancer (PCa) by about 70% and contributed to about 40% reduction in the number of men who would have previously died from PCa.1,2 Despite this significant clinical progress, the low specificity of PSA results in about 750,000 unnecessary biopsies each year (overdiagnosis). Additionally, the limitations of PSA in distinguishing low-grade from high-grade PCa has led to overtreatment of men with indolent disease.3–8 Within the last decade, research has brought forth the development of several novel biomarkers and associated risk prediction models with better specificity than PSA for PCa detection, such as the 4KScore and Prostate Health Index, among others.9–12 However, all these biomarkers were developed and validated in populations predominantly consisting of men of European Ancestry (moEA). Due to this, these screening methods have relatively weak or nonexistent validation in other racial or ethnic subpopulations, specifically in men of African Ancestry (moAA). This is in spite of the fact that roughly 70% more PCa diagnoses were made in moAA compared to moEA within the United States, between 2015 and 2020, and this group is more likely to suffer from over-diagnosis-related complications.13 This disparity in PCa incidence and mortality rate is complex and is thought to be attributed in part to underlying genetic variation as well as environmental and socioeconomic factors.14 Without a doubt, there is a critical need for novel and more specific biomarkers that can more accurately predict PCa, especially in moAA who bear a disproportionately larger burden of PCa. There is also a critical and unmet need to develop risk prediction models that are also validated in populations of moAA.
One notable genetic aberration linked to PCa susceptibility is amplification of the 8q24 chromosomal region.15 Plasmacytoma variant translocation 1 (PVT1) is an oncogenic long non-protein coding gene located on chromosome 8q24. The PVT1 gene contains at least nine exons and encodes a cluster of six microRNAs.16 PVT1 amplification and overexpression has been strongly correlated with PCa incidence, and it has been shown to promote proliferation, invasion and metastasis as well as inducing epithelial-to-mesenchymal transition in PCa.17–19 Not only is full length PVT1 overexpressed in PCa, but we have further demonstrated that three exons of PVT1, namely exons 4A, 4B and 9, are significantly overexpressed in prostate cancer cell lines and tissue obtained from moAA with PCa.20–22 PVT1 exon 9 was found to induce increased proliferation and migration of prostate epithelial cells, formation of invasive tumors in mice, and confer resistance to androgen deprivation therapy, all of which support its clinical viability as an indicator of aggressive PCa.20 We have also reported a significantly higher expression of PVT1 exons 4B and 4A in PCa tissues from moAA with Gleason score ≥8 compared to those with Gleason score ≤,7, suggesting that PVT1 exons 4B and 4A may be well suited for distinguishing between indolent and aggressive PCa.22 These observed associations between PVT1 exons 4A, 4B, and 9 and PCa aggressiveness in moAA make them potential targets for detecting aggressive disease in this underserved and overburdened population.
We have demonstrated that PVT1 exons 4A, 4B and 9 copy numbers, obtained using a quantitative polymerase-chain reaction (qPCR)-based absolute quantification assay,23 can be found in the cell supernatant as well as intracellularly and PVT1 exon detection provided excellent prediction of PCa when used to train a support vector machine.24 However, this previous study was carried out using cellular models. Therefore, in the current study, we have significantly built upon our previous work by analyzing a reasonable sample size of serum samples from men from diverse population groups.
In this study, we investigate the clinical relevance of copy numbers of PVT1 exons 4A, 4B and 9 measured from serum of multiracial men as a biomarker for predicting the risk of PCa and distinguishing between high-grade and low-grade PCa. We hypothesize that our PVT1 biomarkers are differentially expressed between target and control groups. Additionally, we hypothesize that combining PSA with our PVT1 biomarkers would enhance our ability to detect any PCa and distinguish between high-grade and low-grade disease.
Materials and Methods
Participants
This retrospective study utilized serum from multiracial men with elevated PSA who underwent prostate biopsy. Elevated PSA was determined from clinical guidelines of PSA >4.0 ng/mL. Prostate biopsies were performed in accordance with the institution’s IRB. Serum samples were collected before biopsy.
The samples were obtained from the Early Detection Research Network (EDRN) biorepository at the University of Texas Health Science Center in San Antonio. Serum samples were de-identified and donated well before the start of the study for future research use. None of the participants had undergone a prostate biopsy within the 6 months prior to the extraction of serum samples. Due to the nature of the sample donation, there was no follow-up or other measures taken post-analysis within the initial institution or within the Ogunwobi Lab. Serum was extracted for RNA, per exempt protocol (IRB: STUDY00009876), approved initially by the Institutional Review Board of Hunter College of the City University of New York, and subsequently by the Institutional Review Board of Michigan State University. Patient consent was not required by the Institutional Review Board as the study was deemed to be “not human subjects research”. Patient data confidentiality is assured, and the study is in compliance with the Declaration of Helsinki.
Copy Number-Based Quantification Assay for Non-Invasive Detection of PVT1-Derived Transcripts
RNA Extraction
Blood samples were shipped to the Ogunwobi laboratory on dry ice and stored at −80 degrees centigrade prior to analysis. RNA isolation from serum samples was performed using Qiagen miRNeasy Serum/Plasma Kit (Catalog#: 217184). Between 50–200 uL of serum was aliquoted for extraction based on sample availability. Work was performed following exempt non-human subject determined IRB protocol at Michigan State University (STUDY00009876).
Quantification of Serum PVT1 Exons 4A, 4B, and 9 Copy Numbers
The isolated RNA was quantified, and cDNA was synthesized (100–200 ng) using Applied Biosystems™ High-Capacity cDNA Reverse Transcription Kit and thermocycler according to manufacturer’s instructions. To perform digital polymerase chain reaction (dPCR), we used the QuantStudio Absolute Q Digital PCR system (Applied Bioystems) and loaded samples (10 ng/uL) according to manufacturer’s instructions. The copy numbers of PVT1 exons 4A, 4B and 9 were assessed using multiplex technology with differing, non-overlapping, fluorescent dyes attached to individual primers. The copy number of each exon was quantified using the QuantStudio software and recorded. To avoid potential bias, the copy number quantification analysis was performed on blinded data and made available to a separate team for statistical analysis.
Outcome Measurement and Statistical Analysis
Two outcome measures were considered in this study. The first was the risk of any prostate cancer (Gleason ≥6) on prostate biopsy, and the second was the risk of high-grade prostate cancer (Gleason ≥7) on prostate biopsy. Our predictors are prostate-specific antigen (PSA) concentration (obtained from EDRN biorepository), copy numbers of PVT1 exon 9, exon 4A and exon 4B (obtained from the Ogunwobi lab). Following standard practice, we removed observations beyond 1.5x interquartile range (ie, outliers) from further analysis due to their tendency to distort the true distribution of data. Any record for which an outlier existed for any of the features under consideration was removed from the study. Mann–Whitney U-test was used to assess the clinical difference in predictors for each of our binary outcome measures. We used likelihood ratio tests to assess whether the addition of the PVT1 biomarkers to PSA would improve the discriminatory ability of PSA alone in detecting PCa and high-grade PCa. Multiple logistic regression models were developed to predict outcome measures based on three scenarios: PSA alone, PVT1 biomarkers alone, and their combinations with PSA. Model parameters were estimated using 60% of the data associated with each endpoint. To assess the generalizability of the models, stratified k-fold cross-validation was employed with repetitions, using metrics such as area under the curve (AUC) averaged across all repetitions. We performed these analyses for the general population (all races and ethnic groups) and for men of African ancestry (moAA). The predictive accuracy of the best performing models was subsequently assessed at a fixed threshold probability, chosen to maximize Youden’s statistic. Metrics such as sensitivity, specificity, positive predictive value (PPV), and negative predictive value (NPV) were used to evaluate the models. In cases where the class distribution was unbalanced, we used bootstrapping to oversample the underrepresented class to improve the training and evaluation of the models. All statistical tests were performed at a 5% level of significance using the Sklearn library in Python.
Results
A total of 144 serum samples were analyzed. Fifteen percent of the samples are from moAA and 85% from men who identified their race as White. Fifty percent of participants had clinically confirmed PCa (Gleason ≥6) with 25% of the population having high-grade cancer (Gleason ≥ 7).25–27 Information on the baseline PSA serum concentration for each patient is presented in Table 1. We had no missing data. The data was cleaned by removing outliers, leaving 108 samples for further analysis. Our digital PCR assay could not detect any discernible concentration of PVT1 exon 4B (median 0, Table 1), so we excluded this biomarker from the remaining analysis. We tested three primary hypotheses. First, PVT1 exon 4A and exon 9 are differentially expressed between target and control groups for the general population and moAA. Second, addition of PVT1 exons 4A and 9 to PSA improves the informativeness and predictive accuracy of PSA alone in determining the risk of any PCa in the general population and moAA. Third, addition of PVT1 exons 4A and 9 improves the informativeness and predictive accuracy of PSA alone in determining the risk of high-grade PCa in the general population and moAA.
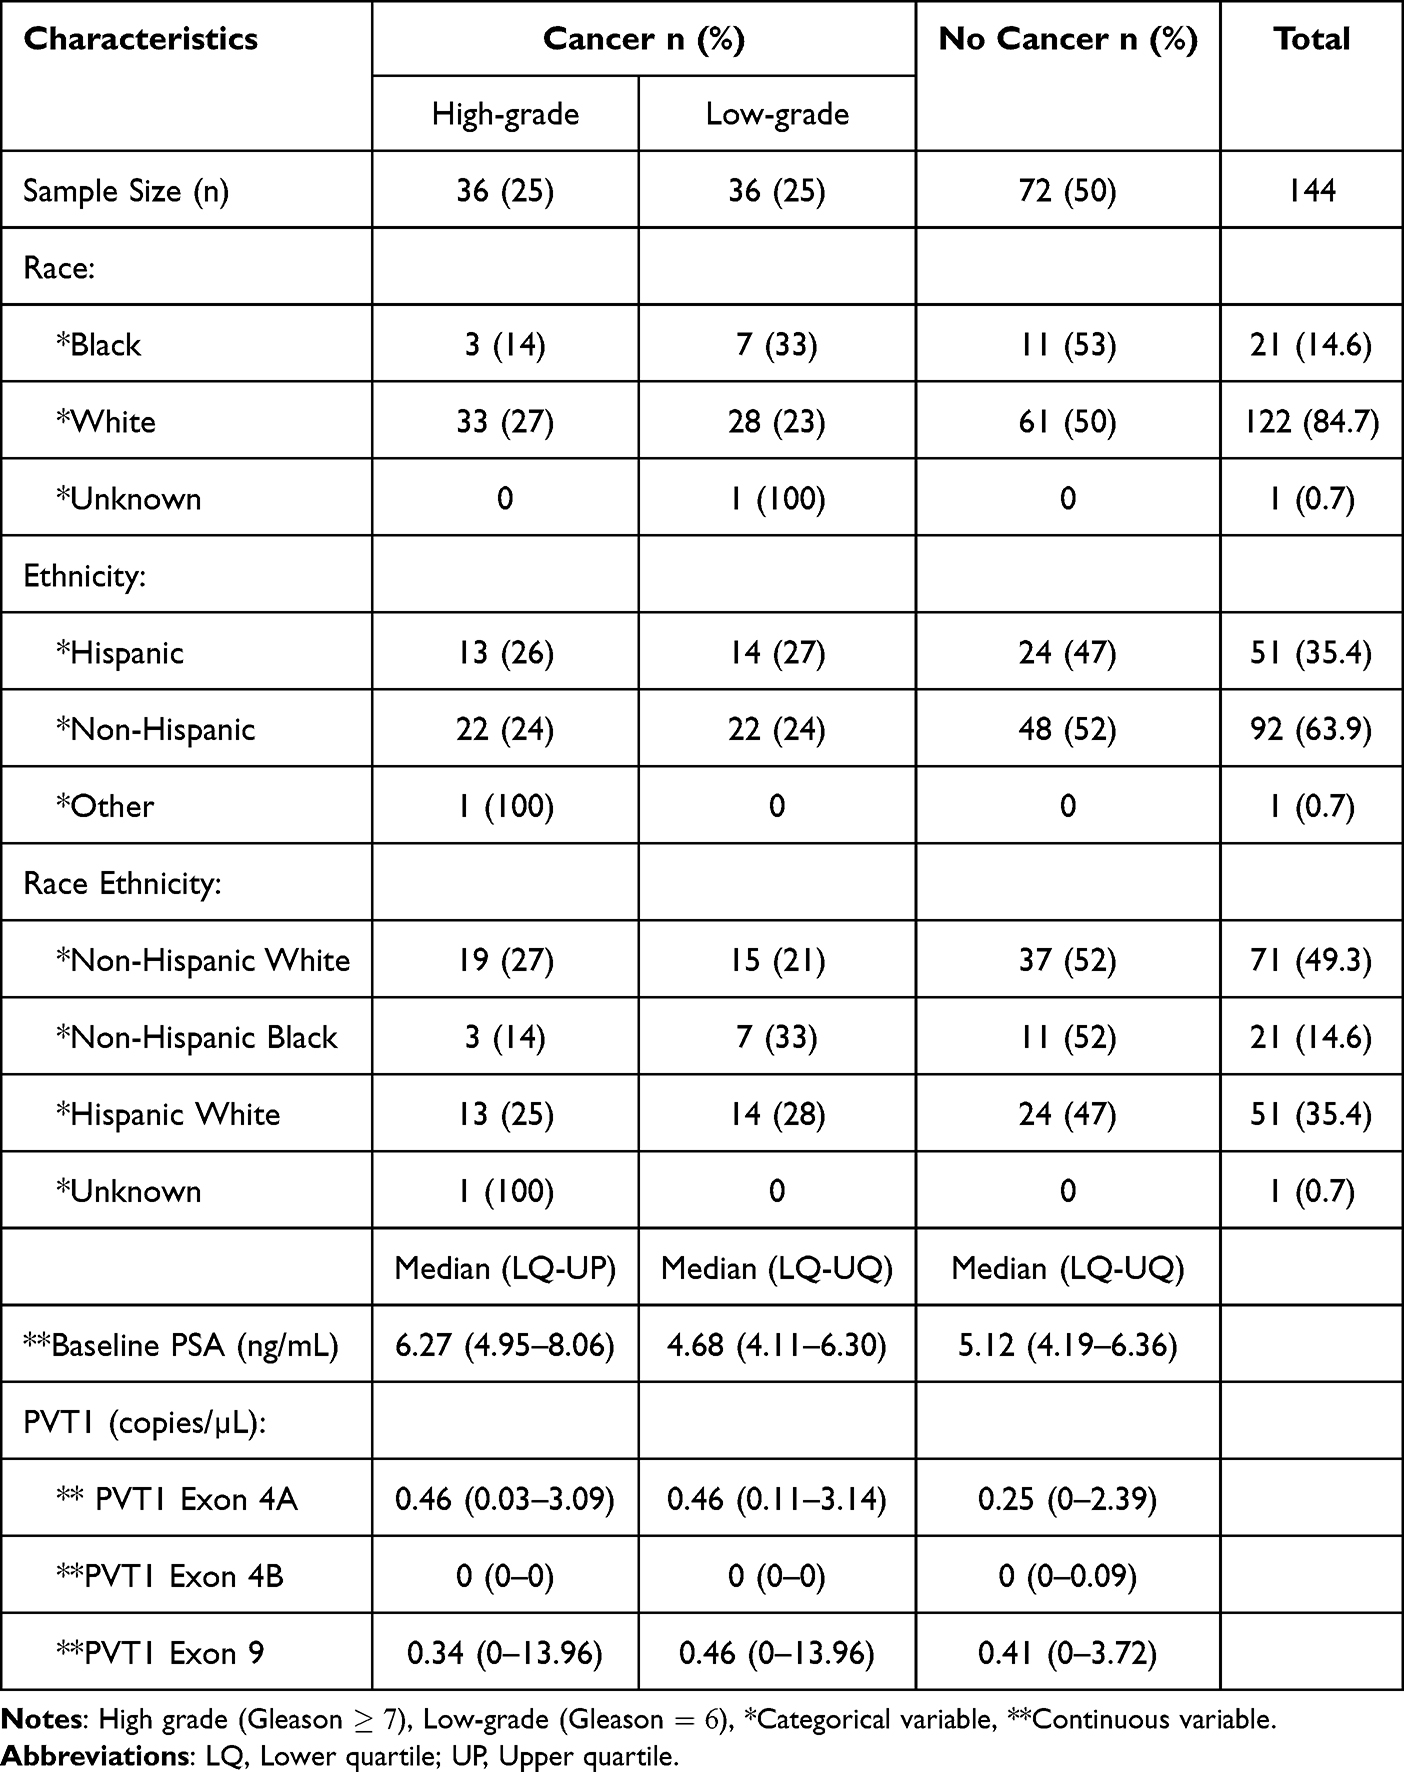 |
Table 1 Patient Demographic and Clinical Variables Among 144 Men with Elevated PSA Categorized by Cancer Status and Grade |
Addition of PVT1 Exon 9 to PSA Shows Potential to Improve Risk Stratification of PCa in the General Population
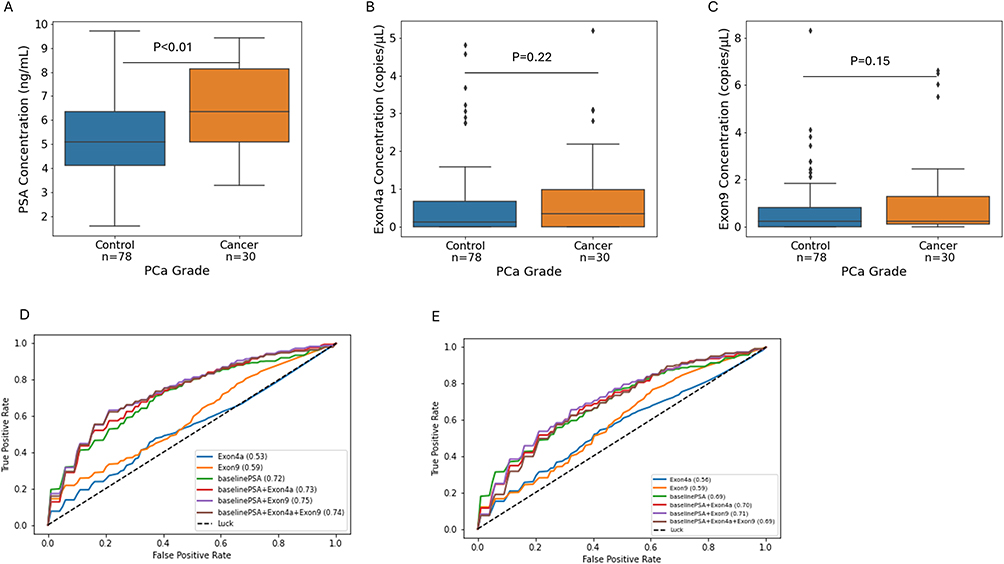
The clinical difference in serum concentration of PSA and derived copy numbers of PVT1 exons 4A and 9 between patients with high-grade PCa (cancer) and control patient (low-grade or no disease) were examined. Seventy-two percent of the men (78) either had no disease or low-grade PCa (control) leaving 30 men with high-grade disease. As shown in Figure 1A, the median PSA concentration is significantly higher in patients with high-grade PCa cancer (p-value <0·01, cancer = 6.41 ng/mL, control = 5.09 ng/mL). Whereas median copy numbers of both PVT1 exon 4A (cancer = 0.29 copies/μL, control = 0.12 copies/μL) and PVT1 exon 9 (cancer = 0.24 copies/μL, control = 0.23 copies/μL) are higher in cancer than control, the differences were not statistically significant (Figure 1B and C).

Next, we used a likelihood ratio test (LRT) to examine whether addition of PVT1 exon 4A or 9 to PSA would yield a more informative model for predicting the risk of high-grade PCa. LRT relies on fitting successive logistic regression (LR) models with increasing complexity. The accuracy of LR models can be influenced by class imbalance, which is present in our data set. Hence, we removed the imbalance in our classes by oversampling the cancer class using bootstrapping techniques to obtain 78 samples in each class. The distribution of biomarker concentrations after class balancing is shown in Supplementary Figure S1 and results from the LRT in Table 2. Whereas the addition of PVT1 exon 9 to PSA improved on the information from PSA alone (p-value <0.01), PVT1 exon 4A did not yield the same improvement (p-value = 0.12).
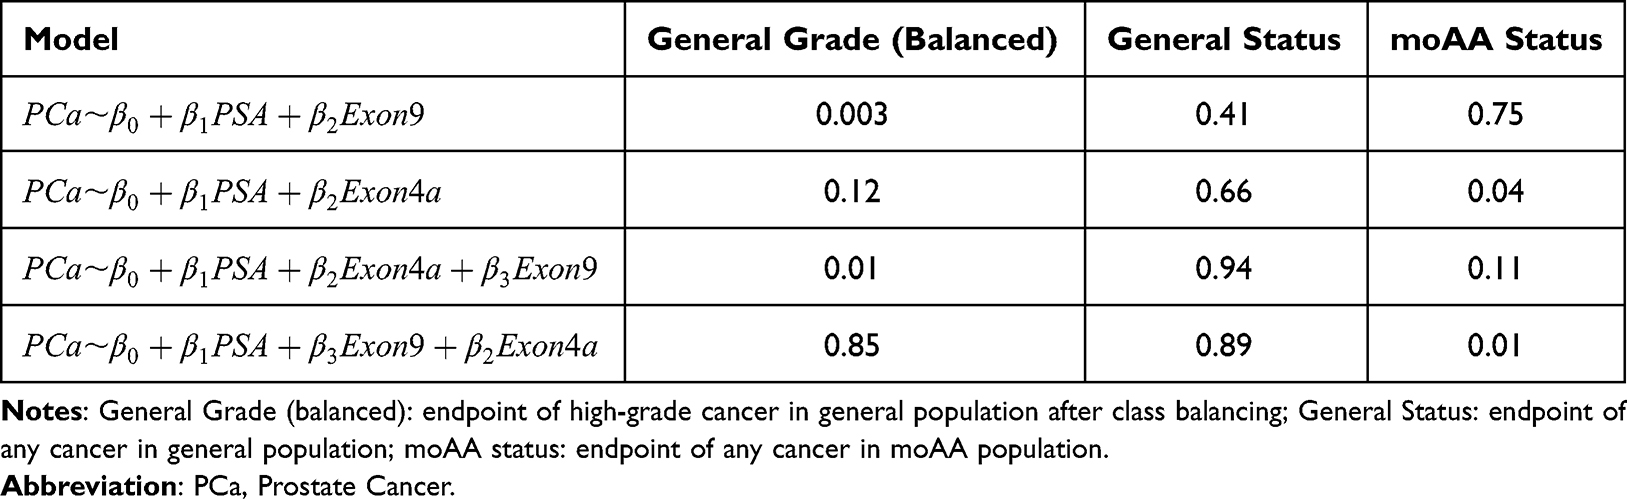 |
Table 2 P-values from Likelihood Ratio Test to Assess the Value of Adding PVT1 Biomarkers to PSA in Different Populations |
We assessed the generalizability in the performance of predictive models involving PSA and our PVT1 biomarkers by running a 4-fold cross-validation with 10 repetitions. The mean area under the curve (AUC) and corresponding receiver operating characteristic (ROC) curves for all models trained on balanced data are shown in Figure 1D. Observe that combining PSA with PVT1 exon 9 achieves the highest mean AUC of 0.75 compared to a model with PSA alone (mean AUC of 0.72), or a model that combines PVT1 exon 4A and PSA (mean AUC of 0.73). Ninety-five percent confidence intervals for the AUC scores are shown in the last column of Table 3. Note from Figure 1E that performing the same analysis on the unbalanced data set results in the same trends but with lower performance metrics across models.
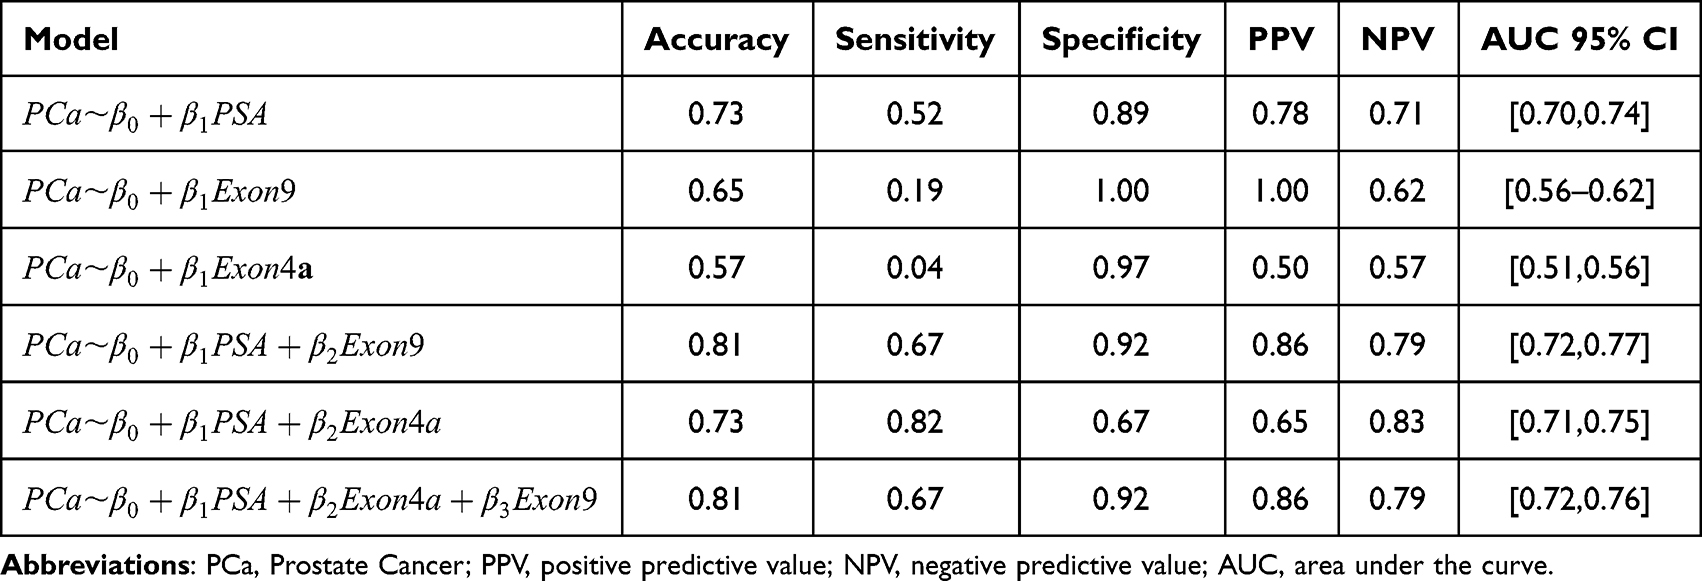 |
Table 3 Performance Metrics for Models Predicting PCa Grade in the General Population with Balanced Classes |
For a more direct evaluation of the predictive performance of PVT1 exon 4A and 9 as biomarkers at a fixed threshold probability, we constructed multiple logistic regression models which were developed to predict high-grade PCa based on three scenarios: PSA alone, PVT1 exon 4A or PVT1 exon 9 alone, and their respective combinations. We trained our models with 60.0% of the data and used the Youden’s index as a threshold for classification. As shown in Table 3, a model combining PVT1 exon 9 and PSA increases the overall accuracy (0.73 to 0.81) as well as both the sensitivity (0.52 to 0.67) and specificity (0.89 to 0.92) of a model with only PSA. Other metrics such as the positive predictive value (PPV) and negative predictive value (NPV) are also improved. Whereas PVT1 exon 4A increases sensitivity and NPV, it maintains the overall accuracy and decreases the specificity and PPV of a model with only PSA. This data suggests that the addition of PVT1 exon 9 to PSA is more likely to improve the risk stratification of PCa (ie detection of high-grade disease) in the general population.
Addition of PVT1 Exons 4A and 9 to PSA Has the Potential to Improve PCa Detection for the General Population
We examined the ability of PVT1 exon 4A and PVT1 exon 9 to predict the PCa risk alone or in combination with PSA in the general population. The clinical difference in serum concentration of PSA and copy numbers of PVT1 exons 4A and 9 between men without PCa (control) and men with PCa is shown in Figure 2A–C. Observe that PSA (cancer = 5.52 ng/mL, control = 5.12 ng/mL) and PVT1 exon 4A (cancer = 0.23 copies/μL, control = 0.11 copies/μL) have higher median concentrations for cancer than control whereas PVT1 exon 9 (cancer = 0.23 copies/μL, control = 0.23 copies/μL) shows no noticeable difference between the two groups. However, the observed differences were not found to be statistically significant.
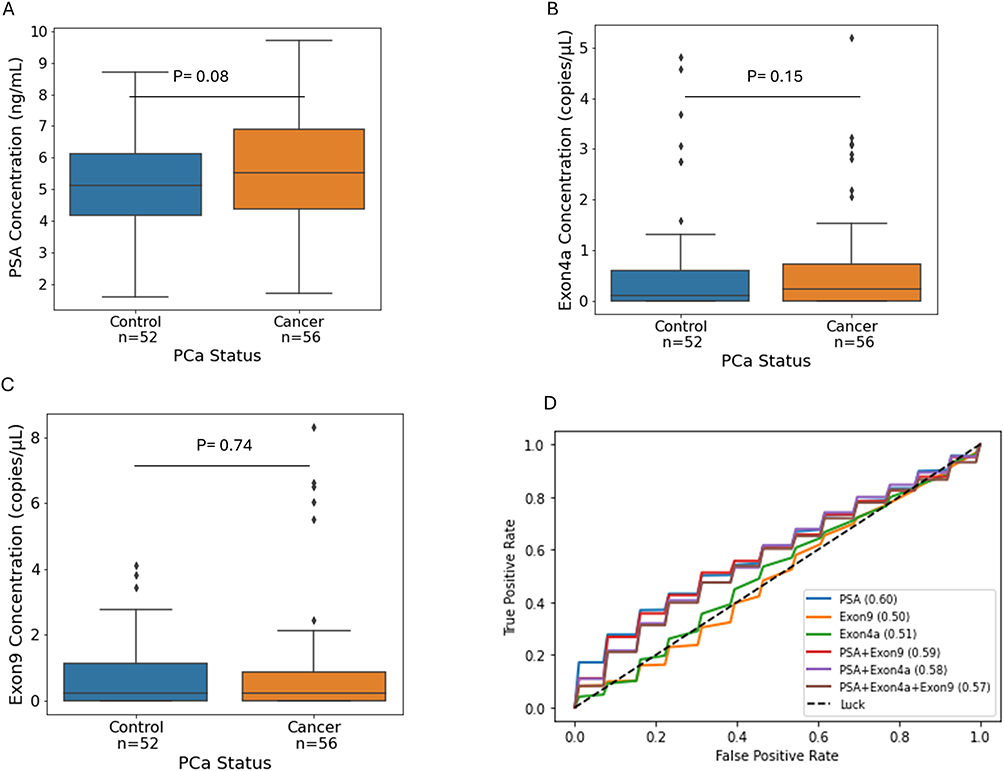

We investigated whether addition of PVT1 exon 4A or PVT1 exon 9 to PSA improves the predictiveness of PSA in determining PCa risk. The results from our likelihood ratio test show that neither addition of PVT1 exon 9 nor PVT1 exon 4A significantly improves on a model with just PSA (p-value > 0.05; Table 2). This is supported by the mean AUC values and ROC curves in Figure 2D which show that a model with only PSA has the highest average AUC of 0.60 followed closely by a model which combines PSA and PVT1 exon 9 (AUC of 0.59). Assessing the predictive accuracy of the models at a fixed threshold probability, a single logistic regression model with PSA alone had a sensitivity of 77.0%, specificity of 41.0%, PPV of 57.0% and NPV of 64.0% (Table 4). Combining PSA with PVT1 exon 4A improves specificity to 59·0%, PPV to 64·0% and NPV to 68.0%. However, it marginally reduced sensitivity to 73.0%. Similarly, addition of PVT1 exon 9 to PSA improved specificity, PPV and NPV without significantly reducing sensitivity. These results suggest that PVT1 exons 4A and 9 have the potential to improve the accuracy of PCa detection by improving specificity when combined with PSA, with PVT1 exon 4A showing the most promise.
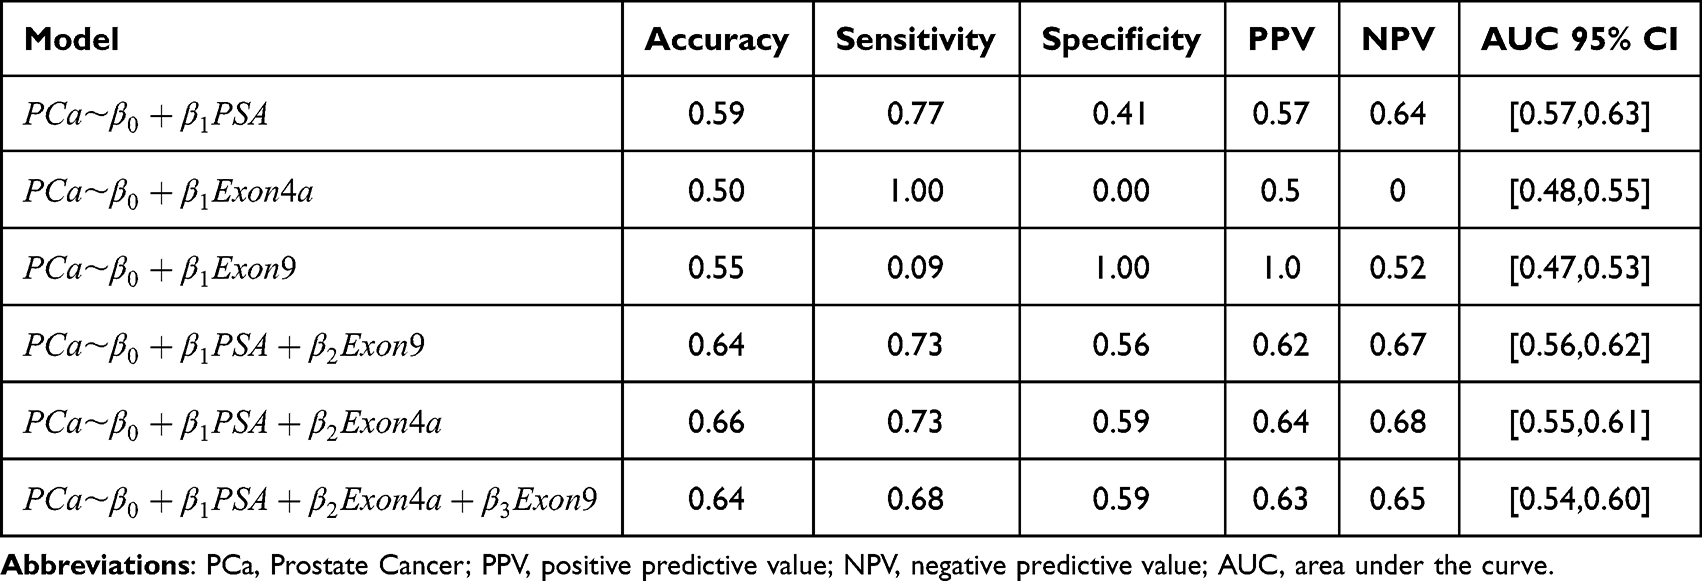 |
Table 4 Predictive Accuracy of Logistic Regression Models for PCa Status in the General Population |
PVT1 Exon 4A Has the Potential to Significantly Improve Prediction of PCa in moAA
The clinical difference in serum concentration of PSA and copy numbers of PVT1 exons 4A and 9 between men without PCa (control) and men with PCa were examined in moAA. Out of a total of 15 men, 52% had prostate cancer. None of the biomarkers (including PSA) showed a statistically significant difference between the two classes (Figure 3A) but the analysis did provide interesting trends. Whereas the median copy number of PVT1 exon 9 (cancer=0.23 copies/μL, control = 0.00 copies/μL) and PVT1 exon 4A (cancer=0.06 copies/μL, control = 0.00 copies/μL) were noticeably higher for moAA with prostate cancer (Figure 3B and C), the median value of PSA (cancer = 4.58 ng/mL, control = 4.73 ng/mL) was indistinguishable between these two groups (Figure 3A).
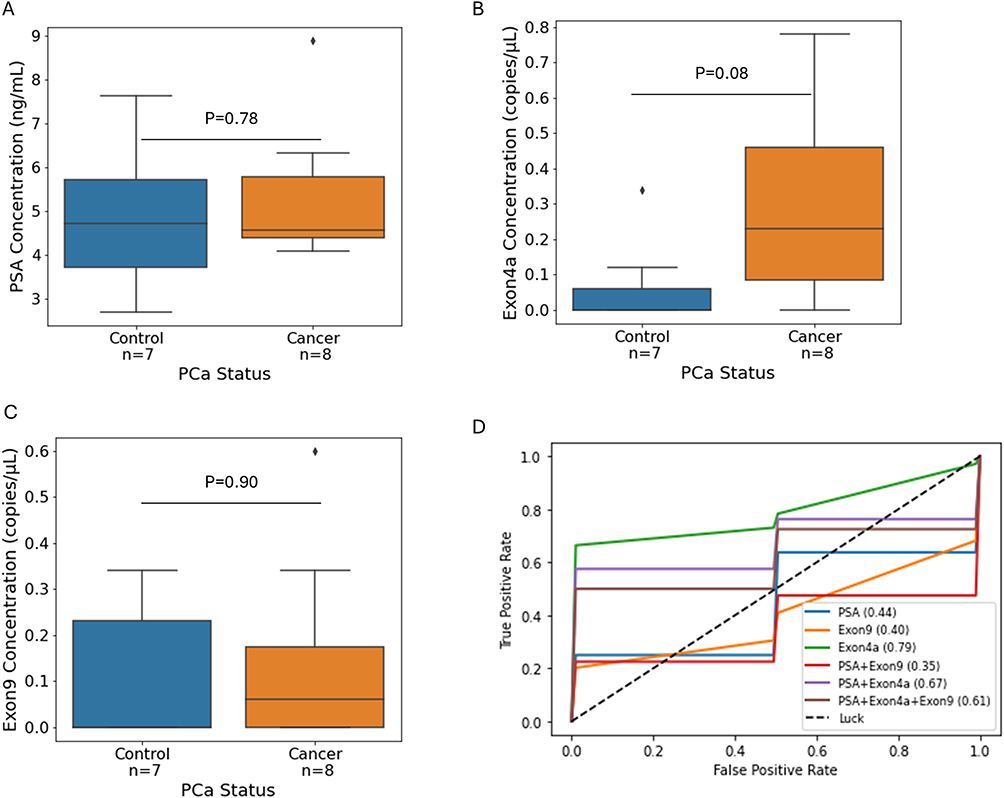

A likelihood ratio test was performed to determine whether addition of PVT1 exons 4A or 9 to a model with PSA yielded a more informative model. Our results, shown in Table 2, suggest that the addition of PVT1 exon 4A significantly improves the predictive ability of a model that includes PSA (p-value 0.04). However, the addition of PVT1 exon 9 to PSA did not yield a more informative model (Table 2). We proceeded to test the generalizability in accuracy of a regression model containing both PVT1 exon 4A and 9 using 4-fold cross validation with 10 repetitions. The average AUC and ROC curves for all possible models are shown Figure 3D. Corresponding 95% confidence intervals for AUC are given in the last column of Table 5. Observe that a model containing only PVT1 exon 4A had the highest mean AUC (0.79). This model performed significantly better than a model with PSA alone, which statistically was no better than a coin toss (AUC of 0.44), or a model that combines PSA and PVT1 exon 4A (AUC of 0.67).
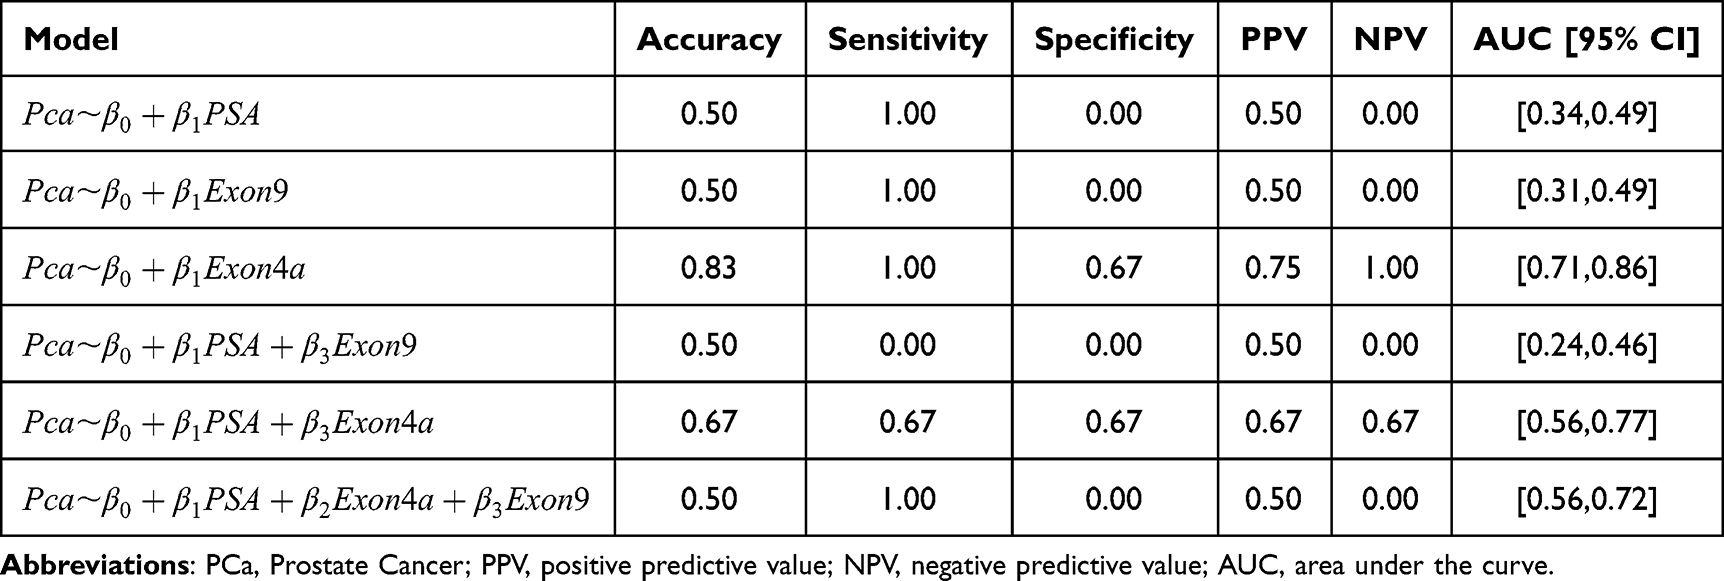 |
Table 5 Performance Metrics for Logistic Regression Models Predicting PCa Status in the moAA Population |
At a fixed threshold probability, taken to maximize the Youden’s index, we observe from Table 5 that a logistic regression model with PVT1 exon 4A has the best performance metrics (sensitivity of 100%, specificity of 67.0%, PPV of 75.0% and NPV of 100%). Performance reduced when PVT1 exon 4A was combined with PSA. These results provide preliminary evidence to support PVT1 exon 4A as a promising serum biomarker that may significantly improve the prediction of PCa risk in moAA.
Discussion
To our knowledge, this study is the first to assess the general clinical potential of individual PVT1 exons’ ability to predict PCa, with an emphasis on identifying high-grade disease, as well as the predictability among moAA who are disproportionately impacted by PCa. We detected these biomarkers in serum samples from 144 men using a digital PCR with multiplex technology and used their absolute concentrations (in copy numbers) to evaluate their predictive power. We first tested the hypothesis that PVT1 exon 4A and exon 9 are differentially expressed between target and control groups for the general population and moAA. Whereas the concentration of these biomarkers was observationally higher for individuals with any cancer or high-grade cancer, from both the general population and moAA, we did not find any of the differences to be statistically significant (Figures 1–3). In the case of any cancer for moAA, the lack of statistical significance may be due to the small sample sizes within groups (about 8 per group) since the median concentration for PVT1 exon 4a was substantially higher for the cancer class (0.23 copies/μL) compared with the control class (0.00 copies/μL).
We also tested the hypothesis that the addition of PVT1 exons 4A and 9 to PSA improves the informativeness and predictive accuracy of PSA alone in determining the risk of any PCa in the general population and moAA. Here, limited by sample size, our results provide preliminary evidence in support of our hypothesis in moAA but not in the general population (Table 2). This was supported by a mean AUC of 0.67 from a model combining PVT1 exon 4A and PSA in moAA compared with a mean AUC of 0.44 for PSA alone. This is in agreement with our previous work on a smaller patient cohort that showed improved predictive performance when PVT1 exons 4A and exon 9 were added to PSA.28 Interestingly, a model with only PVT1 exon 4A had the best predictive accuracy (mean AUC of 0.79, Figure 3D) of all the models examined, substantially improving all other performance metrics (accuracy, sensitivity, specificity, PPV, NPV). Our analysis, based on a small sample size of 15 observations, provides exploratory evidence to suggest that PVT1 exon 4A may perform better when used exclusively for moAA. The results for PVT1 exon 9 were not as remarkable, with predictive models involving this biomarker often underperforming the accuracy of a model with PSA alone. None of our PVT1 biomarkers significantly improved the informativeness of PSA in predicting any PCa in the general population, as evidenced by lower mean AUCs. However, they both increased the specificity of PSA from 0.41 to 0.59, without significantly compromising on sensitivity, suggesting a potential to reduce the false positivity of PSA by combining it with PVT1 exon 4A and 9.
Finally, we examined whether the addition of PVT1 exons 4A and 9 improves the informativeness and predictive accuracy of PSA alone in determining the risk of high-grade PCa in the general population and moAA. Our analysis revealed that addition of PVT1 exon 9 to PSA improves on the informativeness of PSA alone in determining high-grade PCa in the general population (Table 2). This was supported by an increase in the mean AUC of a model with just PSA from 0.72 to 0.75, when PVT1 exon 9 was added as well as an increase in other performance metrics (sensitivity and specificity, PPV and NPV). Whereas PVT1 exon 4A did not significantly improve the informativeness of PSA in the general population, it improved the mean AUC of PSA and some performance metrics. Since our data set contained only two moAA with high-grade PCa, we could not test our hypothesis involving this subgroup. Altogether, our work suggests that combining PVT1 exon 9 and PSA could be particularly valuable for risk stratification of PCa in men.
Interestingly, we found that PSA was a more informative biomarker within the general population, not accounting for racial background, as evidenced by a difference in PSA concentration between men with PCa and men without PCa and better performance of a predictive model with just PSA. When we focused specifically on racial groups, the median expression of PSA was indistinguishable between men without PCa and those with PCa. Consequently, the accuracy of the resulting predictive model with just PSA was no better than flipping a coin. This agrees with previously published findings that indicate that PSA is not a reliable biomarker in moAA to predict PCa,29 which leads to overdiagnosis and overtreatment,30 and that PSA levels are generally higher in this group for reasons largely unknown.31 To enhance the detection of PCa within this group, our work provides exploratory evidence to suggest that PVT1 exon 4A in serum could act as an effective alternative for PCa monitoring and screening.
The primary limitation of this study is the small sample size of moAA (14.8% of patients) which is reflective of cancer research as a whole where underrepresentation of this patient population is common in research and available samples.32 Future work will focus on increasing the absolute number of moAA to facilitate a stronger subpopulation analysis. We also note that our statistical analysis is based on retrospective data and was carried out after removing 36 patients whose biomarker concentrations were considered as outliers. Finally, diagnostic variables beyond disease status (eg, prostate volume, biopsy number, mpMRI data, etc) will be needed in future prospective studies to broaden the utility of PVT1 exons 9 and 4A as clinical biomarkers.
As this study is the first of its kind to clinically evaluate PVT1 exons 4A and 9 in serum, it provides foundational evidence to support the strong potential of these biomarkers to improve PCa screening. In addition to larger sample size, future studies will evaluate advanced classification techniques such as support vector machines and copula classifiers to further improve predictive accuracy.
Acknowledgments
We acknowledge Ogunwobi laboratory members and undergraduate students who assisted in extracting RNA from serum samples for this study. Emmanuel Asante-Asamani and Rachel E. Bonacci are joint first authors.
Funding
This study was supported by funds to the Ogunwobi laboratory provided by Michigan State University. Michigan State University played no role in study design, data collection, data analysis, data interpretation, manuscript writing, and decision to submit manuscript.
Disclosure
Dr. Ogunwobi is the Co-Founder of NucleoBio Inc. Dr. Emmanuel Asante-Asamani reports support for the manuscript from Michigan State University, during the conduct of the study, outside the submitted work. Dr. Olorunseun Ogunwobi reports support for the manuscript from Michigan State University, during the conduct of the study; Grants or contracts from Health Equity Funding Initiative, Michigan State University; Leadership or fiduciary roles from Member, Executive Board, The Consortium Of Disparities Of Urologic Conditions, outside the submitted work. The remaining authors declare no competing financial interests in relation to the work described. This paper has been previously uploaded to Preprints with THE LANCET as a preprint: http://dx.doi.org/10.2139/ssrn.5242641.
References
1. Miller DC, Gruber SB, Hollenbeck BK, Montie JE, Wei JT. Incidence of initial local therapy among men with lower-risk prostate cancer in the United States. J Natl Cancer Inst. 2006;98(16):1134–11. doi:10.1093/jnci/djj308
2. Etzioni R, Tsodikov A, Mariotto A, et al. Quantifying the role of PSA screening in the US prostate cancer mortality decline. Cancer Cause Control. 2008;19(2):175–181. doi:10.1007/s10552-007-9083-8
3. M HBC. Prostate-Specific Antigen (PSA) screening for prostate cancer. JAMA. 2018;319(18):1866–1868. doi:10.1001/jama.2018.4914
4. Heijnsdijk EAM, Wever EM, Auvinen A, et al. Quality-of-life effects of prostate-specific antigen screening. N Engl J Med. 2016;367(7):595–605. doi:10.1056/NEJMoa1201637
5. Saini S. PSA and beyond; alternative prostate cancer biomarkers. Cell Oncol. 2016;39(2):97–106. doi:10.1007/s13402-016-0268-6
6. Romero Otero J, Garcia Gomez B, Campos Juanatey F, Touijer KA. Prostate cancer biomarkers: an update. Urol Oncol. 2014;32(3):252–260. doi:10.1016/j.urolonc.2013.09.017
7. Ankrest DP, Thompson IM. Sensitivity and specificity of prostate-specific antigen for prostate cancer detection with high rates of biopsy verification. Arch Ital Urol Androl. 2006;78:125–129.
8. Loeb S, Bjurlin M, Nicholson J, et al. Overdiagnosis and overtreatment of prostate cancer. Eur Urol. 2014;65(6):1046–1055. doi:10.1016/j.eururo.2013.12.062
9. Parekh DJ, Punnen S, Sjoberg DD, et al. A multi-institutional prospective trial in the USA confirms that the 4Kscore accurately identifies men with high-grade prostate cancer. Europ urol. 2015;68(3):464–470. doi:10.1016/j.eururo.2014.10.021
10. Catalona WJ, Sanda MG, Wei JT, et al. Evaluation of the prostate health index (Phi)(1) in the 2 to 4, and 4 to 10 Ng/Ml Psa ranges: results from a multi-site, prospective, clinical evaluation. J Urol. 2011;185(4):E396–E396. doi:10.1016/j.juro.2011.02.1014
11. Schoots IG, Roobol MJ. Multivariate risk prediction tools including MRI for individualized biopsy decision in prostate cancer diagnosis: current status and future directions. World J Urol. 2020;38(3):517–529. doi:10.1007/s00345-019-02707-9
12. Louie KS, Seigneurin A, Cathcart P, Sasieni P. Do prostate cancer risk models improve the predictive accuracy of PSA screening? A meta-analysis. Ann Oncol. 2015;26(5):848–864. doi:10.1093/annonc/mdu525
13. Moul JW, Sesterhenn IA, Connelly RR, et al. Prostate-specific antigen values at the time of prostate-cancer diagnosis in African-American Men. JAMA. 1995;274(16):1277–1281. doi:10.1001/jama.274.16.1277
14. Lowder D, Rizwan K, McColl C, et al. Racial disparities in prostate cancer: a complex interplay between socioeconomic inequities and genomics. Cancer Lett. 2022;531:71–82. doi:10.1016/j.canlet.2022.01.028
15. Freedman ML, Haiman CA, Patterson N, et al. Admixture mapping identifies 8q24 as a prostate cancer risk locus in African-American men. Proc Natl Acad Sci U S A. 2006;103(38):14068–14073. doi:10.1073/pnas.0605832103
16. Colombo T, Farina L, Macino G, Paci P. PVT1: a rising star among oncogenic long noncoding RNAs. Biomed Res Int. 2015;2015:304208. doi:10.1155/2015/304208
17. Wan B, Wu HY, Lv DJ, et al. Downregulation of lncRNA PVT1 expression inhibits proliferation and migration by regulating p38 expression in prostate cancer. Oncol Lett. 2018;16(4):5160–5166. doi:10.3892/ol.2018.9305
18. Liu HT, Fang L, Cheng YX, Sun Q. LncRNA PVT1 regulates prostate cancer cell growth by inducing the methylation of miR-146a. Cancer Med. 2016;5(12):3512–3519. doi:10.1002/cam4.900
19. Chang Z, Cui J, Song Y. Long noncoding RNA PVT1 promotes EMT via mediating microRNA-186 targeting of Twist1 in prostate cancer. Gene. 2018;654:36–42. doi:10.1016/j.gene.2018.02.036
20. IIboudo A, Chouhan J, McNeil BK, Osborne JR, Ogunwobi OO. PVT1 Exon 9: a potential biomarker of aggressive prostate cancer? Int J Environ Res Public Health. 2015;13(12):2–13. doi:10.3390/ijerph13010012
21. Pal G, Huaman J, Levine F, et al. Long noncoding RNA from PVT1 exon 9 is overexpressed in prostate cancer and induces malignant transformation and castration resistance in prostate epithelial cells. Genes. 2019;10:964. doi:10.3390/genes10120964
22. Pal G, Di L, Orunmuyi A, Olapade-Olaopa EO, Qiu W, Ogunwobi OO. Population Differentiation at the PVT1 Gene Locus: implications for Prostate Cancer. G3. 2020;10(7):2257–2264. doi:10.1534/g3.120.401291
23. Pal G, Ogunwobi OO. Copy number-based quantification assay for non-invasive detection of PVT1-derived transcripts. PLoS One. 2019;14(12):e0226620. doi:10.1371/journal.pone.0226620
24. Asante-Asamani EO, Pal G, Liu L, Ogunwobi OO. Prostac: a new composite score with potential predictive value in prostate cancer. Front Oncol. 2021;11:644665. doi:10.3389/fonc.2021.644665
25. Samaratunga H, Egevad L, Yaxley J, et al. Gleason score 3+3=6 prostatic adenocarcinoma is not benign and the current debate is unhelpful to clinicians and patients. Pathology. 2024;56(1):33–38. doi:10.1016/j.pathol.2023.10.005
26. Gleason DF. Classification of prostatic carcinomas. Cancer Chemother Rep. 1966;50(3):125–128.
27. Mattiuzzi C, Lippi G. Current cancer epidemiology. J Epidemiol Glob Health. 2019;9(4):217–222. doi:10.2991/jegh.k.191008.001
28. Asante-Asamani EO, De Silva DS, Pal G, Liss M, Leach R, Ogunwobi O. Prediction of positive prostate biopsy is significantly improved in Black and Hispanic men when serum PVT1 exon 9 copy number is combined with serum prostate specific antigen. Cancer Res. 2023;83:A64.
29. Sweis J, Ofori B, Murphy AB. Concerns regarding prostate cancer screening guidelines in minority populations. Prostate Cancer Prostatic Dis. 2024;27(4):591–593. doi:10.1038/s41391-023-00765-0
30. Barlow M, Down L, Mounce LTA, et al. Ethnic differences in prostate-specific antigen levels in men without prostate cancer: a systematic review. Prostate Cancer Prostatic Dis. 2023;26(2):249–256. doi:10.1038/s41391-022-00613-7
31. Mavropoulos JC, Partin AW, Amling CL, et al. Do racial differences in prostate size explain higher serum prostate-specific antigen concentrations among black men? Urology. 2007;69(6):1138–1142. doi:10.1016/j.urology.2007.01.102
32. Spratt DE, Chan T, Waldron L, et al. Racial/ethnic disparities in genomic sequencing. JAMA Oncol. 2016;2(8):1070–1074. PMID: 27366979; PMCID: PMC5123755. doi:10.1001/jamaoncol.2016.1854
 © 2026 The Author(s). This work is published and licensed by Dove Medical Press Limited. The
full terms of this license are available at https://www.dovepress.com/terms
and incorporate the Creative Commons Attribution
- Non Commercial (unported, 4.0) License.
By accessing the work you hereby accept the Terms. Non-commercial uses of the work are permitted
without any further permission from Dove Medical Press Limited, provided the work is properly
attributed. For permission for commercial use of this work, please see paragraphs 4.2 and 5 of our Terms.
© 2026 The Author(s). This work is published and licensed by Dove Medical Press Limited. The
full terms of this license are available at https://www.dovepress.com/terms
and incorporate the Creative Commons Attribution
- Non Commercial (unported, 4.0) License.
By accessing the work you hereby accept the Terms. Non-commercial uses of the work are permitted
without any further permission from Dove Medical Press Limited, provided the work is properly
attributed. For permission for commercial use of this work, please see paragraphs 4.2 and 5 of our Terms.
Recommended articles
Correlation Between Long-Term Acetylsalicylic Acid Use and Prostate Cancer Screening with PSA. Should We Reduce the PSA Cut-off for Patients in Chronic Therapy? A Multicenter Study
Mantica G, Chierigo F, Cassim F, Ambrosini F, Tappero S, Malinaric R, Parodi S, Benelli A, Dotta F, Ennas M, Beverini M, Vaccaro C, Smelzo S, Guano G, Mariano F, Paola C, Granelli G, Varca V, Introini C, Dioguardi S, Simonato A, Gregori A, Gaboardi F, Terrone C, Van der Merwe A
Research and Reports in Urology 2022, 14:369-377
Published Date: 21 October 2022