Back to Journals » International Journal of General Medicine » Volume 16
Combination of Chest Computed Tomography Value and Clinical Laboratory Data for the Prognostic Risk Evaluation of Patients with COVID-19
Authors Liu Y, Qi Z, Bai M, Kang J, Xu J, Yi H
Received 12 June 2023
Accepted for publication 12 August 2023
Published 28 August 2023 Volume 2023:16 Pages 3829—3842
DOI https://doi.org/10.2147/IJGM.S425567
Checked for plagiarism Yes
Review by Single anonymous peer review
Peer reviewer comments 2
Editor who approved publication: Prof. Dr. Héctor Mora-Montes
Yali Liu,1,* Zhihong Qi,2,* Meirong Bai,1,* Jianle Kang,1 Jinxin Xu,1 Huochun Yi3
1Department of Thoracic Surgery, Zhongshan Hospital Xiamen University, Xiamen, Fujian, 361012, People’s Republic of China; 2Department of Urologic Surgery, Zhongshan Hospital Xiamen University, Xiamen, Fujian, 361012, People’s Republic of China; 3Clinical Laboratory, Zhongshan Hospital Xiamen University, Xiamen, Fujian, 361012, People’s Republic of China
*These authors contributed equally to this work
Correspondence: Jinxin Xu, Department of Thoracic Surgery, Zhongshan Hospital of Xiamen University, School of Medicine, Xiamen University, No. 201 Hubin South Road, Siming District, Xiamen, People’s Republic of China, Email [email protected] Huochun Yi, Centre of Clinical Laboratory, Zhongshan Hospital of Xiamen University, School of Medicine, Xiamen University, No. 201 Hubin South Road, Siming District, Xiamen, People’s Republic of China, Email [email protected]
Objective: This study aims to investigate the independent prognostic factors of patients with coronavirus disease 2019 (COVID-19) and thereafter construct a related prognostic model.
Methods: The subjects were screened following the COVID-19 diagnostic criteria. The independent prognostic factors were selected based on the indicators, including medical history, clinical manifestation, laboratory tests, imaging examination and clinical prognosis. Subsequently, we constructed a nomogram model to predict short-term prognosis.
Results: Clinical information was obtained from 393 COVID-19 patients admitted to Zhongshan Hospital at Xiamen University between December 2022 and January 2023. The independent risk factors determined by Cox multivariate regression analysis included gender (OR: 0.355, 95% CI: 0.16~0.745), age (OR: 3.938, 95% CI: 1.221~15.9), pectoral muscle index (PMI, OR: 4.985, 95% CI: 2.336~11.443), pneumonia severity score (PSS, OR: 6.486, 95% CI: 2.082~21.416) and lactate dehydrogenase (LDH, OR: 3.857, 95% CI: 1.571~10.266). A short-term prognostic nomogram was developed based on the five independent risk factors above. The area under the receiver operating characteristic (ROC) curve (AUC) of the nomogram model was 0.857. The calibration curve confirmed the outcomes of the prognostic model, which exhibited excellent consistency with the actual results.
Conclusion: In summary, gender, age, pectoral muscle index, pneumonia severity score, and lactate dehydrogenase are all independent risk factors for COVID-19 mortality. Thus, the nomogram based on the above indicators can predict the risk of mortality in COVID-19 patients. This may have the potential of being clinical application in prognostic evaluation of COVID-19.
Keywords: COVID-19, risk factors, nomogram, prognoses, evaluation study
Research Background
Coronavirus disease 2019 (COVID-19) is a novel infectious disease that has rapidly spread in more than 200 countries and regions since its outbreak in December 2019. The spread of the virus poses a significant global hazard to human health.1 Most patients infected with COVID-19 have good clinical outcomes, with only mild clinical signs including fever and dry cough. However, a few patients had multiple organs dysfunction (including lungs and heart) and even death.2,3
Gender, age, hypertension, diabetes mellitus, and obesity are the risk factors for poor prognosis in severe COVID-19 patients.4 Additionally, dystrophy and cachexia are linked to poor prognosis in COVID-19 patients.5–7 Schiaffino et al used axial Computed Tomography(CT) imaging at the T5 and T12 vertebrae levels to assess the cross-sectional area and attenuation of the paravertebral muscle of patients with COVID-19. As a consequence, low muscle mass was independently associated with Intensive care unit(ICU) admission and in-hospital mortality rates.8 Kim et al used the chest CT scan at the 12th thoracic vertebra to determine the baseline cross-sectional area of the pectoral muscle of COVID-19 patients. The lowest quartile of the pectoral muscle index (PMI, the cross-sectional area of the pectoral muscle was divided by the square of the height) was used to identify the patients with sarcopenia. The results revealed that patients with sarcopenia had a more prolonged hospital stay and a higher death rate. Also, sarcopenia was an independent predictor of hospital stay but was not linked to mortality.9 Additionally, scholars have estimated the pectoral muscle index using the cross-sectional area manifested in the CT image at the 12th thoracic vertebra. They discovered that the index was not associated with poor outcomes including mortality, ICU admission rate, or invasive mechanical ventilation.10,11 Summarily, the effect of the pectoralis muscle CT value on the prognostic risk evaluation of COVID-19 individuals varied among studies, warranting additional investigation.
One study revealed that multiple hematological indices, including hemoglobin (Hgb), hematocrit (HCT), white blood Cell (WBC) and platelet (PLT), and biochemical parameters including alanine aminotransferase (ALT), aspartate aminotransferase (AST) and lactate dehydrogenase (LDH) were altered in COVID-19 patients. Lymphocyte(Lym) and PLT counts significantly decreased in severe cases and death. In contrast, WBC counts increased dramatically, and biomarkers for inflammation, heart and muscle injury, hepatorenal function, and coagulation function also significantly increased.12 Laboratory indicators including C-reactive protein (CRP), D-dimer (DD), coagulation test, LDH, and procalcitonin(PCT) were associated with the severity and poor prognosis of COVID-19 patients. The above indices can predict severity, ICU admission rate, and mortality.13
Currently, there are few studies combining CT characteristics with clinical laboratory data. Lin et al found that chest CT features are positively associated with CRP, ESR, and LDH and can indicate disease severity.14 The findings suggest that combining chest CT features and clinical laboratory data provide clinical value in assessing the prognostic risk of COVID-19 individuals. This study compared the demographic characteristics, pectoralis muscle CT value, and clinical laboratory data between the survival and death groups to identify potential risk factors of death and establish the nomogram predicting the risk of death among COVID-19 patients. The above results provide a reference for the clinical diagnosis and treatment of COVID-19 patients.
Data and Methods
Study Subjects
A retrospective study on the clinical information of COVID-19 patients (male, 257 cases; female, 136 cases; ≤60 years old, 77 cases; and >60 years old, 316 cases) admitted to Zhongshan Hospital at Xiamen University was conducted between December 2022 and January 2023. Inclusion criteria: (1) age ≥18 years; (2) the patients confirmed with a positive viral nucleic acid of COVID-19; (3) the patients undergoing chest CT imaging and showing signs of viral pneumonia on CT imaging (patients confirmed with the diagnosis criteria of common, severe and critical COVID-19 were included). Exclusion criteria: (1) age <18 years; (2) the chest CT picture revealed a motional artifact; (3) incomplete clinical data. Complied with the Declaration of Helsinki, the study was approved by Zhongshan Hospital Xiamen University ethics committee (Ethical approval number: (XMZSYYKY 2023–086) and all patients signed the informed consent form.
Methods
Collection of Clinical Data
This study collected patient demographic information, including age, gender, height, body weight, underlying condition (diabetes, cardiovascular disorder, malignant tumor), symptoms, laboratory examination, and imaging. Laboratory examination included creatine kinase (CK), MB isoenzyme of creatine kinase (CK-MB), high-sensitivity cardiac troponin T (hs-TnT), N-terminal pro-brain natriuretic peptide (NT-proBNP), PCT, DD, WBC, Lym, neutrophil count (Neu), monocyte count (Mono), Hgb, PLT, β-hydroxybutyric acid (β-HB), CRP, albumin (ALB), ALT, AST, glutamyltranspeptidase (GGT), alkaline phosphatase (ALP), cholinesterase (CHE), glucose (GLU), LDH, blood urea nitrogen (BUN) and creatinine (Cre). The above information represents the initial examination results obtained within 24 hours after admission.
Clinical Classification
Clinical classification followed the “Diagnosis and Treatment Protocol for COVID-19 (Trial Version 10)” published by the National Health Commission of the People’s Republic of China:15 (a) Mild cases: The clinical symptoms were mild, and imaging showed no pneumonia signs. (B) Common cases: showing fever and respiratory symptoms with radiological findings of pneumonia. (c) severe cases: meeting any of the following criteria: (1) respiratory distress, RR≧30 breaths/ min; (2) finger oxygen saturation≤93% at rest; (3) arterial partial pressure of oxygen PaO2/ FiO2≤300mmHg; (4) Those with progressive deterioration of clinical symptoms and chest imaging showing apparent lesion progression within 24–48 hours >50% of the time will be categorized as severe; (d) critical cases: respiratory failure requiring mechanical ventilation; shock; and other organ failure needing ICU care.
Measurement and Evaluation of Pectoral Muscle Mass
Chest CT results within 24 hours after admission were considered baseline results. The uniaxial chest CT image analysis at the 4th thoracic vertebra above the aorta arch was performed by two well-disciplined radiologists and independently through slicematic software. The pectoral muscle area (PMA) was calculated using the Hounsfield (HU) value as a unit (range: −29 to +150), and the square of the height corrected the PMA to calculate PMI. The image is shown in Figure 1.
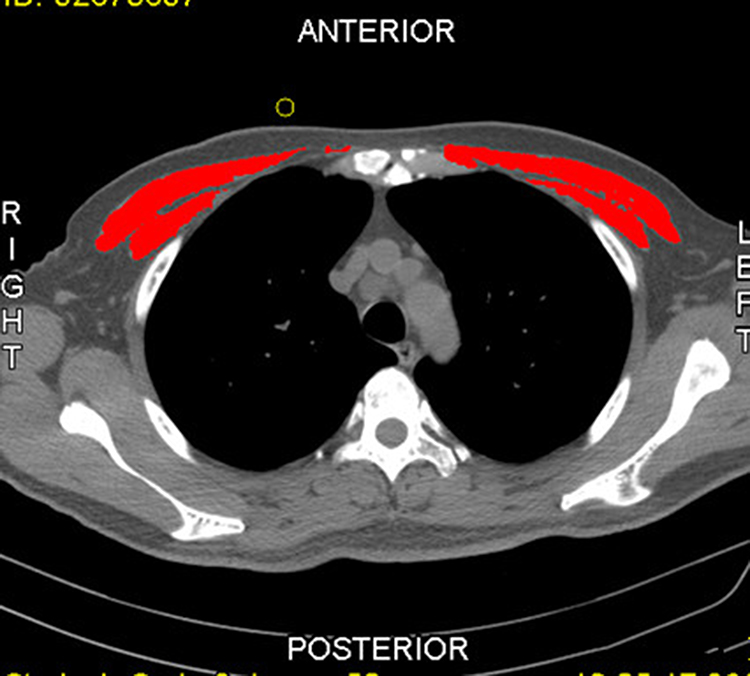 |
Figure 1 The cross-section of the chest CT image at the 4th thoracic vertebra and the red marking area was the PMA. |
Pneumonia Severity Score (PSS)
Two thoracic surgeons with at least five-year work experience evaluated the pneumonia severity respectively and independently. Evaluation standard: no pneumonia: 0 points; mild pneumonia (20–40%): 1 point; moderate pneumonia (40–60%): 2 points; severe pneumonia (>60%): 3 points.16
Statistical Analysis
SPSS 24.0 software was used in all data analyses. The exact probability of the Chi-square or Fisher tests was used to compare the groups. Data in Table 1-3 were analyzed using univariate Cox regression analysis. The variables with statistical significance were then analyzed using multivariate Cox regression analysis. The independent risk factors were used to establish the prognostic nomogram. P < 0.05 was considered to be statistically significant.
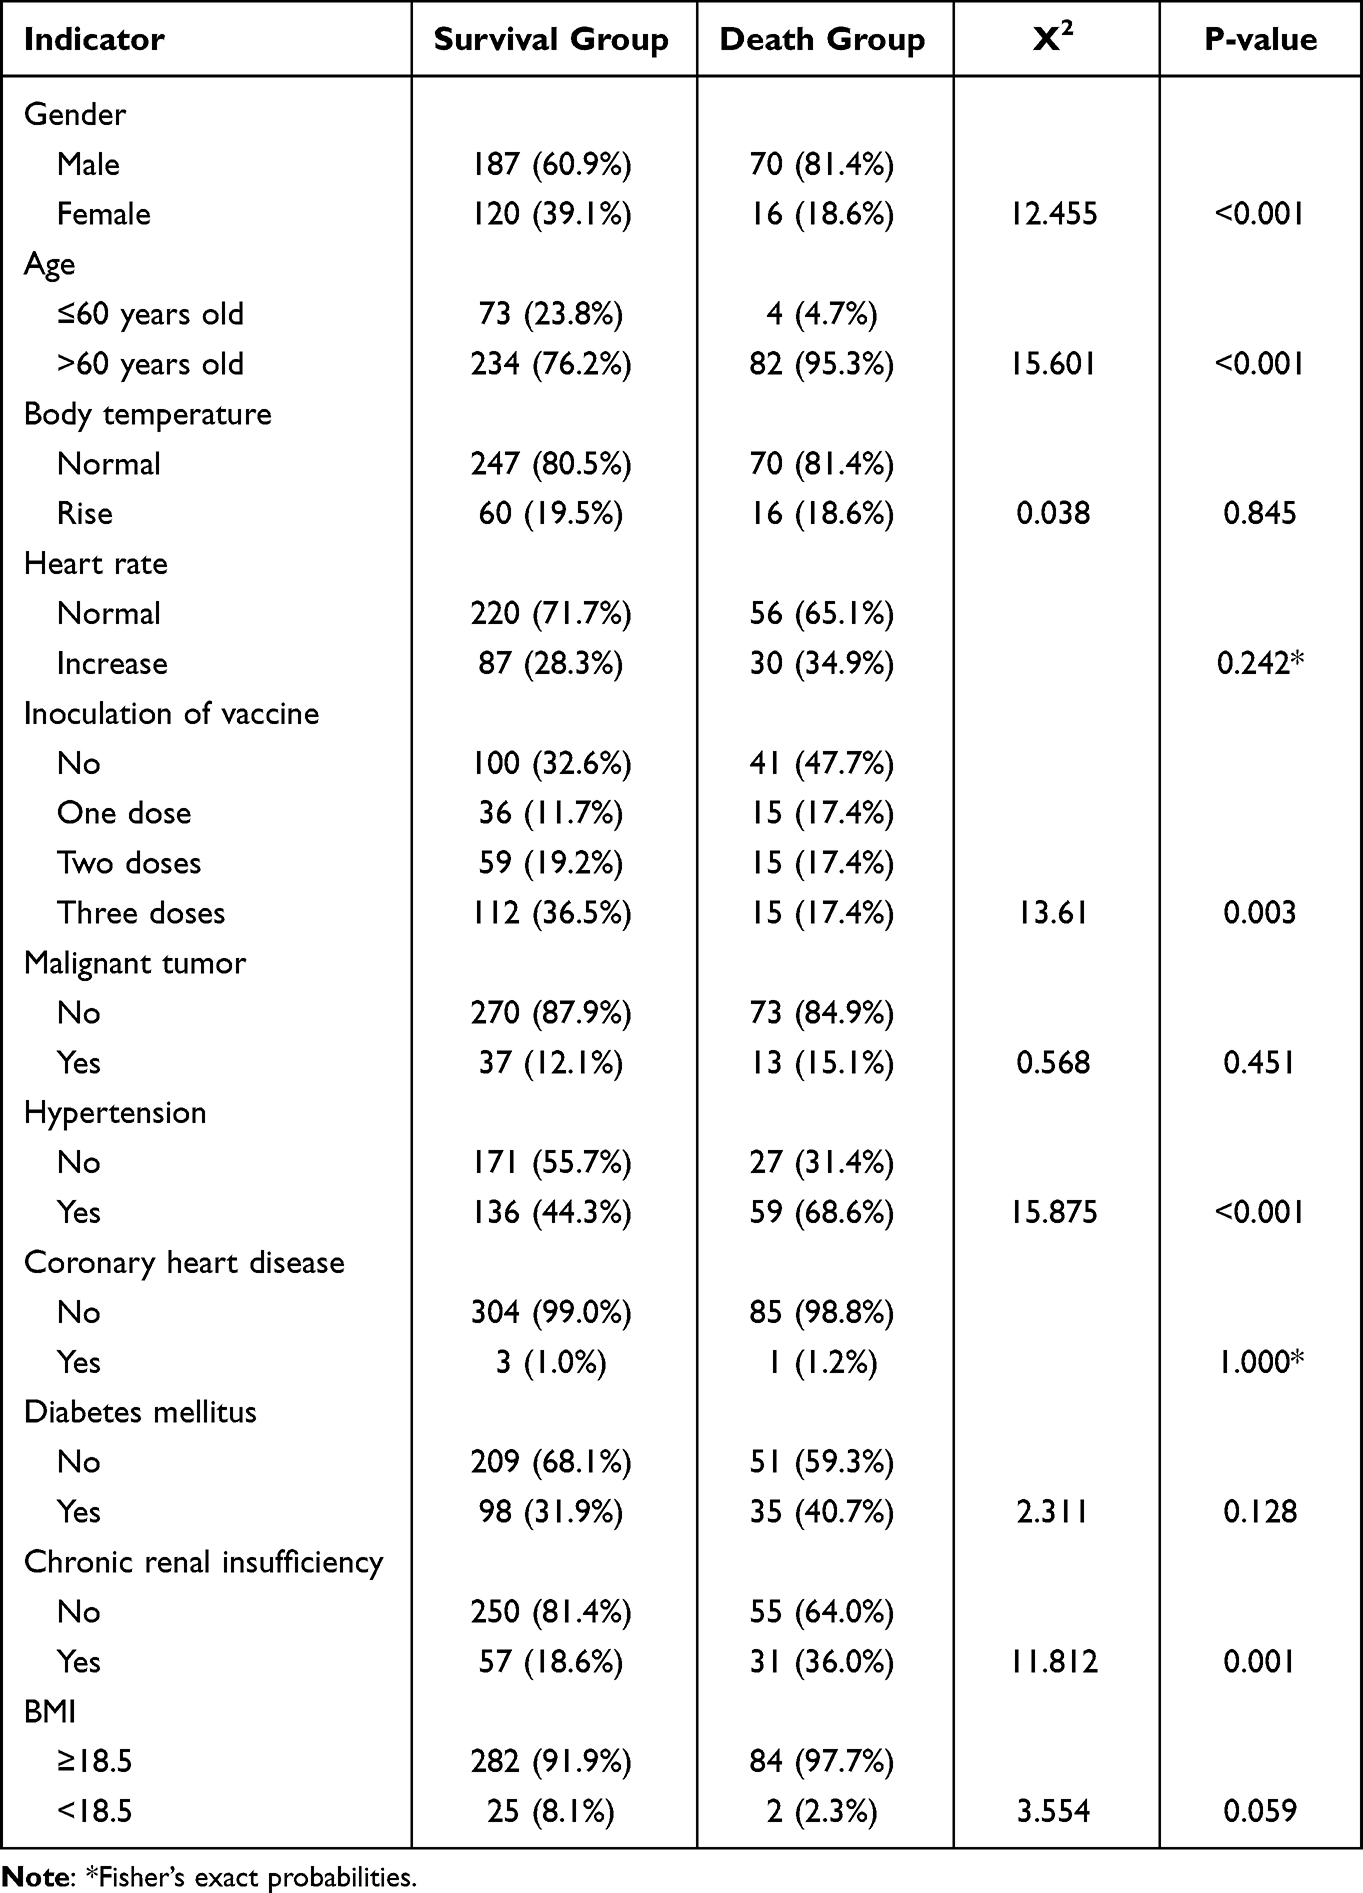 |
Table 1 Comparison of General Data Between COVID-19 Patients in the Survival and Death Groups |
 |
Table 2 Comparison of Pectoralis Muscle CT Value Between COVID-19 Patients in the Survival and Death Groups |
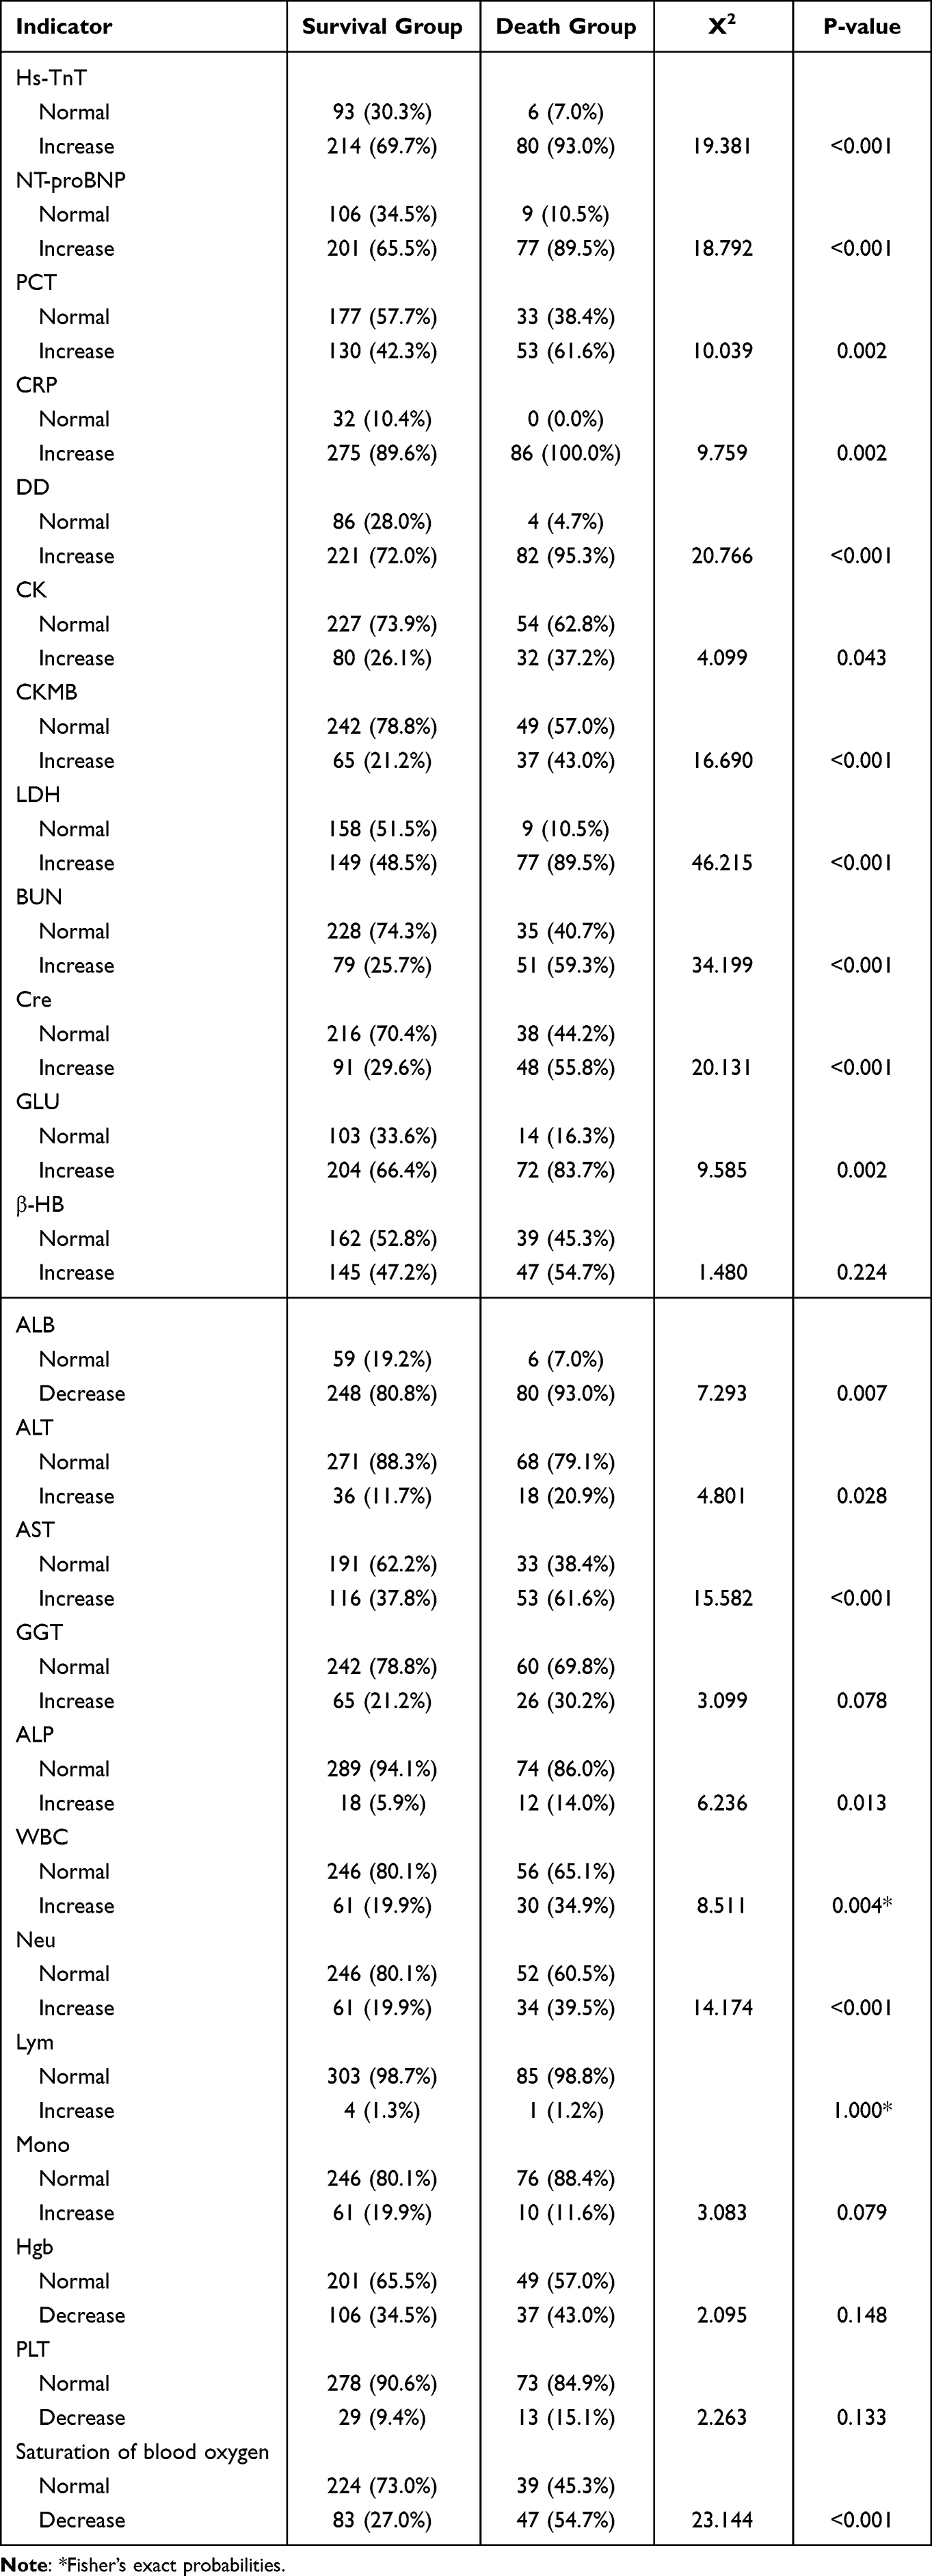 |
Table 3 Comparison of Laboratory Parameters Between COVID-19 Patients in the Survival and Death Groups |
Results
Comparison of General Data Between COVID-19 Patients in the Survival and Death Groups
The differences in body temperature, heart rate, malignant tumor, coronary heart disease, diabetes mellitus, and body mass index(BMI) on admission between the two groups were not statistically significant (P>0.05). In the death group, the proportion of male patients (gender), patients > 60 years old (age), patients without immunizations, and patients with hypertension and chronic renal insufficiency was more significant than that in the survival group, the difference was statistically significant (P<0.05, Table 1).
Comparison of Pectoralis Muscle CT Value Between COVID-19 Patients in the Survival and Death Groups
The difference in PMI and PPS on admission between the two groups was statistically significant (P<0.05). The proportion of patients in the death group with low PMI and moderate or severe PSS was significantly higher than that in the survival group (Table 2).
Comparison of Laboratory Parameters Between COVID-19 Patients in the Survival and Death Groups
The difference between β-HB, GGT, Lym, Mono, Hgb, and PLT on admission between the two groups revealed no statistical significance (P>0.05). The proportion of patients with increased hs-TnT, NT-proBNP, PCT, CRP, DD, CK, CKMB, BUN, Cre, GLU, ALT, AST, ALP, WBC, and Neu, and with decreased ALB and saturation of blood oxygen in the death group were significantly higher than that in the survival group. The difference was statistically significant (P<0.05, Table 3).
Analysis of the Risk Factors for Death of COVID-19 Patients
Gender, age, blood oxygen saturation, vaccination, hypertension, chronic renal insufficiency, PMI, PSS, hs-TnT, NT-proBNP, PCT, CRP, DD, CK, CKMB, LDH, BUN, Cre, GLU, ALB, ALT, AST, GGT, ALP, WBC and Neu on admission were the death risk factors in COVID-19 patients, according to the results of a Cox regression analysis. Among these characteristics, being female (gender) and having three vaccination doses (vaccine immunization) were protective (Table 4).
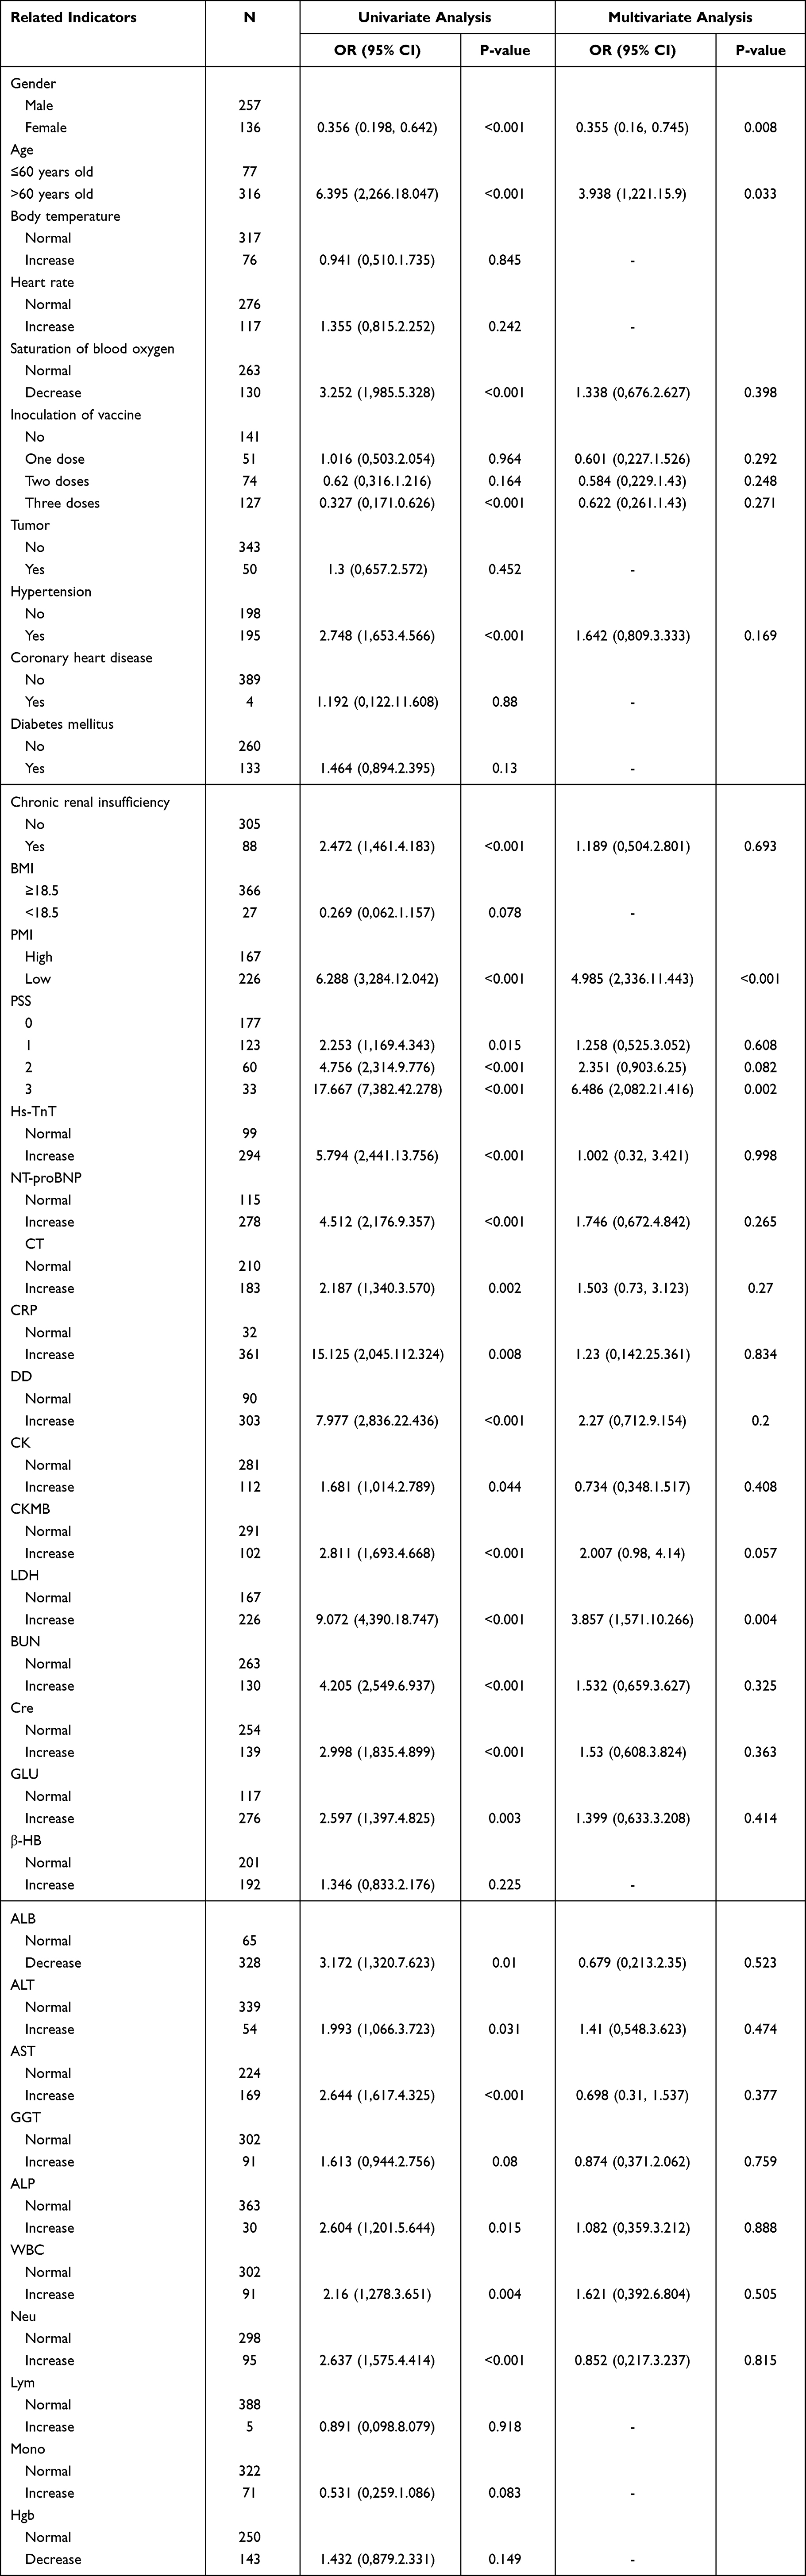 |
Table 4 Analysis of the Risk Factors for the Death of COVID-19 Patients |
With the significant single factors of death occurrence as independent variables and death as dependent variable, multi-factor binary Logistics regression analysis revealed that gender, age, PMI, PSS, and LDH remained independent risk factors for the mortality of COVID-19 patients.
Construction of a Nomogram Based on Independent Risk Factors for Mortality of COVID-19 Patients
The independent risk factors including gender, age, PMI, PSS, and LDH—obtained by multivariate Cox regression analysis were used as predictors. R language was employed to develop a prognostic mortality model for COVID-19 patients (Figure 2). Each risk factor was assigned various points based on the extent of impact on the clinical outcome, before adding up the scores. The total scores were translated into the risk of death of a particular patient to predict the risk.
 |
Figure 2 Prognostic nomogram model of risk for death in patients with COVID-19. Notes: PPS, PMI, LDH, gender and age of a single patient were corresponding to the top scoring scale bar. Subsequently, the five scores were added up. According to the total score, the corresponding value in the Total Points scale strip was determined. The value in the Risk scale strip matched the above Total Point value, and the patient’s risk of death can be predicted. |
The calibration curve was used to verify the consistency between the predicted death rate of COVID-19 patients and the actual observed value. The results showed that the broken lines connected by five points were uniformly distributed near the diagonal, indicating that the predicted mortality rate of the graph was consistent with the actual clinical mortality rate (Figure 3).
 |
Figure 3 Consistency between the predicted mortality and actual observed results in COVID-19 patients was validated by the calibration curve. |
The mortality of COVID-19 patients was analyzed by the ROC curve to validate the accuracy of the nomogram (Figure 4). The prognostic model had higher clinical significance, as indicated by the ROC area under the curve (AUC) of 0.857.
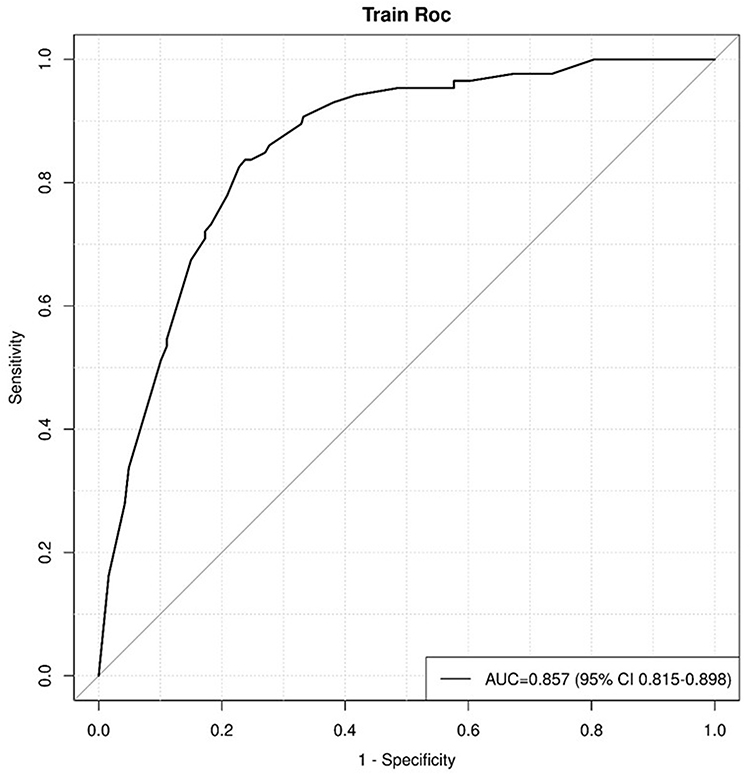 |
Figure 4 ROC curve of the prognostic nomogram model of risk for death in patients with COVID-19. |
Discussion
This work collected demographic information, clinical data, CT imaging, and laboratory examination from 393 COVID-19 patients (ie, including common, severe, and critical cases) within 24 hours of admission. Cox multivariate regression analysis was used to determine the independent risk factors associated with death and a probability model was constructed to predict the risk of death. Gender, age, PMI, PSS, and LDH were found to be independent risk factors for COVID-19 mortality. And based on the above indicators, the nomogram can predict the risk of mortality in COVID-19 patients.
The death rate of COVID-19 patients was 21.89% (86/393), higher than that reported by Surov et al (13.53%).17 This is because the cases in our study included common, severe, and critical patients, whereas mild ones were excluded. The death group was mostly male (81.4%), and most of the patients were above 60 years (95.3%), agreeing with previous reports.17,18 Du et al reported that age (≥65 years) is an independent and robust death predictor.18 Additionally, Petrilli et al found that old age (≥75 years) and males are independent predictors of the death of patients infected with COVID-19.19
In the present study, patients with COVID-19 who also had hypertension or renal insufficiency died at a higher rate. In contrast, patients with diabetes mellitus, malignant tumors, or coronary heart disease, on the other hand, did not affect their fatality rates. A meta-analysis of 42 studies revealed that acute kidney injury, COPD, diabetes mellitus, hypertension, cardiovascular disorder, cancer, increased D-dimer, male, older age, smoking, and obesity were all risk factors for poor clinical outcomes in COVID-19 patients.20 Aboueshia et al reported that patients with COVID-19 and cancer had more prolonged hospital stays, however no correlation existed between these factors and death.21 These findings are consistent with our research findings. Furthermore, we discovered that the proportion of death cases in COVID-19 patients who received three doses of vaccination significantly decreased, matching the findings of Jamie et al.22 The study reported that vaccination reduced clinical symptoms and disease severity in elderly patients with COVID-19.22
Computerized tomography (CT) scanning is a relatively precise means of evaluating pectoral muscle mass. Moreover, the inpatients routinely infected with COVID-19 receive CT imaging. Therefore, CT evaluated pectoral muscle mass to prevent extra examination in this work. Chest CT results within 24 hours after admission were considered the baseline results. Image analysis of the uniaxial chest CT images at the 4th thoracic vertebra above the arch of the aorta was performed using the slicematic software to calculate PMI and PSS. Consequently, the differences in PMI and PSS between patients with COVID-19 in the survival and death groups were statistically significant (P<0.05). Schiaffino et al used axial CT imaging at the T5 and T12 vertebrae to assess the cross-sectional area and attenuation of the paravertebral muscle of COVID-19 patients. The results revealed that low muscle mass was independently associated with ICU admission and in-hospital mortality rates.8 The proportion of patients in the death group with low PMI and moderate or severe PSS was significantly higher than that in the survival group. These findings revealed that low pectoral muscle mass and pneumonia severity is linked to the death outcome, similar to the reports by Schiaffino et al.8 Moreover, Ufuk et al evaluated PMA, PMI, and PSS of patients infected with COVID-19 on admission and discovered that PMA, PMI, and PSS correlated with the incidence of tracheal intubation, extended hospital stay, and mortality.23
Multiple hematological indices including Hgb, HCT, WBC and PLT and biochemical parameters, ie, ALT, AST and LDH were changed in COVID-19 patients. As a result, these indices and parameters have clinical value for diagnostic and prognostic evaluation of COVID-19. Lym and PLT significantly decreased in COVID-19 individuals with severe diseases or mortality. At the same time, there was an increase in WBC levels, biomarkers for inflammation, heart and muscle injury, hepatorenal function, as well as coagulation function increased.12 We observed an increased number of patients in the death group compared to that in the survival group who had increased hs-TnT, NT-proBNP, PCT, CRP, DD, CK, CKMB, LDH, BUN, Cre, GLU, ALT, AST, ALP, WBC, and Neu or reduced ALB and blood oxygen saturation (P<0.05).
The univariate analysis factors that significantly affected the death outcome were designated as independent variables, with death as the dependent variable. The findings of multivariate binary Logistics regression analysis findings revealed that gender, age, PMI, PSS, and LDH remained independent risk factors for the death of COVID-19 patients. Considering the effect of the aforementioned risk factors, the risk of death significantly increased in male patients or patients with advanced age (60 years old), low PMI, moderate or severe PSS, or high LDH. Notably, the univariate Cox proportional hazard model for clinical laboratory data revealed that increased hs-TnT, NT-proBNP, PCT, CRP, DD, CK, CKMB, LDH, BUN, Cre, GLU, ALT, AST, ALP, WBC, or Neu and decreased ALB or blood oxygen saturation were risk factors for the death of COVID-19 patients. In multivariate Cox regression analysis, LDH remained the independent risk factor for COVID-19 infection-related deaths. Li et al reported increased LDH levels on admission as an independent risk factor for the severity and death of COVID-19 patients.24 The serum LDH level can significantly increase when acute hypoxia or inflammation occurs. Since COVID-19 infection primarily targets the lungs and causes hypoxia, thrombosis, inflammation, and organ injury, increased LDH in serum is an important laboratory parameter of COVID-19 severity.25
Several studies have shown that male patients or patients with advanced age, reduced pectoral muscle mass, abnormal hematological indices or biochemical parameters are more likely to progress to severe and critical cases, and even death, when infected with COVID-19.12,18,19,23 The above studies emphasized the role of demographic characteristics, clinical features, and laboratory parameters in predicting COVID-19 prognosis. However, less emphasis was focused on the combination of risk factors, including CT features and laboratory parameters within 24 hours after admission, to predict the survival probability of COVID-19 patients for the subsequent weeks. In the present study, the nomogram in our study was based on five independent risk factors, including gender, age, PMI, PSS, and LDH. The calibration curve validated the consistency between the predicted mortality of COVID-19 patients and the observed results. Mortality prediction of the nomogram was consistent with the actual clinical mortality, as revealed by the results of a polygon connected by five points uniformly distributed near the diagonal. Moreover, the ROC curve was used to verify the accuracy of the nomogram by analyzing the mortality of COVID-19 patients. The prognostic model exhibited greater clinical significance, as demonstrated by the results that the AUC of ROC being 0.857.
limitations
This work has compelling limitations. First, the retrospective study concerning clinical cases was conducted in a single hospital with a small sample size. Secondly, all the patients included in the study had common, severe, and critical cases; the mild cases were however excluded. Thirdly, COVID-19 patients without chest CT imaging were also excluded. Only patients with severe to moderate conditions received CT imaging data, explaining the higher mortality in this work. And this might be the potential for sampling bias. Future investigations should be conducted to expand the sample volume among multi-center studies and include all the patients infected with COVID-19 for reducing sampling bias.
Conclusion
In summary, gender, age, PMI, PSS, and LDH are all independent risk factors for COVID-19 mortality. Thus, the nomogram based on the above indicators can predict the risk of mortality in COVID-19 patients. This may have the potential of being clinical application in prognostic evaluation of COVID-19.
Author Contributions
All authors made a significant contribution to the work reported, whether that is in the conception, study design, execution, acquisition of data, analysis and interpretation, or in all these areas; took part in drafting, revising or critically reviewing the article; gave final approval of the version to be published; have agreed on the journal to which the article has been submitted; and agree to be accountable for all aspects of the work.
Funding
This work was supported by Natural Science Foundation of Fujian Province (No.2022J011341).
Disclosure
The authors report no conflicts of interest in this work.
References
1. Chen N, Zhou M, Dong X, et al. Epidemiological and clinical characteristics of 99 cases of 2019 novel coronavirus pneumonia in Wuhan, China: a descriptive study. Lancet. 2020;395(10223):507–513. doi:10.1016/S0140-6736(20)30211-7
2. Zhou F, Yu T, Du R, et al. Clinical course and risk factors for mortality of adult inpatients with COVID-19 in Wuhan, China: a retrospective cohort study. Lancet. 2020;395(10229):1054–1062. doi:10.1016/S0140-6736(20)30566-3
3. Hu Y, Sun J, Dai Z, et al. Prevalence and severity of Corona virus disease 2019 (COVID-19): a systematic review and meta-analysis. J Clin Virol. 2020;127:104371. doi:10.1016/j.jcv.2020.104371
4. Pepera G, Tribali MS, Batalik L, et al. Epidemiology, risk factors and prognosis of cardiovascular disease in the Coronavirus Disease 2019 (COVID-19) pandemic era: a systematic review. Rev Cardiovasc Med. 2022;23(1):28. doi:10.31083/j.rcm2301028
5. Welch C, Greig C, Masud T, et al. COVID-19 and Acute Sarcopenia. Aging Dis. 2020;11(6):1345–1351. doi:10.14336/AD.2020.1014
6. Morley JE, Kalantar-Zadeh K, Anker SD. COVID-19: a major cause of cachexia and sarcopenia? J Cachexia Sarcopenia Muscle. 2020;11(4):863–865. doi:10.1002/jcsm.12589
7. Anker MS, Landmesser U, von Haehling S, et al. Weight loss, malnutrition, and cachexia in COVID-19: facts and numbers. J Cachexia Sarcopenia Muscle. 2021;12(1):9–13. doi:10.1002/jcsm.12674
8. Schiaffino S, Albano D, Cozzi A, et al. CT-derived Chest Muscle Metrics for Outcome Prediction in Patients with COVID-19. Radiology. 2021;300(2):E328–E336. doi:10.1148/radiol.2021204141
9. Kim JW, Yoon JS, Kim EJ, et al. Prognostic Implication of Baseline Sarcopenia for Length of Hospital Stay and Survival in Patients With Coronavirus Disease 2019. J Gerontol a Biol Sci Med Sci. 2021;76(8):e110–e116. doi:10.1093/gerona/glab085
10. Moctezuma-Velazquez P, Miranda-Zazueta G, Ortiz-Brizuela E, et al. Low Thoracic Skeletal Muscle Area Is Not Associated With Negative Outcomes in Patients With COVID-19. Am J Phys Med Rehabil. 2021;100(5):413–418. doi:10.1097/PHM.0000000000001716
11. Molwitz I, Ozga AK, Gerdes L, et al. Prediction of abdominal CT body composition parameters by thoracic measurements as a new approach to detect sarcopenia in a COVID-19 cohort. Sci Rep. 2022;12(1):6443. doi:10.1038/s41598-022-10266-0
12. Ghaznavi-Rad E, Khosravi M, Sayyadi M. The importance of using routine laboratory tests in the diagnosis and prognosis of patients with coronavirus disease 2019: shedding light on clinical laboratory data in COVID-19. J Clin Lab Anal. 2022;36(11):e24713. doi:10.1002/jcla.24713
13. Battaglini D, Lopes-Pacheco M, Castro-Faria-Neto HC, et al. Laboratory Biomarkers for Diagnosis and Prognosis in COVID-19. Front Immunol. 2022;13:857573. doi:10.3389/fimmu.2022.857573
14. Lin Q, Wu L, Lin W, et al. Correlation between chest CT severity score and laboratory indicators in patients with Coronavirus disease 2019 (COVID-19). Int J Clin Pract. 2021;75(12):e14907. doi:10.1111/ijcp.14907
15. National Health Commission of the People’s Republic of China. Notice on Issuing the Diagnosis and Treatment Plan for Pneumonia Caused by Novel Coronavirus Infection (Trial Tenth Edition); 2019.
16. Li K, Fang Y, Li W, et al. CT image visual quantitative evaluation and clinical classification of coronavirus disease (COVID-19). Eur Radiol. 2020;30(8):4407–4416. doi:10.1007/s00330-020-06817-6
17. Surov A, Kardas H, Besutti G, et al. Prognostic Role of the Pectoralis Musculature in Patients with COVID-19. A Multicenter Study. Acad Radiol. 2023;30(1):77–82. doi:10.1016/j.acra.2022.05.003
18. Du RH, Liang LR, Yang CQ, et al. Predictors of mortality for patients with COVID-19 pneumonia caused by SARS-CoV-2: a prospective cohort study. Eur Respir J. 2020;55(5):2000524. doi:10.1183/13993003.00524-2020
19. Petrilli CM, Jones SA, Yang J, et al. Factors associated with hospital admission and critical illness among 5279 people with coronavirus disease 2019 in New York City: prospective cohort study. BMJ. 2020;369:m1966. doi:10.1136/bmj.m1966
20. Dessie ZG, Zewotir T. Mortality-related risk factors of COVID-19: a systematic review and meta-analysis of 42 studies and 423,117 patients. BMC Infect Dis. 2021;21(1):855. doi:10.1186/s12879-021-06536-3
21. Aboueshia M, Hussein MH, Attia AS, et al. Cancer and COVID-19: analysis of patient outcomes. Future Oncol. 2021;17(26):3499–3510. doi:10.2217/fon-2021-0121
22. Lopez Bernal J, Andrews N, Gower C, et al. Effectiveness of the Pfizer-BioNTech and Oxford-AstraZeneca vaccines on covid-19 related symptoms, hospital admissions, and mortality in older adults in England: test negative case-control study. BMJ. 2021;373:n1088. doi:10.1136/bmj.n1088
23. Ufuk F, Demirci M, Sagtas E, et al. The prognostic value of pneumonia severity score and pectoralis muscle Area on chest CT in adult COVID-19 patients. Eur J Radiol. 2020;131:109271. doi:10.1016/j.ejrad.2020.109271
24. Li C, Ye J, Chen Q, et al. Elevated Lactate Dehydrogenase (LDH) level as an independent risk factor for the severity and mortality of COVID-19. Aging. 2020;12(15):15670–15681. doi:10.18632/aging.103770
25. Liu Y, Yang Y, Zhang C, et al. Clinical and biochemical indexes from 2019-nCoV infected patients linked to viral loads and lung injury. Sci China Life Sci. 2020;63(3):364–374. doi:10.1007/s11427-020-1643-8
 © 2023 The Author(s). This work is published and licensed by Dove Medical Press Limited. The
full terms of this license are available at https://www.dovepress.com/terms
and incorporate the Creative Commons Attribution
- Non Commercial (unported, 3.0) License.
By accessing the work you hereby accept the Terms. Non-commercial uses of the work are permitted
without any further permission from Dove Medical Press Limited, provided the work is properly
attributed. For permission for commercial use of this work, please see paragraphs 4.2 and 5 of our Terms.
© 2023 The Author(s). This work is published and licensed by Dove Medical Press Limited. The
full terms of this license are available at https://www.dovepress.com/terms
and incorporate the Creative Commons Attribution
- Non Commercial (unported, 3.0) License.
By accessing the work you hereby accept the Terms. Non-commercial uses of the work are permitted
without any further permission from Dove Medical Press Limited, provided the work is properly
attributed. For permission for commercial use of this work, please see paragraphs 4.2 and 5 of our Terms.
Recommended articles
Development and Validation of a Model That Predicts the Risk of Diabetic Nephropathy in Type 2 Diabetes Mellitus Patients: A Cross-Sectional Study
Yang J, Jiang S
International Journal of General Medicine 2022, 15:5089-5101
Published Date: 20 May 2022
Development of Risk Prediction Model for Muscular Calf Vein Thrombosis with Acute Exacerbation of Chronic Obstructive Pulmonary Disease
Hu X, Li X, Xu H, Zheng W, Wang J, Wang W, Li S, Zhang N, Wang Y, Han K
International Journal of General Medicine 2022, 15:6549-6560
Published Date: 10 August 2022
Paraspinal Muscle Degeneration: A Potential Risk Factor for New Vertebral Compression Fractures After Percutaneous Kyphoplasty
Si F, Yuan S, Zang L, Fan N, Wu Q, Wang T, Wang A
Clinical Interventions in Aging 2022, 17:1237-1248
Published Date: 13 August 2022
Tracking Epidemiological Characteristics and Risk Factors of Multi-Drug Resistant Bacteria in Intensive Care Units
Wu C, Lu J, Ruan L, Yao J
Infection and Drug Resistance 2023, 16:1499-1509
Published Date: 15 March 2023
Construction and Validation of a Novel Nomogram for Predicting the Recurrence of Diffuse Large B Cell Lymphoma Treated with R-CHOP
Gong Y, Yan H, Yang Y, Zhai B, Huang Z, Zhang Z
Pharmacogenomics and Personalized Medicine 2023, 16:291-301
Published Date: 1 April 2023