")
Back to Journals » Cancer Management and Research » Volume 14
Combination of Changes in CEA and CA199 Concentration After Neoadjuvant Chemoradiotherapy Could Predict the Prognosis of Stage II/III Rectal Cancer Patients Receiving Neoadjuvant Chemoradiotherapy Followed by Total Mesorectal Excision
Authors Zhao J , Zhao H , Jia T, Yang S, Wang X
Received 10 June 2022
Accepted for publication 19 September 2022
Published 29 September 2022 Volume 2022:14 Pages 2933—2944
DOI https://doi.org/10.2147/CMAR.S377784
Checked for plagiarism Yes
Review by Single anonymous peer review
Peer reviewer comments 2
Editor who approved publication: Dr Sanjeev K. Srivastava
Jieyi Zhao,1,2 Huamin Zhao,2 Tingting Jia,2 Shiru Yang,2 Xiaoyu Wang1,2
1Department of Neurosurgery, West China Hospital, Sichuan University, Chengdu, People’s Republic of China; 2West China Medical School, Sichuan University, Chengdu, People’s Republic of China
Correspondence: Xiaoyu Wang, Tel +86 18980605160, Email [email protected]
Background: Previous studies have shown that the levels of serum tumor markers CEA and CA19-9 were related to chemoradiotherapy. Therefore, it has been assumed that dynamic monitoring of these markers could predict the prognosis of stage II/III rectal cancer (RC). Therefore, this study proposed to evaluate the prognostic value of changes in serum tumor biomarkers for stage II/III RC patients undergoing neoadjuvant chemoradiotherapy (NCRT) followed by total mesorectal excision (TME).
Methods: A total of 217 patients with stage II/III RC receiving NCRT followed by TME were retrospectively analyzed. Serum CEA and CA199 levels were measured within one week before NCRT and one week before TME. The optimal cut-off points of ∆CEA% and ∆CA199% for prognosis prediction were calculated by receiver operating characteristics (ROC) analysis. Independent prognostic predictors were identified by univariate and multivariate Cox regression analyses. To avoid the efficiency of ∆CEA% and ∆CA199% on serum tumor biomarker change (STBC) score, two models including and excluding ∆CEA% and ∆CA199% were established separately in multivariate analysis.
Results: The optimal cut-off point for ∆CEA% and ∆CA199% were − 30.29% and 20.30%, respectively. Univariate analysis showed that ∆CEA%, ∆CA199%, STBC score, ypT staging and yN staging could predict OS. ypT staging and STBC score could predict DFS. In multivariate analysis, only ∆CA199% (HR = 0.468, 95% CI: 0.220– 0.994, p = 0.048), ypT staging (HR = 0.420, 95% CI: 0.182– 0.970, p = 0.042), and STBC score (HR = 0.204, 95% CI: 0.078– 0.532, p = 0.001) were independently related to OS; and STBC score (HR = 0.412, 95% CI: 0.216– 0.785, p=0.007) and ypT staging (HR = 0.421, 95% CI: 0.224– 0.792, p = 0.007) were independently related to DFS.
Conclusion: We established a combined STBC score to predict the prognosis of stage II/III RC patients receiving NCRT followed by TME. The predictive value of the combined score was stronger than a single marker alone and even stronger than several pathological indicators.
Keywords: neoadjuvant chemoradiotherapy, stage II/III rectal cancer, total mesorectal excision, prognosis, STBC score
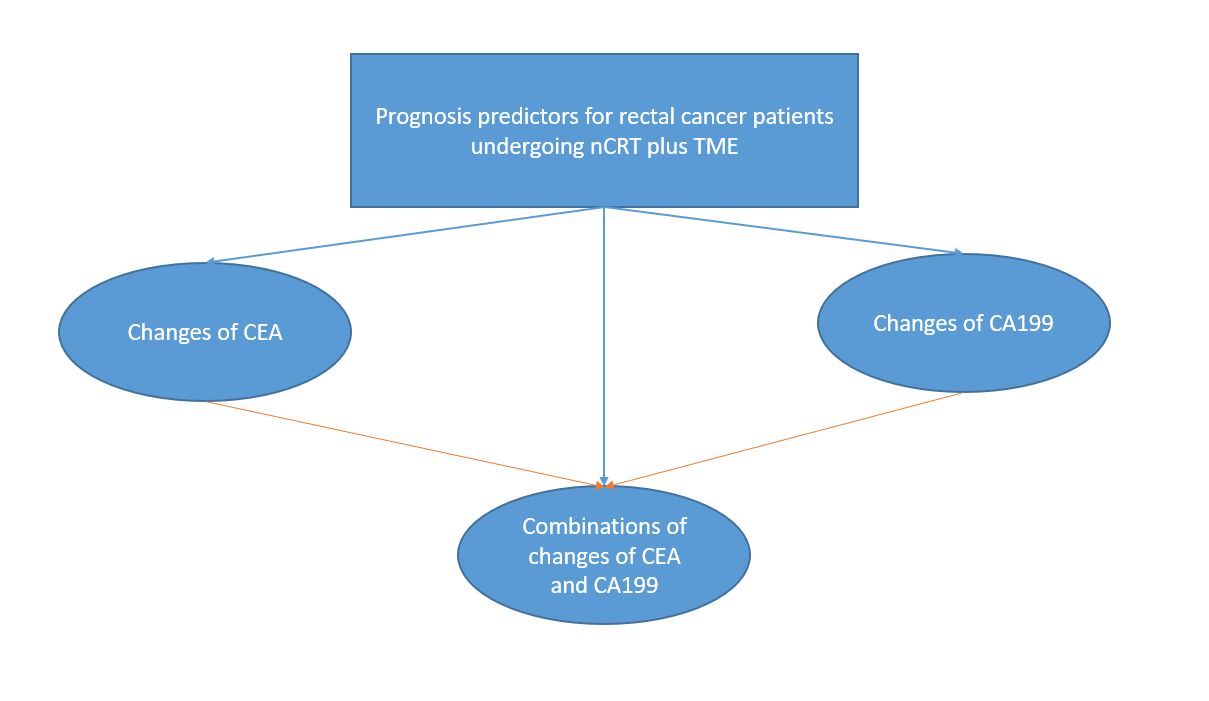
Graphical Abstract:
Introduction
The treatment of stage II/III rectal cancer (RC) is the most controversial part in the treatment of RC. Although NCCN guidelines recommend NCRT as the treatment of stage II/III RC followed by total mesorectal excision (TME),1 since it could reduce the local recurrence rate from 21% to 10%, it could not prevent distant metastasis, and additional systemic chemotherapy after NCRT before the operation should be administered in patients with high poor prognosis. However, additional systemic chemotherapy could cause an increased risk of toxicity.2,3 Therefore, it is essential to distinguish stage II/III RC patients with good prognosis from those with poor.
Previous studies have proposed many methods to predict the prognosis of stage II/III RC patients receiving NCRT followed by TME.4–8 However, these methods had the following disadvantages: Firstly, some risk factors, such as pathological predictors, could only be obtained after surgery, which could not assist in deciding whether patients need extra systematic chemotherapy after NCRT but before surgery.4–8 Secondly, the cost of some molecular or protein predictors could be substantial and would increase the burden on patients of the healthcare system.4–8 Therefore, it is of great clinical significance to find a cheap and convenient predictor to predict the prognosis of stage II/III RC patients receiving NCRT followed by TME.
CEA and CA19-9 are cancer-specific markers widely applied in clinical practice. Blood tests for them are cheap, convenient and minimally invasive. And they are usually elevated in patients with cancers.9 During chemotherapy, CEA and CA19-9 usually change dynamically.10 Previous studies have shown CEA and CA19-9 have good diagnostic and prognostic value in gastric, breast and colorectal cancers.9–11 However, these studies were either limited to CEA and CA19-9 changes after chemotherapy instead of after NCRT or focused on stage IV RC instead of stage II/III.12,13 Moreover, previous research only evaluated the prognostic value of single tumor biomarker changes, instead of combining them.14,15 It was predicted that a combination of changes of tumor markers might predict tumor shrinkage or growth and prognosis better.15 To verify this hypothesis, we retrospectively analyzed the CEA and CA19-9 levels of stage II/III RC patients who received NCRT followed by TME in our center. Subsequently, we evaluated the potential of the combination of changes in these markers as prognostic predictors.
Methods
Participants
This study was approved by the Ethics Committee of West China Hospital and complied with the Declaration of Helsinki. The informed consent was waived because it is a retrospective study and the data are anonymous. Patients with stage II/III RC receiving NCRT followed by TME between 2011 and 2021 at our center were reviewed. Patients fulfilling the inclusion criteria were enrolled: 1) Adenocarcinoma proven by colonoscopy. 2) Clinical Stage II/III. 3) The patient received NCRT (radiotherapy (45–54Gy) with concomitant oral capecitabine or intravenous infusion of 5-Fu) followed by TME. 4 Blood was taken within one week before NCRT (and one week before the TME but after NCRT. 5. Patients with annal canal preserved. The following patients were excluded: 1) Patients with other cancers of distal metastasis. 2) patients treated with non-radical surgery. 3) Patients with liver dysfunction or liver disease. 4) Patients with insufficient blood, pathological, and clinical data. 5) Patients only received neoadjuvant chemotherapy. The patient screening flowchart is shown in Figure 1.
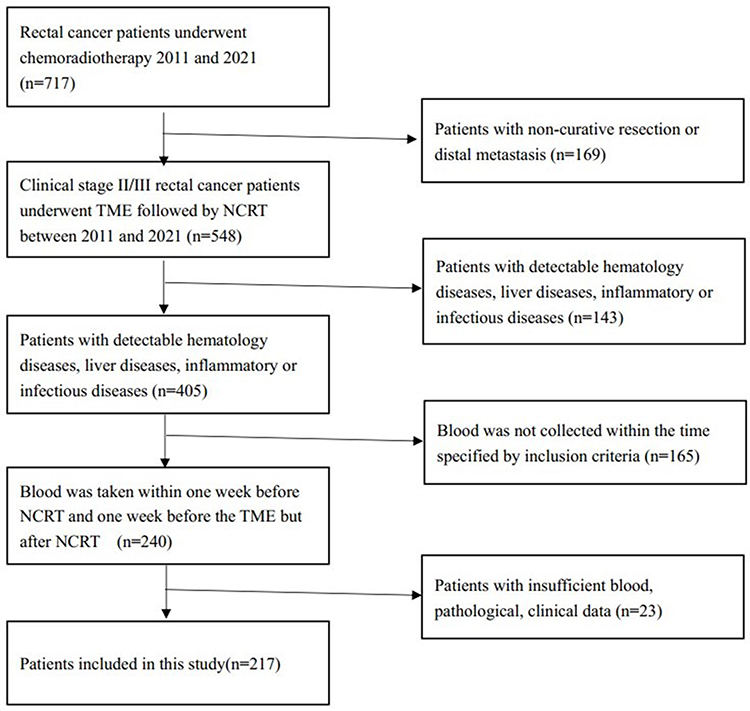 |
Figure 1 Patients screening flow chart. |
Diagnosis and treatment of patients were all following NCCN guidelines.1 Before treatment, the RC stage and metastasis status were evaluated by chest and abdomen enhanced CT, pelvic MRI, and rectal ultrasound. TME was performed 6–10 weeks after the end of NCRT.1
This study was approved by the committee of West China Hospital, and informed consent was waived since this was a retrospective study.
Follow Up
Cancer recurrence was based on imaging or colonoscopy diagnosis. Physical examination and tumor marker detection (CEA, CA19-9) were performed every three months for three years, thereafter every six months until the fifth year. In the first three years, CT or MRI was reexamined every three months, and then every six months. The colonoscopy was performed every year.1,16,17
Primary outcomes were disease-free survival (DFS) and overall survival (OS).18,19 The time interval from operation to local recurrence or distant metastasis was defined as DFS.20 OS was defined as survival time from operation until death by any reason or last follow-up.19 Patients were censored if no local recurrence and distant metastasis were detected at the last follow-up or on the date of death.18
Definitions and Data Collection
Clinicopathological data were gained from patients’ electronic medical records. The collected clinicopathological data were all closely related to the prognosis of RC patients reported by previous studies, including ypT staging, ypN staging, pathological CRM status, pathological perineural invasion, pathological lymphatic invasion, pathological vascular invasion, CEA level, and CA199 level.
∆CEA% was defined as follows: (post-chemoradiotherapy CEA – pre-chemoradiotherapy CEA)/pre-chemoradiotherapy CEA*100%. ∆CA199% as follows: (post-chemoradiotherapy CA199 – pre-chemoradiotherapy CA199)/pre-chemoradiotherapy CA199*100%. The optimal cut-off points of ∆CEA% and ∆CA199% for prognosis prediction were calculated by receiver operating characteristic analysis. Serum tumor biomarker change (STBC) score was defined as follows: Score 0: ∆CEA% <-30.29% and ∆CA199% <20.30%. Score 2: ∆CEA% >-30.29% and ∆CA199% >20.30%. Score 1: other situations.
Statistical Analysis
Receiver operator characteristic (ROC) curves were employed to determine cut-off points.21 The Kaplan–Meier method was adopted for survival analysis, and the Log rank test was used to test the significance of differences between groups.22,23 The factors affecting the prognosis of RC were measured by univariate and multivariate Cox regression models.24 Multivariate analysis was conducted with all factors of P < 0.05 in the univariate.25 All statistical analyses were carried out by SPSS ver. 22.0 (SPSS Inc., Chicago, IL, USA). Statistical significance was considered if p < 0.05.26
To prevent the effect of ∆CEA% and ∆CA199% on STBC score in multivariate analysis, two models including and excluding STBC score were established separately.
Results
Patients’ Characteristics
Finally, a total of 217 patients were included in this study (Figure 1), with 137 males and 80 females. The median age of all included patients was 56.0, with an interquartile range (IQR) of 50.6 to 66.0. Pathological data presented that thirteen patients had vascular invasion, thirty-eight patients had perineural invasion, six patients had positive CRM status, and thirteen patients had lymphatic invasion. One hundred and eight patients were in ypT0-2 staging, while 109 in ypT3-4 staging. Fifty-four patients had lymph node metastasis, while 163 patients did not have.
The median follow-up period was 33 months (interquartile range 23–49 months), with ten patients (4.6%) lost to follow up. During this period, 30 patients died, and 45 patients developed tumour recurrence. Among these 45 patients, only two patients presented local recurrence, the rest were distal metastasis. All characteristics of the included patients are summarized in Table 1.
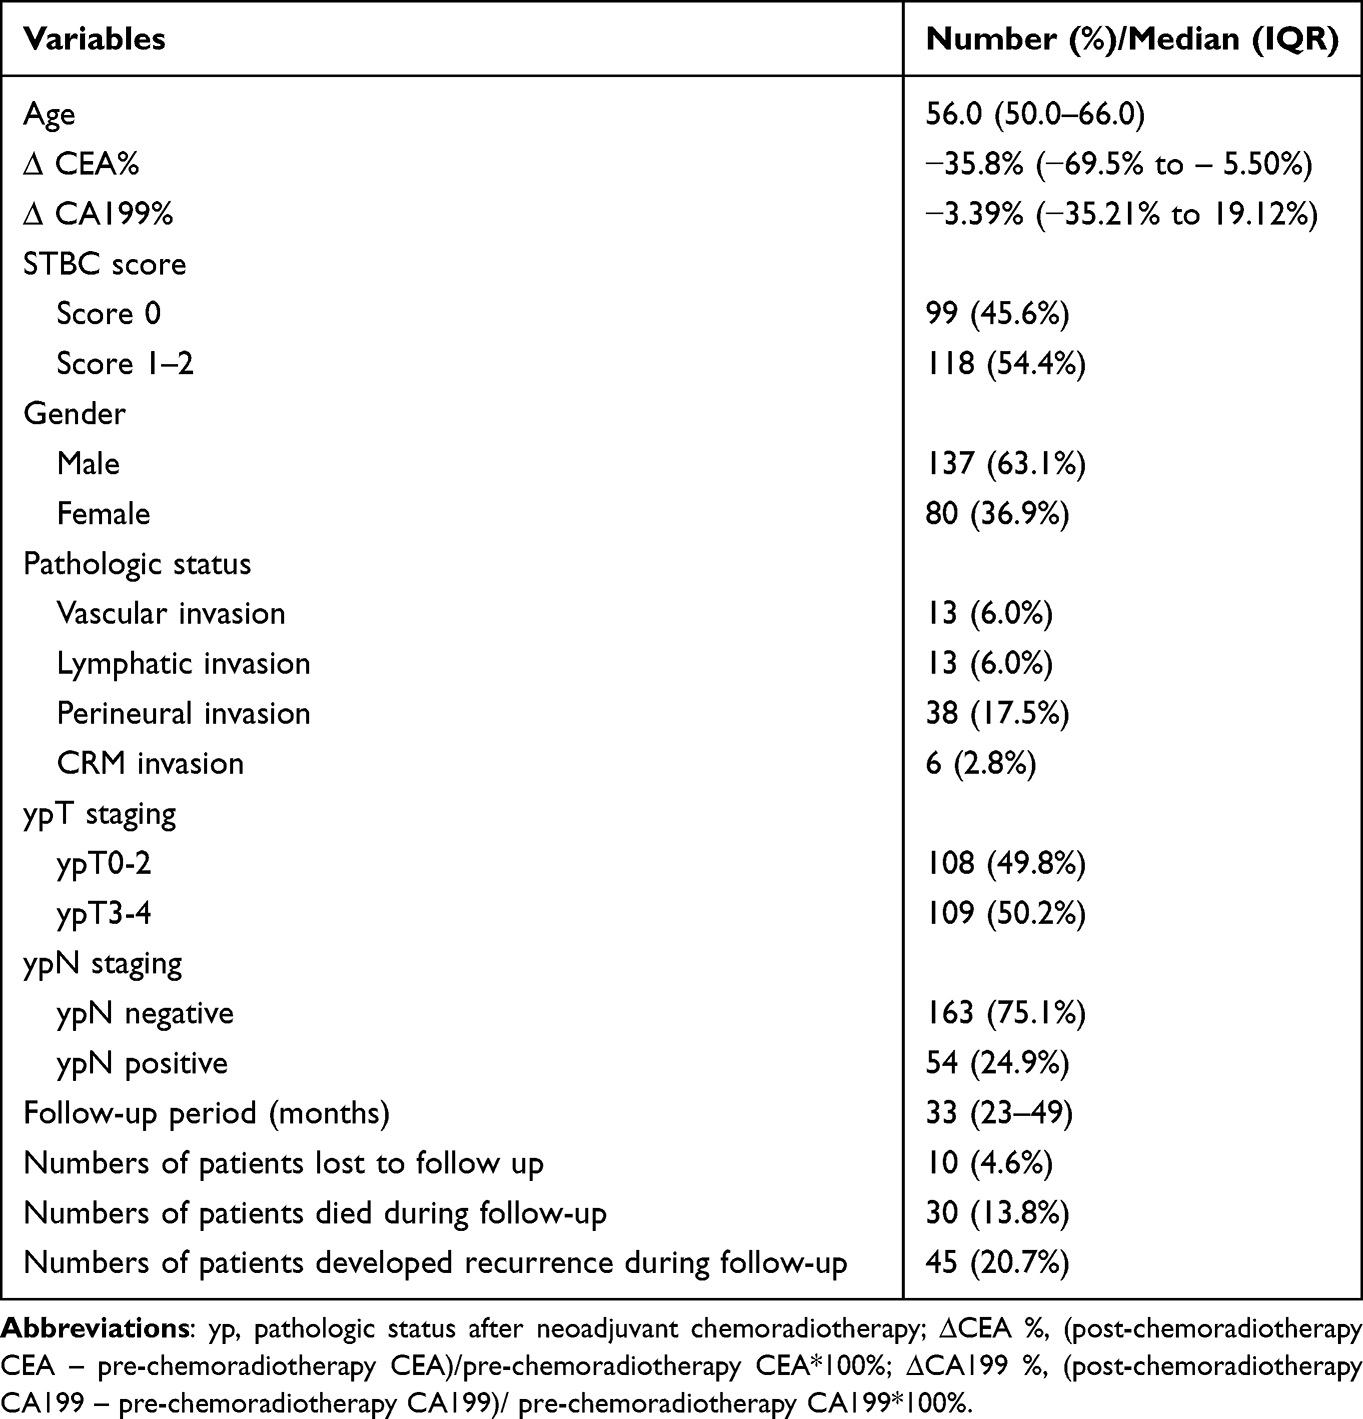 |
Table 1 Characteristics of Patients with Rectal Cancer Who Underwent Preoperative CRT |
Survival Outcome by Kaplan–Meier Curves
ROC curves yielding that the best cut-off point of ∆CEA% and ∆CA199% for survival status were −30.29% and 20.30%, separately.
Kaplan–Meier curves presented that, in terms of OS, ∆CEA%< −30.29%, ∆CA199%<20.30% and lower STBC score were all related to better outcomes (Figures 2–34). Regarding DFS, ∆CEA%> −30.29%, ∆CA199%>20.30% trends toward a worse outcome. However, the difference was not significant (Figures 5–67). Only a higher STBC score had a significantly poorer outcome.
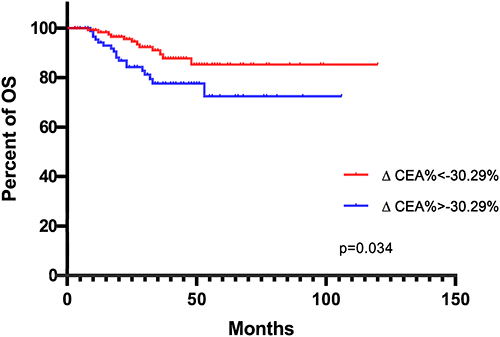 |
Figure 2 K-M curves depicting OS according to ∆CEA% status. |
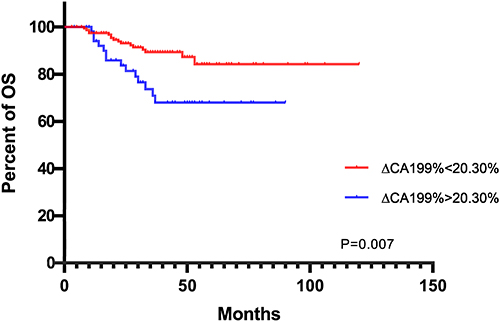 |
Figure 3 K-M curves depicting OS according to ∆CA199% status. |
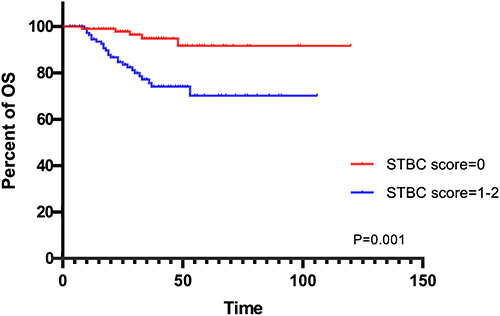 |
Figure 4 K-M curves depicting OS according to STBC score. |
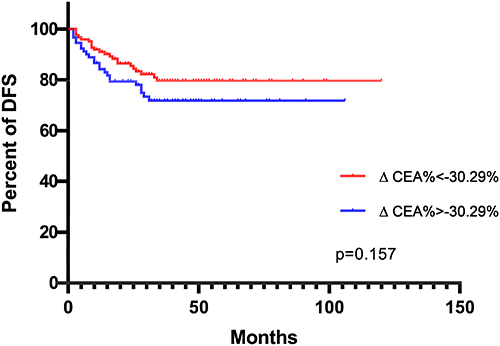 |
Figure 5 K-M curves depicting DFS according to ∆CEA% status. |
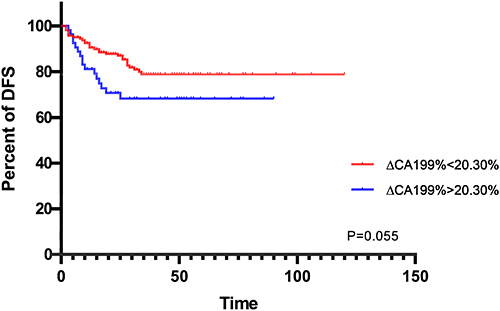 |
Figure 6 K-M curves depicting DFS according to ∆CA199% status. |
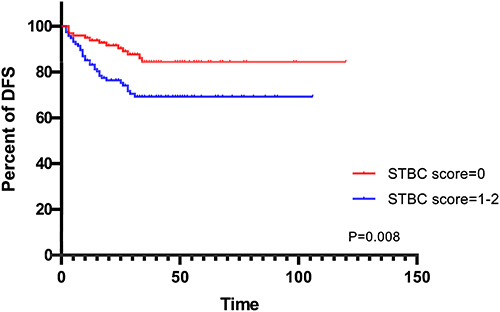 |
Figure 7 K-M curves depicting DFS according to STBC score. |
Univariate and Multivariate Analysis for OS
In terms of univariate analysis, ∆CEA%, ∆CA199%, STBC score, ypT staging and ypN staging were able to predict prognosis (Table 2). Multivariate analysis model 1 revealed that ∆CA199% (HR = 0.468, 95% CI: 0.220–0.994, p = 0.048) could independently predict patients prognosis, while ∆CEA% (HR = 0.558, 95% CI: 0.259–1.201, p = 0.136) failed (Table 3). Multivariate analysis model 2 suggested that STBC score (HR = 0.204, 95% CI: 0.078–0.532, p = 0.001) and ypT staging (HR = 0.426, 95% CI: 0.184–0.986, p = 0.046) were independent prognosis predictors, and STBC score had the highest prediction potency among all clinic-pathological indicators (Table 3).
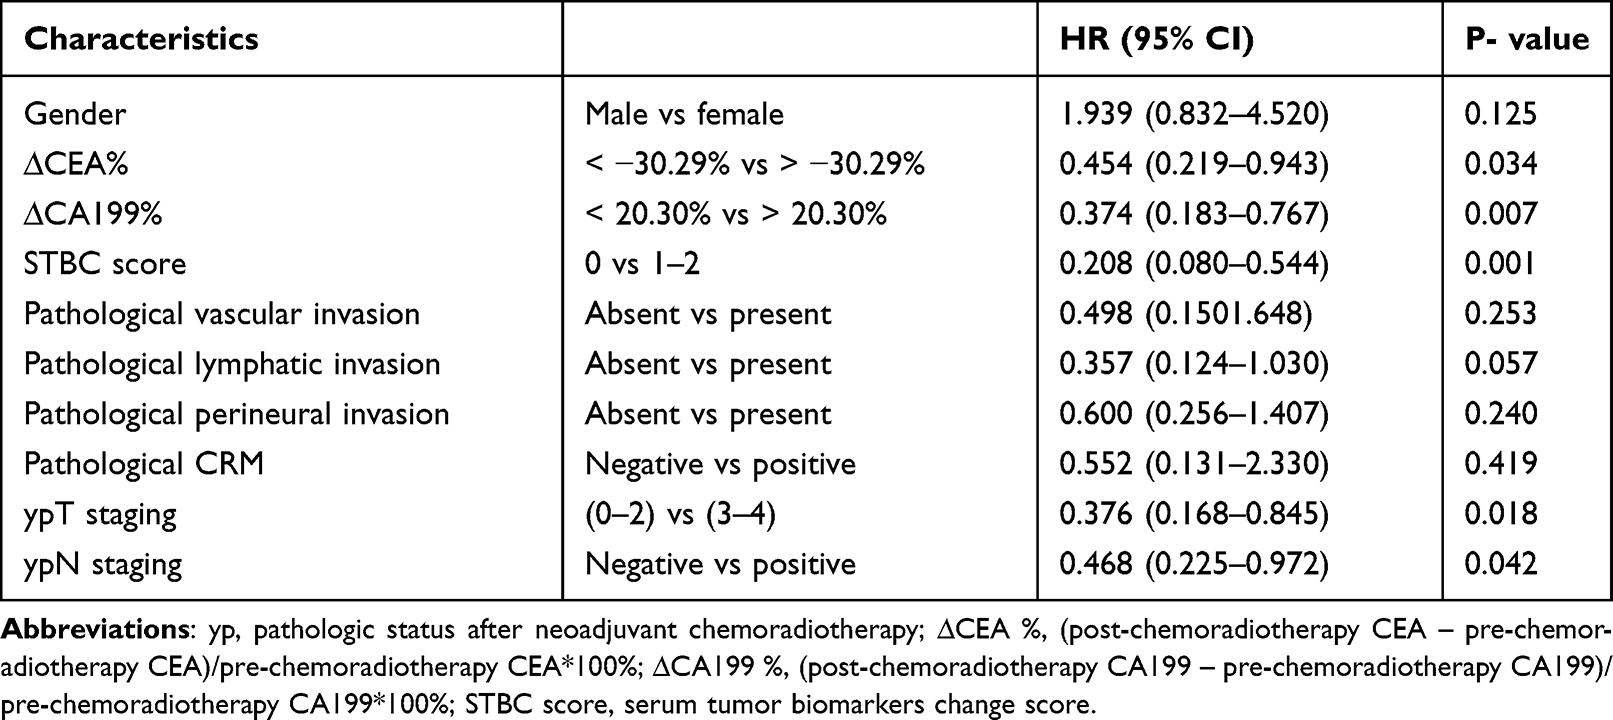 |
Table 2 Univariate Cox Regression Analysis for OS |
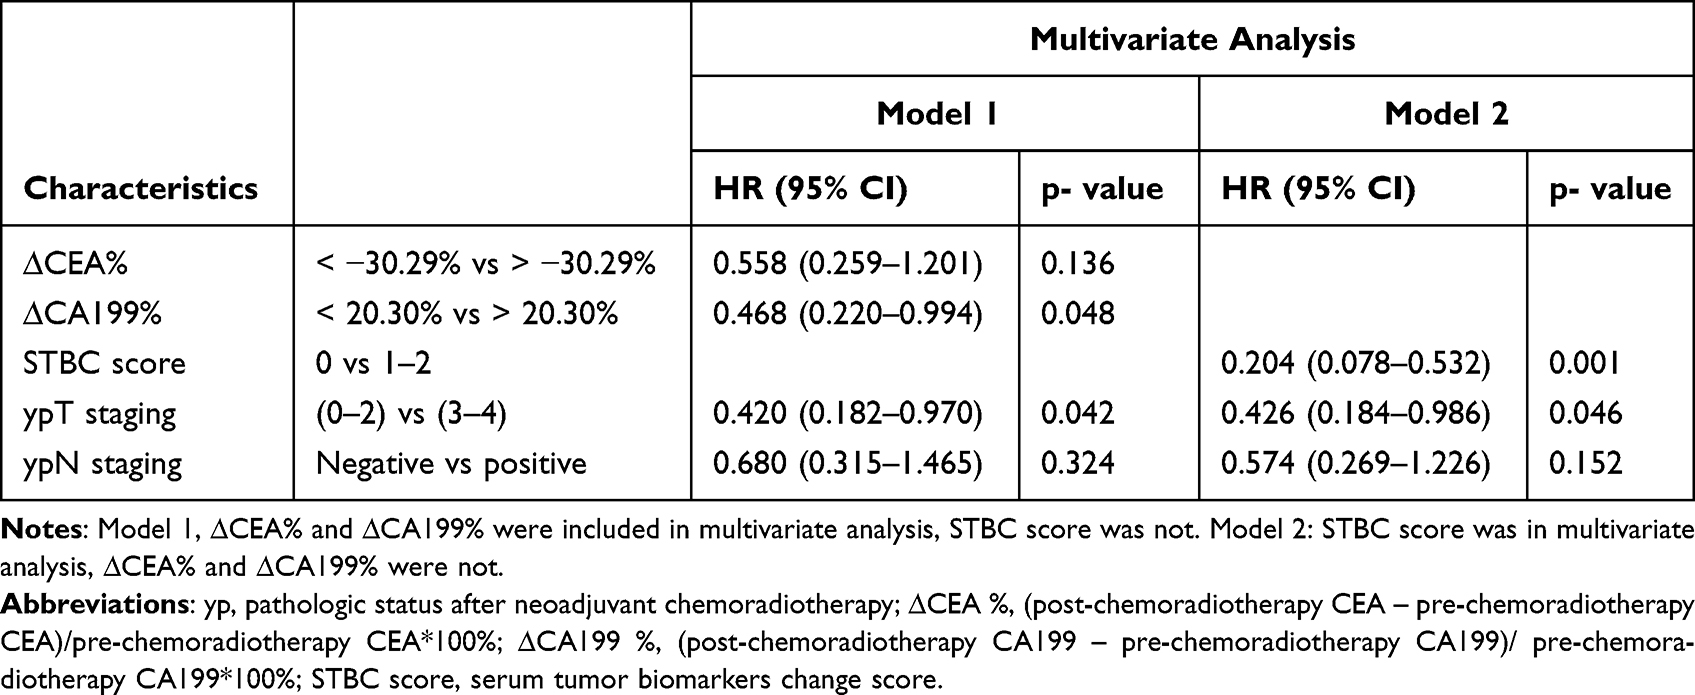 |
Table 3 Multivariate Cox Regression Analysis for OS |
Univariate and Multivariate Analysis for DFS
According to the Cox regression analysis, ∆CEA% and ∆CA199% failed to predict DFS. Only STBC score (HR = 0.412, 95% CI: 0.216–0.785, p = 0.007) and ypT staging (HR = 0.421, 95% CI: 0.224–0.792, p = 0.007) could independently predict DFS whether in terms of univariate or multivariate analysis (Tables 4 and 5).
 |
Table 4 Univariate Cox Regression Analysis for DFS |
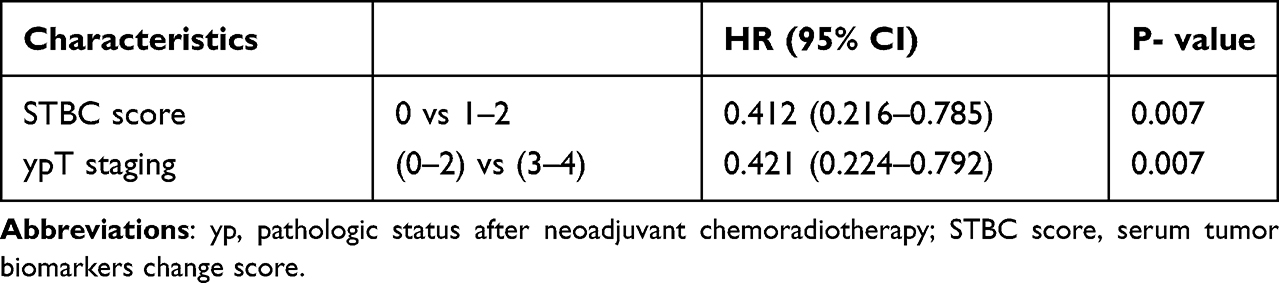 |
Table 5 Multivariate Cox Regression Analysis for DFS |
Discussion
The present study results showed that the combination of changes in tumor markers after NCRT was more effective in predicting prognosis than using one indicator alone. In terms of OS, although univariate analysis proved that lower ∆CEA% and ∆CA199% were potential factors for better outcomes, in multivariate analysis, only STBC score, ∆CA199%, and pT staging were associated with prognosis independently. Moreover, the STBC score was more significant. In terms of DFS, ∆CEA% and ∆CA199% failed to significantly predict prognosis. Only STBC score and yp T staging were. Generally speaking, pathological indicators had the strongest predictive value in predicting prognosis. However, in multivariate analysis, STBC score had stronger prognostic power than pathological vascular invasion, perineural invasion, lymphatic invasion, CRM status, and lymph node metastasis, in terms of both DFS and OS.
In recent years, it has been a hot spot in clinical research to distinguish patients with poor prognoses after NCRT and admit more aggressive treatment.2,27,28 Radiological examinations (CT and MRI) are routine examinations after NCRT, which could evaluate tumor regression.29–31 Unfortunately, due to the high cost and/or fear of radiation damage, numerous patients have poor compliance with imaging examination.29–31 In addition, numerous studies proved that although NCRT could promote tumor regression and reduce local recurrence, it could not improve the long-term prognosis of patients.2,27,28,32
Some molecular or protein could also be prognostic predictors. Voboril et al revealed that high NF-kN/P65 positivity in RC samples was associated with worse OS and DFS.33 Qin et al disclosed that OS was improved in XRCC2-negative RC patients compared with XRCC2-positive RC patients.34 Zaanan displayed that RC with high Beclin 1 expression was significantly less likely to regression after chemoradiation treatment.35 Nevertheless, these molecules or protein markers had the following disadvantages in clinical practice: First of all, the detection of these markers could increase the economic burden for patients since it was expensive. Secondly, these new molecules or proteins could only be detected in large medical centers, which was difficult to use widely in clinical practice. Lastly, these new indicators lack uniform standards, and the test results of different medical centers may vary greatly. CEA and CA199 have been widely detected in clinic, which are cheap and convenient, and the detection standards among different hospitals are relatively uniform.
Pathological indicators are usually considered as the most accurate prognostic indicators.36,37 Previous studies revealed that pathological lymphatic invasion, perineural invasion, vascular invasion, CRM invasion, and LN metastasis were associated with a worse outcome.36–38 Nevertheless, pathological features were incomprehensible to collect, frequently impacted by the quality of operation and specimen processing, had high subjectivity and were difficult to quantitate.36,37 Additionally, the pathological indicator could only be retrieved after surgery, and extra chemotherapy before and after NCRT could not be determined.37 Meanwhile, the STBC score could be obtained before surgery.
Tumor markers were cheap and widely used in clinical practice. RECIST standard stipulates that tumor markers could be used as additional indexes to evaluate the curative effect.39,40 For example, after a retrospective analysis of 531 cases of ovarian cancer, Duffy pointed out that continuous monitoring of CA125 levels could reflect the efficacy of chemotherapy for ovarian cancer.41 Furthermore, the decrease of CA125 levels was related to the prognosis of ovarian cancer.41 Numerous studies have also revealed that CEA and CA19-9 levels were closely associated with the chemotherapy efficacy of advanced and metastatic RC.42–44
Serum carcinoembryonic antigen (CEA) is a glycoprotein anchored on the surface of glycosylphosphatidylinositol (GPI) cells,45,46 which plays an essential part in the metastasis and dissemination of RC cells.45,46 The impact of serum CEA level on prognosis has been thoroughly discussed: Patients with elevated CEA levels have a poor tumor response and increased risk of recurrence.47,48 Yang et al also pointed out that for RC patients with pre-CRT CEA greater than 6 ng/mL, the decrease rate of serum CEA level after CRT could be the prognostic factor of DFS.48 Our study result was consistent with many previous studies.
CA19-9 is an antigen expressed by the glycosylated extracellular MUC1 protein that promotes angiogenesis and cell adhesion.49,50 The prognostic value of CA199 in RC patients has been established by research. Zheng et al reported that the elevated CA199 was an independent risk factor for worse prognosis in LARC patients.51 Nonetheless, CA19-9 is affected by various gastrointestinal tumors. Esophageal cancer, colorectal cancer, and hepatocellular carcinoma can all secrete CA199.49,50 Despite cancer, pancreatitis, liver cirrhosis, and bile duct diseases could all increase CA199.52 Consequently, it has not been widely used to predict the prognosis of RC patients in clinic, especially in RC patients who underwent NCRT.
Instead of the single serum tumor biomarker at a single time point, STBC was a score that combined ∆CEA% and ∆CA199%. We supposed that the STBC score could better predict prognosis in RC patients mainly based on three reasons. First, the STBC score combined two serum tumor biomarkers that were closely related to prognosis. Second, the STBC score considered changes in tumor biomarkers at multi-time points. Finally, the application of the ROC curve, not just whether the tumor index exceeds the standard value, contributed to finding the best cut-off value of prognosis prediction.
Our study’s most important clinical significance was as follows: Firstly, we focused on the changes of serum tumor markers at multi-time points. Moreover, we focused specifically on Stage II/III patients undergoing NCRT, a research hot spot. Thirdly, we adopted the ROC curve to determine the optimal cut-off point. Finally, we combined changes of serum tumor markers. STBC score may not only assess the risk of Stage II/III patients but also contributed to making treatment decisions. In detail, patients with high STBC scores should be treated aggressively, and postoperative adjuvant therapy may be more helpful and adaptable to these patients.
However, potential bias may exist due to the small sample size, the relatively strict criteria, and the analyzed data only from a single center. Consequently, further research is needed, especially multi-center prospective research. Additionally, it is possible that the cut-off values were not adequate for patients from other hospital centers, which need further investigation. However, the ideas and methods in this research can be widely used.
Conclusion
In this research, we established a combined serum tumor biomarker change score to predict the prognosis of stage II/III RC patients receiving NCRT followed by TME. The combined score could effectively predict the prognosis. Its predictive value was stronger than a single marker alone and even stronger than several pathological indicators closely related to prognosis.
Abbreviations
NCRT, neoadjuvant chemoradiotherapy; STBC, serum tumor biomarkers change score; OS, overall survival; DFS, disease-free survival; ROC, receiver operating characteristic.
Data Sharing Statement
Inquiries can be directed to the corresponding author [email protected].
Funding
This work was supported by the Department of Science and Technology of Sichuan Province (No. 2022YFS0140).
Disclosure
The authors declare that the research was conducted in the absence of any commercial or financial relationships that could be construed as a potential conflict of interest.
References
1. Benson AB, Venook AP, Al-Hawary MM, et al. Rectal cancer, version 2.2018, NCCN clinical practice guidelines in oncology. J Natl Compr Canc Netw. 2018;16(7):874–901. doi:10.6004/jnccn.2018.0061
2. Karagkounis G, Thai L, Mace AG, et al. Prognostic implications of pathological response to neoadjuvant chemoradiation in pathologic stage III rectal cancer. Ann Surg. 2019;269(6):1117–1123. doi:10.1097/SLA.0000000000002719
3. Peng JY, Li ZN, Wang Y. Risk factors for local recurrence following neoadjuvant chemoradiotherapy for rectal cancers. World J Gastroenterol. 2013;19(32):5227–5237. doi:10.3748/wjg.v19.i32.5227
4. Jiang D, Wang X, Wang Y, et al. Mutation in BRAF and SMAD4 associated with resistance to neoadjuvant chemoradiation therapy in locally advanced rectal cancer. Virchows Arch. 2019;475(1):39–47. doi:10.1007/s00428-019-02576-y
5. Meng X, Wang R, Huang Z, et al. Human epidermal growth factor receptor-2 expression in locally advanced rectal cancer: association with response to neoadjuvant therapy and prognosis. Cancer Sci. 2014;105(7):818–824. doi:10.1111/cas.12421
6. Sun Y, Wu X, Zhang Y, et al. Pathological complete response may underestimate distant metastasis in locally advanced rectal cancer following neoadjuvant chemoradiotherapy and radical surgery: incidence, metastatic pattern, and risk factors. Eur J Surg Oncol. 2019;45(7):1225–1231. doi:10.1016/j.ejso.2019.03.005
7. Yi X, Pei Q, Zhang Y, et al. MRI-based radiomics predicts tumor response to neoadjuvant chemoradiotherapy in locally advanced rectal cancer. Front Oncol. 2019;9:552. doi:10.3389/fonc.2019.00552
8. Zhu K, Zhao Q, Yue J, et al. GOLPH3 overexpression correlates with poor response to neoadjuvant therapy and prognosis in locally advanced rectal cancer. Oncotarget. 2016;7(42):68328–68338. doi:10.18632/oncotarget.12008
9. Monsellato I, Garibaldi E, Cassinotti E, et al. Expression levels of circulating miRNAs as biomarkers during multimodal treatment of rectal cancer – TiMiSNAR-miRNA: a substudy of the TiMiSNAR Trial (NCT03962088). Trials. 2020;21(1):678. doi:10.1186/s13063-020-04568-9
10. Miyakita H, Sadahiro S, Suzuki T, et al. Tumor-infiltrating lymphocytes in biopsy specimens obtained 7 days after starting chemoradiotherapy for rectal cancer are predictors of the response to chemoradiotherapy. Oncology. 2020;98(12):869–875. doi:10.1159/000508922
11. Suzuki T, Sadahiro S, Tanaka A, et al. Predictive markers of chemoradiotherapy for rectal cancer: comparison of biopsy specimens taken before and about 1 week after the start of chemoradiotherapy. Int J Clin Oncol. 2015;20(6):1130–1139. doi:10.1007/s10147-015-0822-7
12. Han L, Mo S, Xiang W, et al. Comparison of four lymph node staging systems for predicting prognosis for stage IV rectum cancer. Ann Transl Med. 2020;8(4):111. doi:10.21037/atm.2019.12.90
13. Chung MJ, Lee JH, Lee JH, et al. Adjuvant chemotherapy in rectal cancer patients treated with preoperative chemoradiation and total mesorectal excision: a multicenter and retrospective propensity-score matching study. Int J Radiat Oncol Biol Phys. 2019;103(2):438–448. doi:10.1016/j.ijrobp.2018.09.016
14. Lai S, Huang L, Luo S, et al. Systemic inflammatory indices predict tumor response to neoadjuvant chemoradiotherapy for locally advanced rectal cancer. Oncol Lett. 2020;20(3):2763–2770. doi:10.3892/ol.2020.11812
15. Lee IH, Hwang S, Lee SJ, et al. Systemic inflammatory response after preoperative chemoradiotherapy can affect oncologic outcomes in locally advanced rectal cancer. Anticancer Res. 2017;37(3):1459–1465.
16. Glynne-Jones R, Wyrwicz L, Tiret E, et al. Rectal cancer: ESMO clinical practice guidelines for diagnosis, treatment and follow-up. Ann Oncol. 2017;28(suppl_4):iv22–iv40. doi:10.1093/annonc/mdx224
17. Watanabe T, Muro K, Ajioka Y, et al. Japanese Society for Cancer of the Colon and Rectum (JSCCR) guidelines 2016 for the treatment of colorectal cancer. Int J Clin Oncol. 2018;23(1):1–34. doi:10.1007/s10147-017-1101-6
18. Burke HB. Overall survival vs disease-specific survival. JAMA Oncol. 2018;4(4):586. doi:10.1001/jamaoncol.2016.6786
19. Mehta RS, Barlow WE, Albain KS, et al. Overall survival with fulvestrant plus anastrozole in metastatic breast cancer. N Engl J Med. 2019;380(13):1226–1234. doi:10.1056/NEJMoa1811714
20. Saad ED, Squifflet P, Burzykowski T, et al. Disease-free survival as a surrogate for overall survival in patients with HER2-positive, early breast cancer in trials of adjuvant trastuzumab for up to 1 year: a systematic review and meta-analysis. Lancet Oncol. 2019;20(3):361–370. doi:10.1016/S1470-2045(18)30750-2
21. Carter JV, Pan J, Rai SN, Galandiuk S. ROC-ing along: evaluation and interpretation of receiver operating characteristic curves. Surgery. 2016;159(6):1638–1645. doi:10.1016/j.surg.2015.12.029
22. Luo H, Xu Y, Zhang X. Kaplan-Meier curve of retrospective study: do not misuse it! Int J Cardiol. 2017;247:28. doi:10.1016/j.ijcard.2017.04.043
23. Yang S. Interim monitoring using the adaptively weighted log-rank test in clinical trials for survival outcomes. Stat Med. 2019;38(4):601–612. doi:10.1002/sim.7958
24. Allgulander C, Fisher LD. Survival analysis (or time to an event analysis), and the Cox regression model–methods for longitudinal psychiatric research. Acta Psychiatr Scand. 1986;74(6):529–535. doi:10.1111/j.1600-0447.1986.tb06279.x
25. Austin PC. Statistical power to detect violation of the proportional hazards assumption when using the Cox regression model. J Stat Comput Simul. 2018;88(3):533–552. doi:10.1080/00949655.2017.1397151
26. Chen MH, Ibrahim JG, Shao QM. Maximum likelihood inference for the cox regression model with applications to missing covariates. J Multivar Anal. 2009;100(9):2018–2030. doi:10.1016/j.jmva.2009.03.013
27. Pazdirek F, Minarik M, Benesova L, et al. Monitoring of early changes of circulating tumor DNA in the plasma of rectal cancer patients receiving neoadjuvant concomitant chemoradiotherapy: evaluation for prognosis and prediction of therapeutic response. Front Oncol. 2020;10:1028. doi:10.3389/fonc.2020.01028
28. Tan Y, Fu D, Li D, et al. Predictors and risk factors of pathologic complete response following neoadjuvant chemoradiotherapy for rectal cancer: a population-based analysis. Front Oncol. 2019;9:497. doi:10.3389/fonc.2019.00497
29. Prampolini F, Taschini S, Pecchi A, et al. Magnetic resonance imaging performed before and after preoperative chemoradiotherapy in rectal cancer: predictive factors of recurrence and prognostic significance of MR-detected extramural venous invasion. Abdom Radiol. 2020;45(10):2941–2949. doi:10.1007/s00261-018-1838-z
30. Shao L, Liu Z, Feng L, et al. Multiparametric MRI and whole slide image-based pretreatment prediction of pathological response to neoadjuvant chemoradiotherapy in rectal cancer: a multicenter radiopathomic study. Ann Surg Oncol. 2020;27(11):4296–4306. doi:10.1245/s10434-020-08659-4
31. Alvarez-Jimenez C, Antunes JT, Talasila N, et al. Radiomic texture and shape descriptors of the rectal environment on post-chemoradiation T2-weighted MRI are associated with pathologic tumor stage regression in rectal cancers: a retrospective, multi-institution study. Cancers. 2020;12(8):2027. doi:10.3390/cancers12082027
32. Zhang H, Huang Y, Sun G, et al. Rectal cancer patients with downstaging after neoadjuvant chemoradiotherapy and radical resection do not benefit from adjuvant chemotherapy. Ann Transl Med. 2020;8(12):743. doi:10.21037/atm-20-1278
33. Voboril R, Rychterova V, Voborilova J, Kubecova M, Fanta J, Dvorak J. NF-κB/p65 expression before and after treatment in rectal cancer patients undergoing neoadjuvant (chemo)radiotherapy and surgery: prognostic marker for disease progression and survival. Neoplasma. 2016;63(3):462–470. doi:10.4149/317_151013N525
34. Qin CJ, Song XM, Chen ZH, et al. XRCC2 as a predictive biomarker for radioresistance in locally advanced rectal cancer patients undergoing preoperative radiotherapy. Oncotarget. 2015;6(31):32193–32204. doi:10.18632/oncotarget.4975
35. Zaanan A, Park JM, Tougeron D, et al. Association of beclin 1 expression with response to neoadjuvant chemoradiation therapy in patients with locally advanced rectal carcinoma. Int J Cancer. 2015;137(6):1498–1502. doi:10.1002/ijc.29496
36. Keller DS, Berho M, Perez RO, Wexner SD, Chand M. The multidisciplinary management of rectal cancer. Nat Rev Gastroenterol Hepatol. 2020;17(7):414–429. doi:10.1038/s41575-020-0275-y
37. Berho M, Bejarano PA. Rectal cancer and the pathologist. Minerva Chir. 2018;73(6):534–547. doi:10.23736/S0026-4733.18.07739-8
38. Kennedy ED, Simunovic M, Jhaveri K, et al. Safety and feasibility of using magnetic resonance imaging criteria to identify patients with “good prognosis” rectal cancer eligible for primary surgery: the phase 2 nonrandomized quicksilver clinical trial. JAMA Oncol. 2019;5(7):961–966. doi:10.1001/jamaoncol.2019.0186
39. Lim TS, Rhee H, Kim GM, et al. Alpha-fetoprotein, des-gamma-carboxy prothrombin, and modified RECIST response as predictors of survival after transarterial radioembolization for hepatocellular carcinoma. J Vasc Interv Radiol. 2019;30(8):1194–200.e1. doi:10.1016/j.jvir.2019.03.016
40. Motoi F, Rikiyama T, Katayose Y, Egawa S, Unno M. Retrospective evaluation of the influence of postoperative tumor marker status on survival and patterns of recurrence after surgery for pancreatic cancer based on RECIST guidelines. Ann Surg Oncol. 2011;18(2):371–379. doi:10.1245/s10434-010-1311-x
41. Duffy MJ, Bonfrer JM, Kulpa J, et al. CA125 in ovarian cancer: European Group on Tumor Markers guidelines for clinical use. Int J Gynecol Cancer. 2005;15(5):679–691. doi:10.1111/j.1525-1438.2005.00130.x
42. Mo CJ, Hu ZJ, Qin SZ, et al. Diagnostic value of platelet-lymphocyte ratio and hemoglobin-platelet ratio in patients with rectal cancer. J Clin Lab Anal. 2020;34(4):e23153. doi:10.1002/jcla.23153
43. Neki K, Eto K, Kosuge M, et al. Identification of the risk factors for recurrence of stage III colorectal cancer. Anticancer Res. 2019;39(10):5721–5724. doi:10.21873/anticanres.13772
44. Baqar AR, Wilkins S, Staples M, Angus Lee CH, Oliva K, McMurrick P. The role of preoperative CEA in the management of colorectal cancer: a cohort study from two cancer centres. Int J Surg. 2019;64:10–15. doi:10.1016/j.ijsu.2019.02.014
45. Camacho-Leal P, Stanners CP. The human carcinoembryonic antigen (CEA) GPI anchor mediates anoikis inhibition by inactivation of the intrinsic death pathway. Oncogene. 2008;27(11):1545–1553. doi:10.1038/sj.onc.1210789
46. Nicholson TB, Stanners CP. Specific inhibition of GPI-anchored protein function by homing and self-association of specific GPI anchors. J Cell Biol. 2006;175(4):647–659. doi:10.1083/jcb.200605001
47. Cheong C, Shin JS, Suh KW. Prognostic value of changes in serum carcinoembryonic antigen levels for preoperative chemoradiotherapy response in locally advanced rectal cancer. World J Gastroenterol. 2020;26(44):7022–7035. doi:10.3748/wjg.v26.i44.7022
48. Yang KL, Yang SH, Liang WY, et al. Carcinoembryonic antigen (CEA) level, CEA ratio, and treatment outcome of rectal cancer patients receiving pre-operative chemoradiation and surgery. Radiat Oncol. 2013;8:43. doi:10.1186/1748-717X-8-43
49. Gold DV, Modrak DE, Ying Z, Cardillo TM, Sharkey RM, Goldenberg DM. New MUC1 serum immunoassay differentiates pancreatic cancer from pancreatitis. J Clin Oncol. 2006;24(2):252–258. doi:10.1200/JCO.2005.02.8282
50. Remmers N, Anderson JM, Linde EM, et al. Aberrant expression of mucin core proteins and o-linked glycans associated with progression of pancreatic cancer. Clin Cancer Res. 2013;19(8):1981–1993. doi:10.1158/1078-0432.CCR-12-2662
51. Zheng Z, Wang X, Huang Y, Lu X, Chi P. Predictive value of changes in the level of carbohydrate antigen 19-9 in patients with locally advanced rectal cancer treated with neoadjuvant chemoradiotherapy. Colorectal Dis. 2020;22(12):2068–2077. doi:10.1111/codi.15355
52. Kato S, Honda K. CA19-9 as a therapeutic target in pancreatitis. Ann Transl Med. 2019;7(Suppl 8):S318. doi:10.21037/atm.2019.09.161
 © 2022 The Author(s). This work is published and licensed by Dove Medical Press Limited. The full terms of this license are available at https://www.dovepress.com/terms.php and incorporate the Creative Commons Attribution - Non Commercial (unported, v3.0) License.
By accessing the work you hereby accept the Terms. Non-commercial uses of the work are permitted without any further permission from Dove Medical Press Limited, provided the work is properly attributed. For permission for commercial use of this work, please see paragraphs 4.2 and 5 of our Terms.
© 2022 The Author(s). This work is published and licensed by Dove Medical Press Limited. The full terms of this license are available at https://www.dovepress.com/terms.php and incorporate the Creative Commons Attribution - Non Commercial (unported, v3.0) License.
By accessing the work you hereby accept the Terms. Non-commercial uses of the work are permitted without any further permission from Dove Medical Press Limited, provided the work is properly attributed. For permission for commercial use of this work, please see paragraphs 4.2 and 5 of our Terms.