
Back to Journals » International Journal of General Medicine » Volume 19
COLGALT2 Polymorphisms are Associated with Osteoarthritis Risk and Clinical Severity in a Chinese Population
Authors Hu H, Cao F, Chen X, Ding Z, Li H, Xie S
Received 2 March 2026
Accepted for publication 9 June 2026
Published 9 July 2026 Volume 2026:19 606367
DOI https://doi.org/10.2147/IJGM.S606367
Checked for plagiarism Yes
Review by Single anonymous peer review
Peer reviewer comments 3
Editor who approved publication: Dr Woon-Man Kung
Haibei Hu,1,* Feng Cao,2,* Xiaodong Chen,1 Zhenfei Ding,1 Huanyu Li,1 Suyu Xie1
1Department of Orthopaedics, The First Affiliated Hospital of Bengbu Medical University, Anhui Key Laboratory of Tissue Transplantation, Bengbu, People’s Republic of China; 2The First School of Clinical Medicine, The First Affiliated Hospital of Bengbu Medical University, Bengbu, People’s Republic of China
*These authors contributed equally to this work
Correspondence: Haibei Hu, Email [email protected]
Purpose: Osteoarthritis (OA) is a highly heritable joint disease. Genome-wide association studies have linked single nucleotide polymorphisms (SNPs) within the collagen beta(1-O) galactosyltransferase 2 (COLGALT2) gene region, notably rs11583641 and rs1046934, to OA risk. Their roles in Chinese populations, clinical phenotypes, and gene expression remains unclear.
Patients and Methods: This case-control study, 230 primary OA patients and 230 matched healthy controls were genotyped for rs11583641 and rs1046934 using the TaqMan assay. OA was diagnosed per American College of Rheumatology (ACR) and Kellgren-Lawrence (K-L) grading. Logistic regression assessed independent associations with OA. COLGALT2 expression in peripheral blood mononuclear cells (PBMC) was measured by quantitative reverse transcription polymerase chain reaction (qRT-PCR).
Results: Allele and genotype distributions of rs11583641 and rs1046934 differed significantly between case and control groups (P< 0.025). Multivariate regression adjusted for age, sex, and BMI showed that rs11583641 and rs1046934 remained associated with OA susceptibility (P< 0.05). Cross-sectional subgroup analyses showed that rs11583641 polymorphism significantly associated with disease duration (P< 0.025) and imaging severity (P< 0.025). COLGALT2 expression was higher in OA patients than controls (P< 0.05). Its expression associated with risk genotypes, with the same trend at both loci: highest in rs11583641 CC and rs1046934 AA carriers, followed by CT and AC carriers, and lowest in TT and CC carriers.
Conclusion: This study provides additional evidence supporting the association of COLGALT2 SNPs with OA susceptibility in a Chinese population. Cross-sectional subgroup analyses suggested that rs11583641 may be associated with severity-related clinical phenotypes. Increased PBMC COLGALT2 expression and its association with risk genotypes offer preliminary correlative evidence warranting further investigation, as these findings may be influenced by systemic inflammation, leukocyte composition, or other confounding factors. Further longitudinal and functional studies are required to clarify its clinical and biological significance. These findings provide additional insights into the genetic and molecular heterogeneity of OA.
Keywords: osteoarthritis, COLGALT2, gene polymorphism, single nucleotide polymorphism, genetic association, gene expression
Introduction
Osteoarthritis (OA) is a global health challenge that affects the bone health and quality of life of more than 600 million people. Its characteristic articular cartilage degeneration, osteophyte formation and secondary synovial inflammation lead to progressive pain and loss of function.1,2 According to the World Health Organization, about 528 million people worldwide suffered from OA in 2019, an increase of 113% compared with 1990. Among them, knee OA is the most common (about 365 million), and about 60% of the patients are women, about 73% of them are older than 55 years old, and the number of patients with this disease will continue to increase.3,4 At present, clinical interventions mainly focus on symptom relief, and there is no radical therapy that can reverse or delay the progression of the disease,5 which indicates that it is necessary to reveal the molecular pathogenesis of OA. The occurrence and development of OA are driven by factors such as age, obesity and injury. However, genetic studies have shown that genetic factors play a key role in the pathogenesis of OA, and their contribution is estimated to be as high as 20%-60%.1 In recent years, a number of large-scale genome-wide association studies (GWAS) and their meta-analysis have identified hundreds of risk-related genetic loci (conservative estimates > 125) in different OA phenotypes/joints, and revealed the genetic heterogeneity of different joint phenotypes. Among them, some studies further integrated multi-omics and functional evidence, prioritizing 77 high-confidence effector genes, which promoted the research from statistical association to the analysis of key biological processes and pathway mechanisms.6–8 However, the specific role of some of these genes, such as collagen beta(1-O) galactosyltransferase 2 (COLGALT2), in the pathogenesis of OA has not been systematically verified. In addition, the correlation between COLGALT2 and the clinical phenotype of OA remains unclear.
COLGALT2 encodes collagen β (1-O) galactosyltransferase 2, which can transfer β-galactose to the hydroxyl lysine residue of collagen molecules and participate in collagen glycosylation and extracellular matrix (ECM) assembly homeostasis.9 Kehayova et al found that the independent single nucleotide polymorphisms (SNPs) rs11583641 identified by GWAS was associated with the risk of OA and was associated with the DNA methylation and expression level of COLGALT2 in synovium, while rs1046934 did not show the same association. Importantly, the effect direction of rs11583641 in the synovium of OA patients is opposite to that observed in cartilage. In synovial tissue, the risk allele of rs11583641 is associated with higher DNA methylation levels and lower COLGALT2 expression. In articular cartilage, the expression of COLGALT2 is up-regulated, showing tissue specificity. This tissue-specific, opposite-direction regulation underscores the complexity of COLGALT2 biology and emphasizes that the genetic risk of this locus may vary depending on the tissue examined.
The core position of COLGALT2 in the pathophysiology of OA and the complexity of its genetic associations have been preliminarily revealed. However, the genetic distribution characteristics of its key SNPs (rs11583641 and rs1046934) in different populations-especially in the Chinese population-and the independent verification of their association with OA risk remain to be further studied. This study aimed to systematically evaluate the associations of COLGALT2 rs11583641 and rs1046934 polymorphisms with osteoarthritis susceptibility and clinical phenotypes in a Chinese population, thereby providing population-specific replication and extension of previous findings from European cohorts. In addition, we explored the relationship between these variants and peripheral blood COLGALT2 expression to further investigate their potential biological relevance in OA.
Material and Methods
Enrolled Objects
This study collected subjects who visited the First Affiliated Hospital of Bengbu Medical University (2023–41). Finally, 460 participants were included, including 230 patients with confirmed primary osteoarthritis and 230 healthy controls. The OA case group included patients with primary OA of the knee and hip. All cases were diagnosed according to the clinical and imaging classification criteria of the American College of Rheumatology (ACR). Among them, the Kellgren-Lawrence (K-L) grade of knee and hip OA cases was ≥2. According to K-L classification, patients with knee and hip OA were further divided into imaging mild-moderate group (K–L=2) and severe group (K–L=3–4). Patients with rheumatoid arthritis or other autoimmune diseases, cartilage dysplasia, infectious or post-traumatic osteoarthritis; previously received joint replacement surgery; patients with severe systemic diseases (such as malignant tumors, severe heart, liver and kidney dysfunction) were excluded.10 All individuals in the healthy control group had no clinical symptoms of pain, swelling, tenderness or limited mobility of the corresponding joints, and, for the knees, and hip joints, the K-L grade was confirmed by X-ray examination to be grade 0 or 1 (that is, there is no clear imaging OA evidence). At the same time, the control group should have no history of autoimmune diseases and malignant tumors.11–13 To control for potential confounding, controls were recruited to have a comparable age and sex distribution to the cases, as confirmed by non‑significant group differences (age: P = 0.66; sex: P = 0.709). The diagnosis of OA was independently confirmed by two chief physicians. Both groups of people signed informed consent and were approved by the First Affiliated Hospital of Bengbu Medical University Ethics Committee.
Clinical Evaluation of OA
Western Ontario and McMaster Universities Osteoarthritis Index (WOMAC) was used to evaluate the clinical symptoms and function of patients. The scale included three dimensions: pain (5 items), stiffness (2 items) and daily activity function (17 items). All items were scored using the Likert scale (0–4 points). The higher the total score and the scores of each subscale, the more severe the pain and stiffness, the more obvious the limitation of joint function.14
SNP Site Selection and Genotyping
According to the previous literature,15,16 rs11583641 (located in COLGALT2) and rs1046934 (located in the adjacent gene tRNA splicing endonuclease subunit 15 (TSEN15), but as a marker of independent OA risk loci, it has been confirmed that the expression of COLGALT2 is regulated by enhancer methylation) were selected for genotyping.
4 mL of fasting peripheral venous blood was collected and placed in an anticoagulant blood vessel containing ethylenediaminetetraacetic acid (EDTA). After collection, it was gently inverted and mixed (to avoid severe shock to reduce hemolysis), and frozen at −80°C as soon as possible to avoid repeated freezing and thawing. Genomic DNA was extracted from whole blood according to the instructions of the genomic DNA extraction kit (Qiagen, Hilden, Germany). DNA concentration and purity were determined using a Varioskan LUX microplate reader (Thermo Fisher Scientific, Waltham, MA, USA) (A260/A280 ratio between 1.8–2.0 is qualified), and qualified samples were used for subsequent analysis.
Genotyping was performed by TaqMan probe method with reference to other studies.17,18 Genotyping of rs11583641 and rs1046934 was performed using a pre-designed TaqMan®SNP Genotyping Assay (Assay ID: C__31273665_10 for rs11583641, C__25937637_20 for rs1046934; Thermo Fisher Scientific). The PCR reaction system used TaqMan Universal PCR Master Mix (No AmpErase UNG, Applied Biosystems, Foster City, CA, USA) to perform amplification and end-point fluorescence reading on a real-time fluorescent quantitative PCR instrument. Genotype calling was performed automatically using the instrument’s genotyping analysis software. The genotyping call rate was 100% for both SNPs (all 460 samples successfully genotyped), and no missing genotypes were observed. For quality control, quality control was performed according to the manufacturer’s standard operating procedures, and no samples were excluded due to typing failure. Finally, the genotype of each sample was automatically determined by the genotyping analysis software supporting the instrument.
Quantitative Reverse Transcription Polymerase Chain Reaction (qRT-PCR)
The potential of blood-based biomarkers is well recognized.19 To explore whether COLGALT2 expression in peripheral blood reflects OA susceptibility and genetic regulation, we collected peripheral blood mononuclear cells (PBMC) samples from all 460 participants (230 OA patients and 230 healthy controls). PBMCs serve as a practical surrogate tissue because they are easily accessible, minimally invasive to obtain, and have been shown to capture systemic molecular signatures relevant to OA pathogenesis.20,21 Peripheral venous blood (EDTA anticoagulation) was collected from healthy controls and OA patients. PBMC were isolated by Ficoll density gradient centrifugation within 2 h after blood collection and washed twice with PBS and counted. RNA purity was confirmed by A260/A280 ratio. Subsequently, PBMC was immediately added to the lysis buffer containing denaturant TRIzol for full lysis and stored at −80°C for later use. Total RNA was extracted using TRIzol reagents (Invitrogen, Carlsbad, CA, USA) and DNase treatment was performed after extraction to remove genomic DNA contamination. Equal amounts of RNA (500 ng per sample) were reverse‑transcribed into cDNA using a reverse transcription kit (Thermo Fisher Scientific). The relative expression level of COLGALT2 mRNA was detected by SYBR Green real-time fluorescence quantitative PCR (Invitrogen). The Ct value was normalized by the internal reference gene GAPDH, and the relative expression was calculated by the 2−ΔΔCt method. Primer sequence details are shown in Table 1. The primer sequence was only used for SYBR Green-based qRT-PCR. All samples were repeated 3 times.
 |
Table 1 Primer Sequences Used for qRT-PCR (Gene Expression Analysis) |
Statistical Analysis
SPSS 22.0 was used for statistical analysis. Continuous variables were tested by t-test or Mann–Whitney U-test, and enumeration data were compared by chi-square test. One-way Analysis of Variance (ANOVA) test was used for comparison among multiple groups, and then Tukey‘s post hoc multiple tests were performed.22 The SHEsis online platform is used for the Hardy-Weinberg equilibrium (HWE) test to verify the representativeness of the sample. Logistic regression model was constructed to correct age, gender, body mass index (BMI), rs11583641, and rs1046934 as covariates, and odds ratio (OR) value and 95% confidence interval (CI) were calculated.23 Joint location (knee or hip OA) was not included as a covariate in the multivariate logistic regression analysis, as the primary aim was to evaluate the overall genetic association with OA susceptibility in the combined OA cohort. Bonferroni correction was applied for multiple comparisons in the following analyses: genotype and allele distributions, Hardy–Weinberg equilibrium (HWE) testing, and the associations of genotypes with disease duration, K‑L grade, and WOMAC score. After correction, the statistical significance threshold was set at P < 0.025 (0.05/2). For other analyses, including clinical characteristic comparisons, multivariate logistic regression analyses, and mRNA expression, a two-sided P < 0.05 was considered statistically significant.
Results
Comparison of Clinicopathological Data Between Patients and Control Group
The basic information of the control group and OA patients included in this study is shown in Table 2 below. The age of the two groups of subjects was compared by independent sample t test, and there was no statistical difference (P =0.66), indicating that the age matching was good. In addition, there was no significant difference in gender distribution and smoking ratio between the two groups (P > 0.05). However, the BMI of OA patients was significantly higher than that of healthy controls (P = 0.006). In the included OA patient group, the severity of clinical symptoms and structural damage was 51 points for the median (interquartile range) of the total WOMAC score; the average duration of the disease was 4.58 years. According to the K-L grading system, 130 of all OA patients were evaluated as mild to moderate (K-L2) by imaging, accounting for 56.52% of all patients. There were more patients with knee osteoarthritis included in this study, accounting for 67.83%.
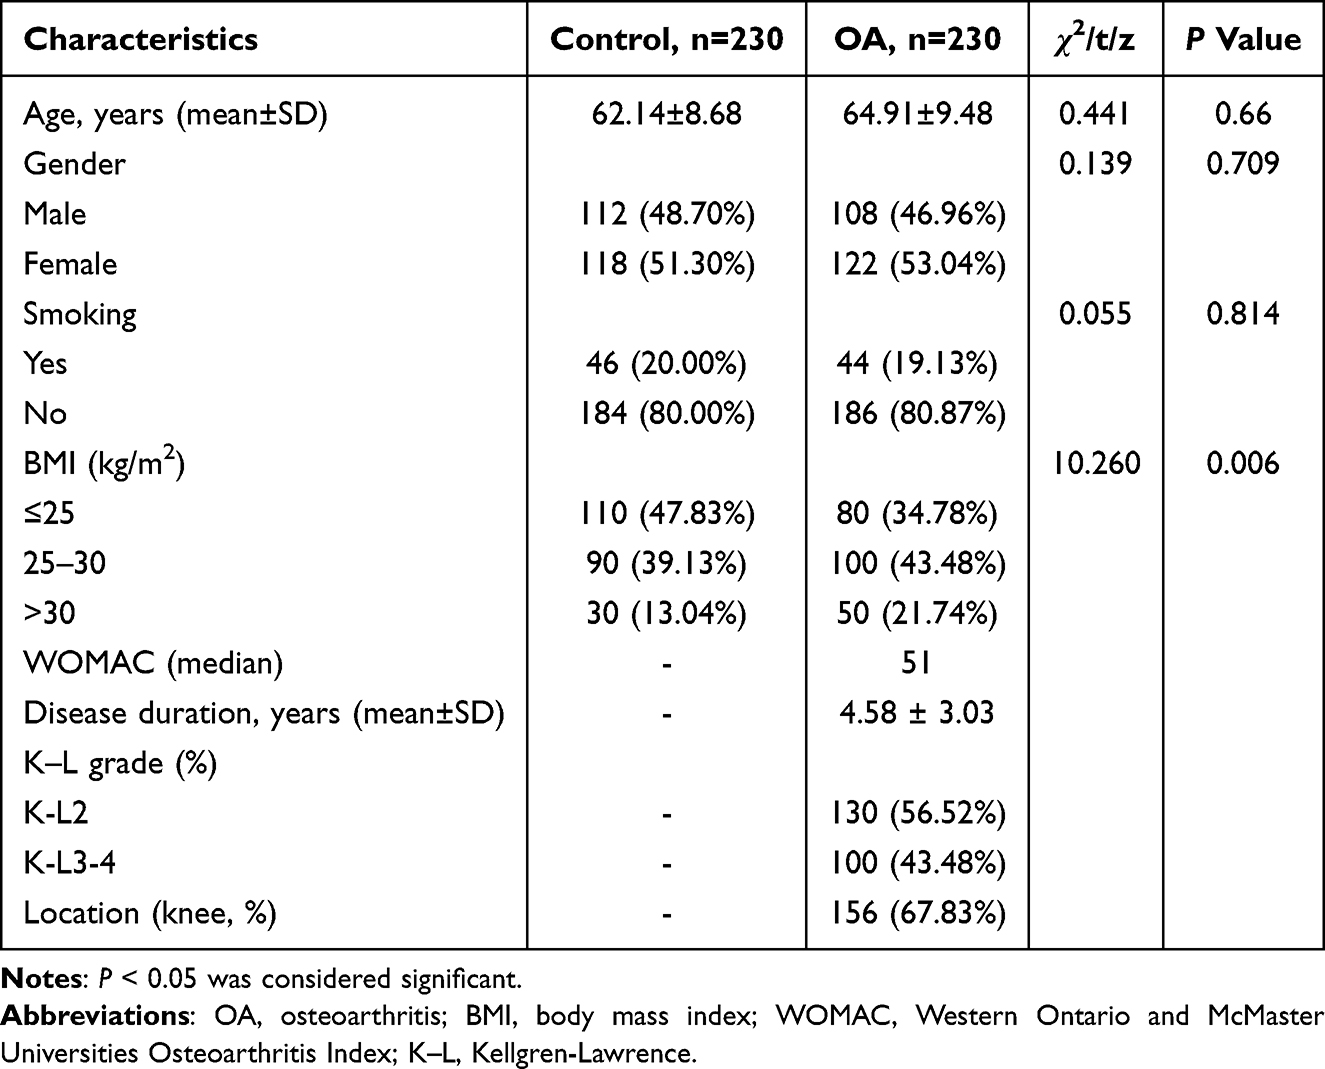 |
Table 2 Comparison of Clinical Data Between Control Group and OA Group |
HWE Analysis
The genotype distributions of the two polymorphic sites of COLGALT2 were assessed for HWE. As presented in Table 3, the P-values of the HWE test in the control group were all greater than 0.05 (P > 0.025), indicating that the controls are representative of the general population and that there were no significant genotyping errors or population stratifications. Additionally, the genotype distributions in the OA group also conformed to HWE (P > 0.025).
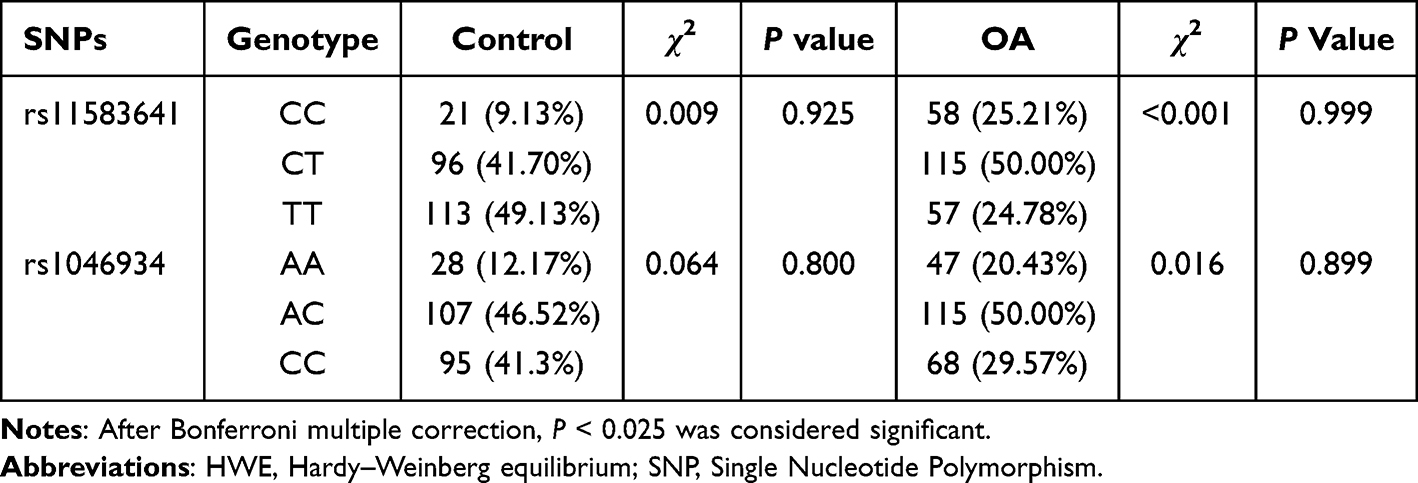 |
Table 3 HWE Analysis of SNP Genotype in Control Group and OA Group |
The Relationship Between COLGALT2 Gene Polymorphism and the Risk of OA
Next, we explored the relationship between these two polymorphisms and OA susceptibility (Figure 1 and Table 4). The genotype distribution of rs11583641 was significantly different between the OA group and the control group (P < 0.0001). Compared with the control group, the frequencies of CC and CT genotypes in the OA group increased by 16.08% and 8.30%, respectively, while the frequency of TT genotype decreased by 24.35%. The allele frequency analysis also showed a significant difference (P < 0.0001): the C allele frequency in the OA group was 20.22% higher than that in the control group, and the T allele frequency decreased by 20.22%. The above results suggest that the C allele is a risk allele for OA, which is consistent with previous studies.24
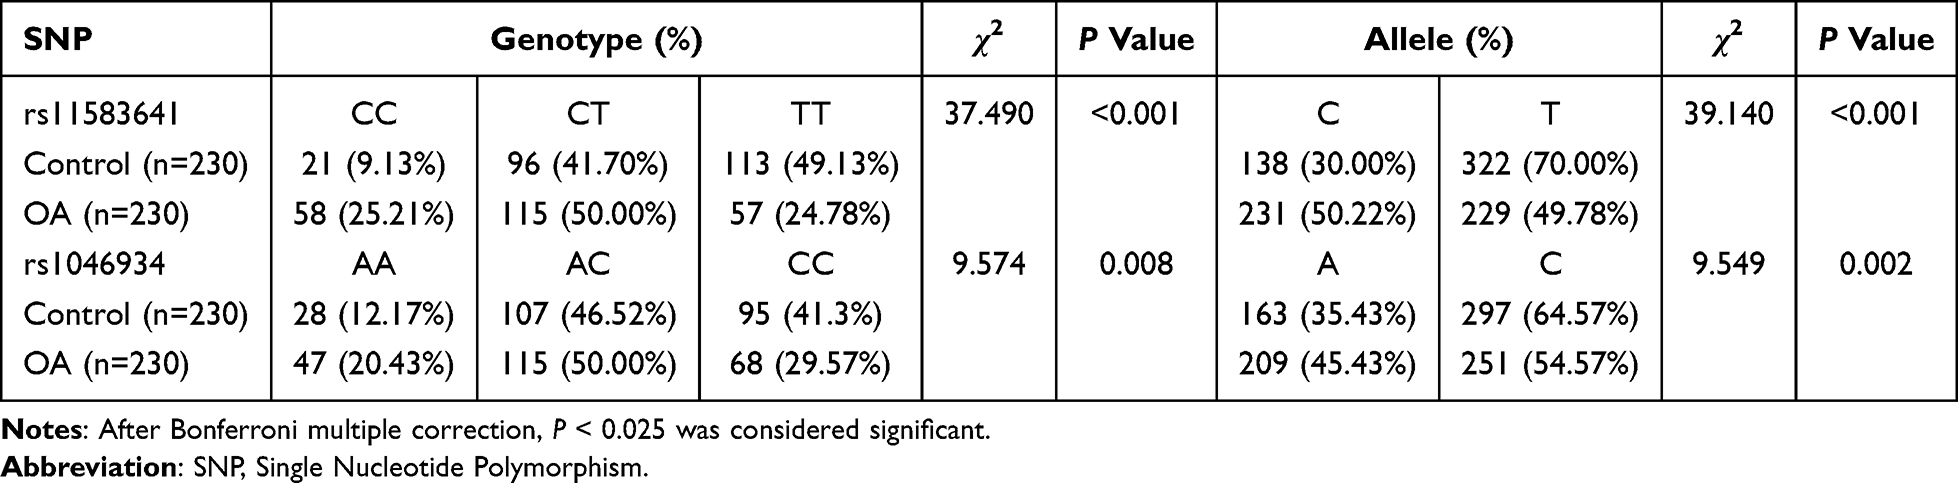 |
Table 4 Allele and Genotype Frequencies of COLGALT2 Gene SNP Loci |
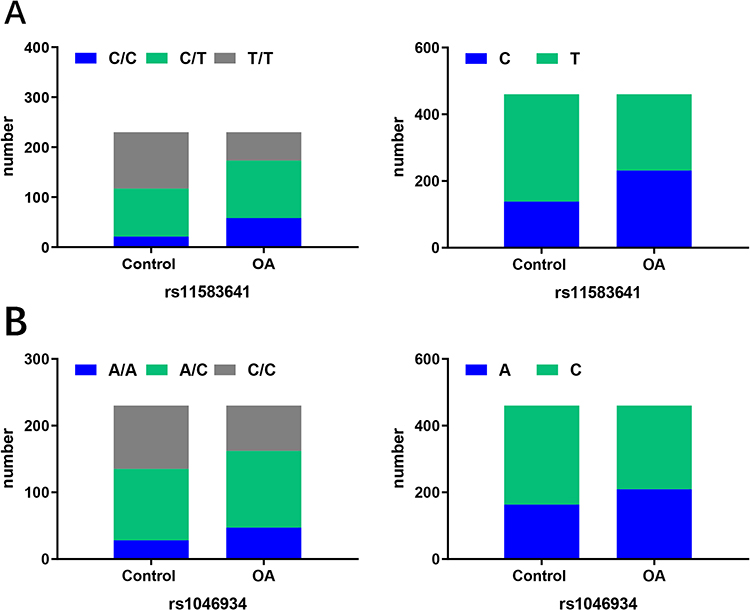 |
Figure 1 Distribution of genotypes and alleles in controls and OA. (A) Genotype (Left) and allele (Right) distribution of rs11583641. (B) Genotype (Left) and allele (Right) distribution of rs1046934. Abbreviation: OA, osteoarthritis. |
Subsequently, we analyzed another OA-related COLGALT2 locus rs1046934. The genotype distribution of this locus was also significantly different between the two groups (P = 0.008). Compared with the control group, the frequencies of AA and AC genotypes in the OA group increased by 8.26% and 3.48%, respectively, while the frequency of CC genotype decreased by 11.73%. Allele frequency analysis also showed significant differences (P < 0.025): OA group A allele frequency increased by 10.00%, C allele frequency decreased by 10.00%. This finding indicates that the polymorphisms of rs11583641 and rs1046934 are associated with the susceptibility of OA.
The Correlation Between COLGALT2 Polymorphism and the Disease Duration of OA
To explore the cross‑sectional association between genetic variation and disease duration, we divided OA patients into short duration (≤3 years) and long duration (> 3 years) groups based on the common clinical course threshold, and compared the genotype distribution of rs11583641 and rs1046934 loci between the two groups. As shown in Table 5, the genotype distribution of rs11583641 locus was significantly different between patients with short duration and long duration of disease (P = 0.006). Compared with the short duration group, the frequencies of CC and CT genotypes in the long duration group increased by 7.82% and 10.86%, respectively, while the frequency of TT genotype decreased by 5.65%.
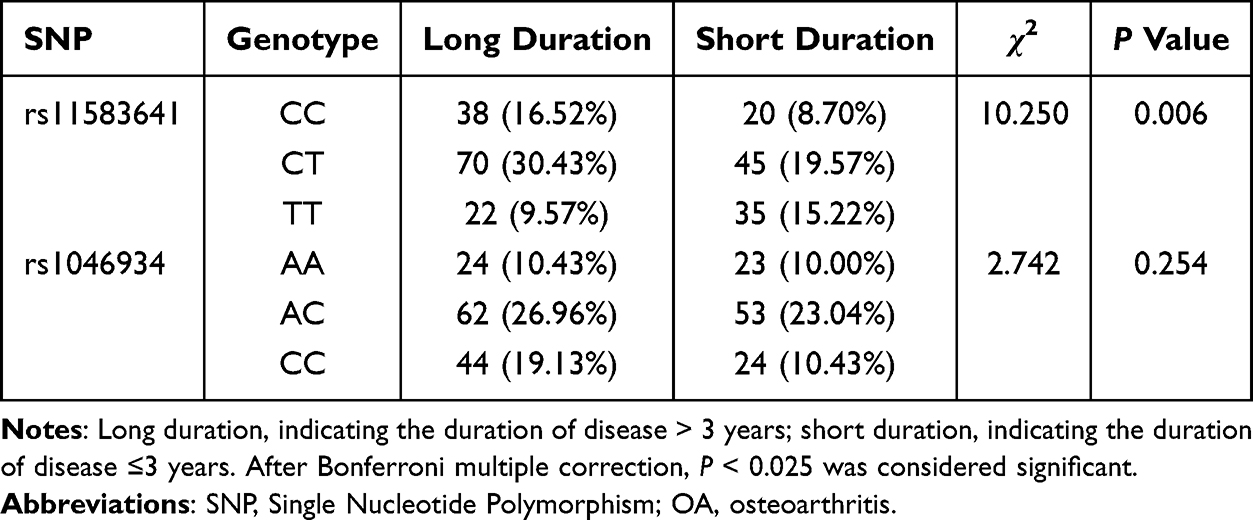 |
Table 5 Correlation Between Different Genotypes of COLGALT2 Gene SNP Locus and Duration of OA (n=230) |
For the rs1046934 locus, although the frequencies of AC and CC genotypes in the long duration group were 3.92% and 8.70% higher than those in the short duration group, the difference in genotype distribution between the two groups was not statistically significant (P = 0.254). These findings indicate that, in this cross‑sectional analysis, the rs11583641 polymorphism is associated with longer disease duration, whereas rs1046934 shows no significant association with disease duration.
The Correlation Between COLGALT2 Polymorphism and K–L Classification of OA
To explore the relationship between genetic variation and OA imaging severity, we divided OA patients into mild-moderate group (K-L2) and severe group (K-L3-4) according to Kellgren-Lawrence classification and compared the genotype distribution of rs11583641 and rs1046934 between the two groups. The results showed that the genotype distribution of rs11583641 was significantly different between the mild-moderate group and the severe group (P=0.0003). Compared with the severe group, the frequencies of CC and CT genotypes in the mild-moderate group increased by 7.82% and 6.52%, respectively, while the frequency of TT genotype decreased by 10%. The genotype distribution of rs1046934 was not statistically different between the two groups (P = 0.229). The frequencies of AC and CC genotypes increased in the severe group (2.18% and 5.22%). The detailed data are shown in Table 6. These results indicate that, in this cross‑sectional analysis, the rs11583641 polymorphism is associated with imaging severity (K‑L grade), whereas the rs1046934 polymorphism shows no significant association with severity grading in this cohort.
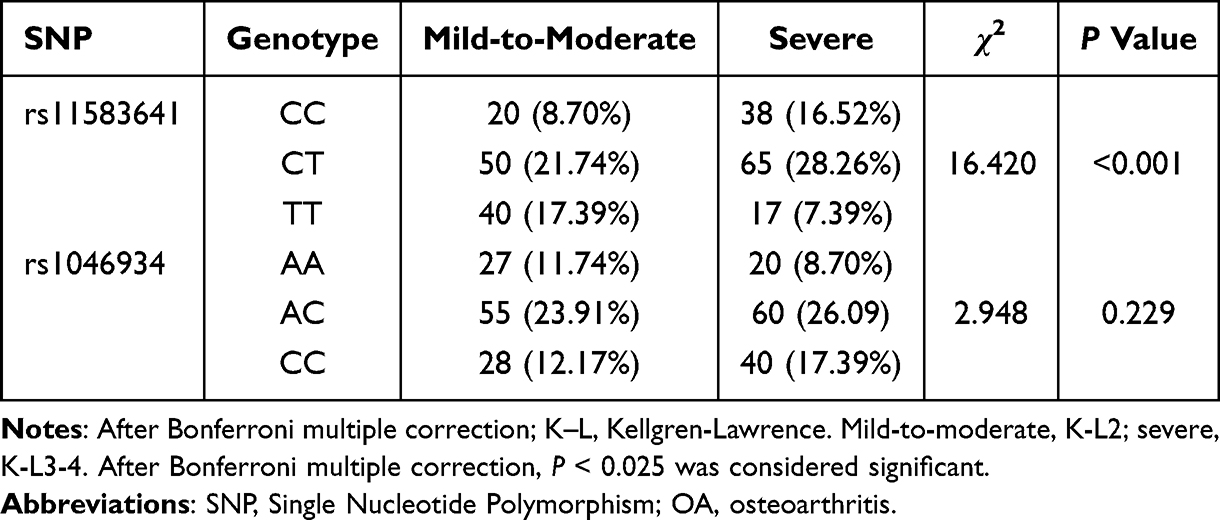 |
Table 6 Correlation Between Different Genotypes of COLGALT2 Gene SNP Loci and OA K-L Grade (n=230) |
The Correlation Between COLGALT2 Polymorphism and the Total Score of WOMAC in OA Patients
To evaluate the relationship between genetic variation and the severity of clinical symptoms, we analyzed the correlation between different genotypes of rs11583641 and rs1046934 and the total score of WOMAC in OA patients. The results showed that there were significant differences in WOMAC scores between different genotype groups of rs11583641 (P<0.025). Compared with patients with CC genotype, the total WOMAC scores of patients with CT or TT genotype were significantly lower (P < 0.001, Figure 2A). There was no significant difference in the total score of WOMAC between different genotypes of rs1046934 (P>0.025, Figure 2B). This suggests that these two polymorphisms in the COLGALT2 gene region are not only associated with OA susceptibility but also may affect the severity of clinical symptoms in patients.
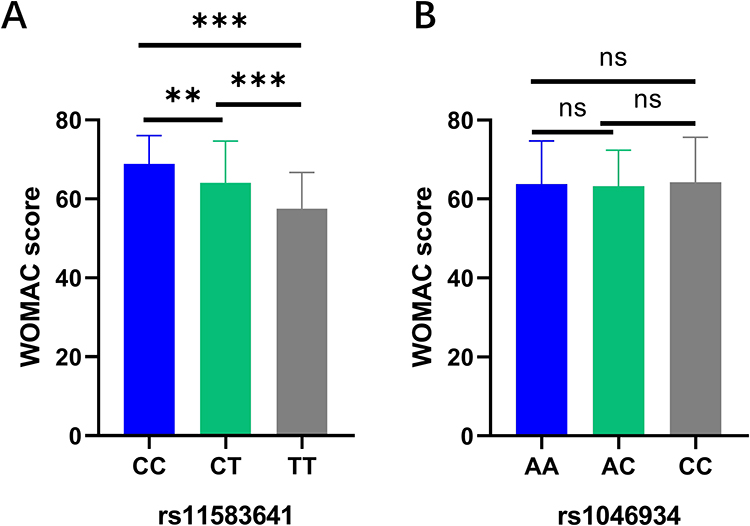 |
Figure 2 Correlation analysis between COLGALT2 gene polymorphism and WOMAC score in OA patients. (A) Correlation analysis between rs11583641 and WOMAC score in OA patients. (B) Correlation analysis between rs1046934 and WOMAC score in OA patients. Standard error of the mean. ns, represents no significantly difference, **P<0.01, ***P < 0.001. After Bonferroni multiple correction, P < 0.025 was considered significant. Abbreviations: COLGALT2, collagen beta(1-O) galactosyltransferase 2; WOMAC, Western Ontario and McMaster Universities Osteoarthritis Index. |
COLGALT2 Polymorphism is Independently Associated with OA
In order to further explore the factors independently associated with OA status, we conducted a multivariate logistic regression analysis, in which gender and BMI grouping were used as categorical variables, the dominant model coding variables of rs11583641 and rs1046934 were used as independent variables, and OA status was the dependent variable. In the dominant model, rs11583641 used TT as the reference and CC + CT as the exposure group. CC was used as a reference for rs1046934, and AA + AC was the exposure group. The reference BMI group was BMI ≤ 25. As shown in Figure 3 and Table 7, compared with the reference BMI group, the OA risk of BMI 25–30 was significantly increased (OR = 0.371, 95% CI: 0.193–0.711, P = 0.003), and the OA risk of BMI > 30 was also significantly increased (OR = 0.433, 95% CI: 0.245–0.764, P = 0.004). In terms of genetic factors, the dominant model of rs11583641 is significantly correlated with OA status (OR=0.347, 95% CI: 0.231–0.521, P < 0.001), indicating that individuals carrying at least one C allele have a 0.347 times higher risk of OA compared to TT homozygotes (ie., significantly reduced risk); Rs1046934 also showed independent correlation (OR=0.574, 95% CI: 0.382–0.861, P = 0.007), indicating that individuals carrying at least one A allele are 0.574 times more likely to develop OA compared to CC homozygotes (ie., significantly reduced risk). Gender and age did not show an independent association in this model (P > 0.05).
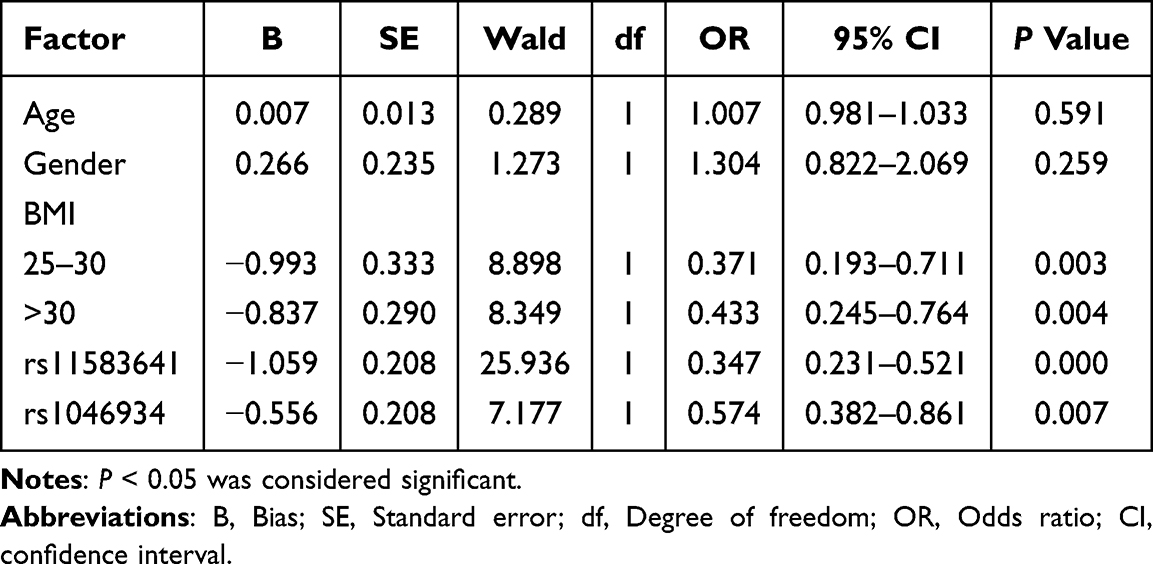 |
Table 7 Logistic Regression Analysis of Factors Independently Associated with OA |
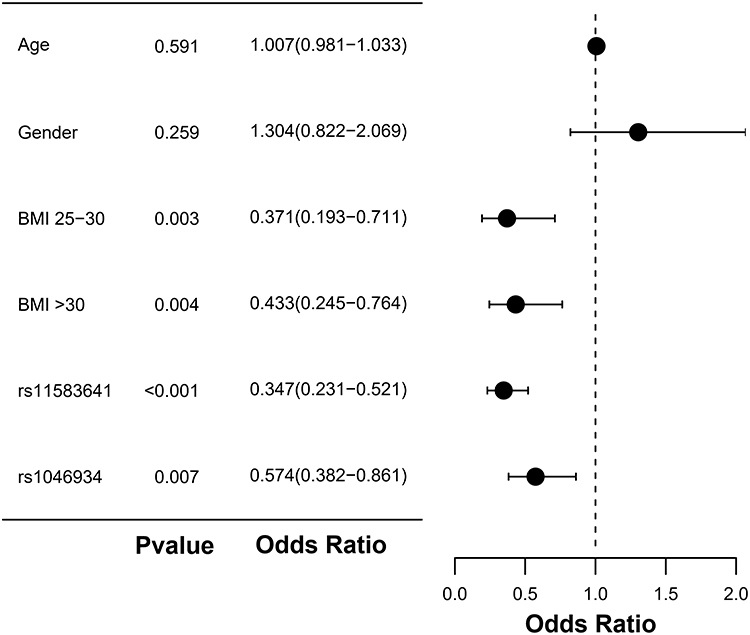 |
Figure 3 Forest map related to OA risk factors. P < 0.05 was considered significant. Abbreviation: BMI, body mass index. |
The Expression Level of COLGALT2 in PBMC is Associated with Osteoarthritis and Risk Genotypes
It has been reported that the expression of COLGALT2 can be detected in blood.25,26 Previous studies have shown that there is a substantial overlap between the PBMC gene expression profile in OA and the local joint pathological pathways, including inflammatory response, matrix remodeling, monocyte activation and immune aging-related changes, so it can be used as an accessible indicator of systemic and joint-related disease activity.27,28 In order to verify whether the expression level of COLGALT2 influences the pathogenesis of OA, we collected PBMC samples from patients and controls and performed qRT-PCR detection. COLGALT2 was highly expressed in OA group (Figure 4A, P < 0.001). At the rs11583641 locus, COLGALT2 expression levels were highest in CC genotype carriers, followed by CT genotype carriers (P < 0.001), with no significant difference observed between TT and CT genotype carriers (Figure 4B, P > 0.05). The same trend was observed at rs1046934 locus, that is, AA genotype carriers had the highest expression level, AC genotype was in the middle, and CC genotype was the lowest (Figure 4C, P < 0.001).
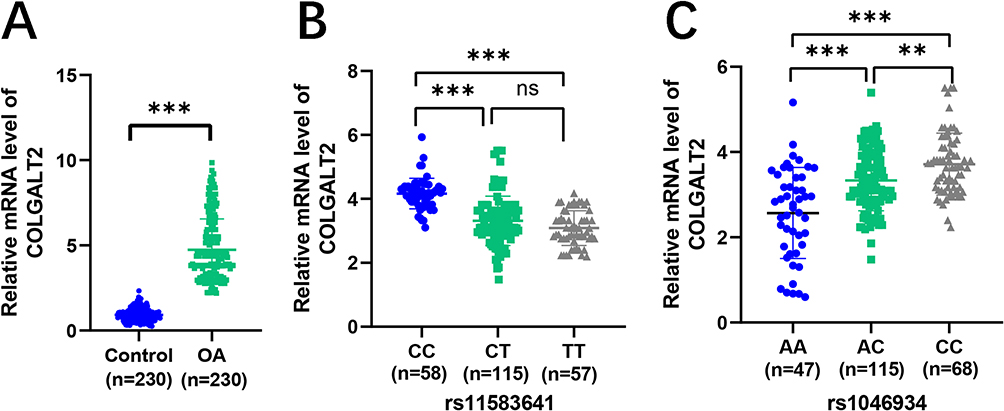 |
Figure 4 The expression level of COLGALT2 in PBMC was associated with OA and risk genotypes. (A) The expression of COLGALT2 in PBMC of healthy control group and OA group. (B) The expression of COLGALT2 in different genotype carriers of rs11583641 in PMBC of OA group. (C) The expression of COLGALT2 in different genotype carriers of rs1046934 in PMBC of OA group. Standard error of the mean. ns, represents no significantly difference, **P <0.01, ***P < 0.001. P < 0.05 was considered significant. Abbreviation: PMBC, peripheral blood mononuclear cells. |
Discussion
In this study, we systematically analyzed the association of two independent single nucleotide polymorphisms (rs11583641 and rs1046934) in the COLGALT2 gene region with OA risk, clinical manifestations, and disease duration in a Chinese population. We also examined its expression level in PBMC, which to our knowledge has not been previously reported in this population. Our results provide additional validation for previous studies and extend them by demonstrating a broader clinical phenotype spectrum associated with this genetic locus in the context of OA pathogenesis.
At the susceptibility level, the allele/genotype distribution of rs11583641 in OA group differed from that in healthy controls. After adjusting for age, sex and BMI by multivariate logistic regression, the related genotypes remained significantly associated with OA risk, which was consistent with Kehayova et al conclusion that rs11583641 was used as an OA risk signal and provided functional genetic evidence in the European population24 It should be noted that the associations observed in case-control studies may still be affected by unmeasured confounding (physical load, previous injury, metabolic status, etc.) or selection bias. Therefore, they should be interpreted as “cross-population replicable evidence of association” rather than direct evidence of causality.
Although it has not been reported that the A allele of rs1046934 is associated with OA risk, the A allele has been shown to be involved in the regulation of COLGALT2 expression, which supports its biological plausibility.16 In our study, the allele frequencies of A and C in the rs1046934 locus were also significantly higher in the OA group than in the healthy control group, and showed a certain independent effect in the regression model. This observation is consistent with the possibility that rs1046934 may be associated with OA susceptibility, or that rs1046934 is highly co-inherited with the true pathogenic variant on the genome, making it a risk signal in this study.29 Haplotype/condition analysis and other methods are still needed to further confirm the variation that truly drives the genetic association.30
It is worth noting that after controlling BMI stratification, the two loci remained significantly associated, indicating that the observed genetic effect of the COLGALT2 locus is not solely attributable to environmental risks such as obesity. The magnitude of association for rs11583641 was greater (OR=0.347), while the effect of rs1046934 was relatively mild (OR=0.574), suggesting that independent genetic signals within the same gene region may differ in their degree of contribution to OA susceptibility may be different. It should be emphasized that the regression model reveals a statistical association, and its robustness still needs to be verified in a larger sample and longitudinal cohort. Moreover, whether these variants directly influence COLGALT2 expression and the ECM remodeling pathway remains to be further clarified in combination with functional experiments.
At the phenotypic level, rs11583641 showed a stronger statistical association with K-L grade (K-L2 vs K-L3-4) and duration of disease, while rs1046934 was relatively weak. The statistical correlation is consistent with the possibility that rs11583641 is associated with longer disease duration and higher imaging severity, but it still needs to be verified by longitudinal follow-up: K-L mainly reflects the changes of imaging structure,31 the course of disease is easily affected by the time of treatment, symptom threshold and memory bias,32 and there is a structural-symptom mismatch in OA.33,34 In the future, structural progression rate (joint space narrowing, MRI structural score) and pain trajectory modeling should be combined in a prospective cohort to evaluate whether rs11583641 is associated with subsequent structural changes. We also observed that the two-locus genotype was associated with the total WOMAC score. When considered alongside the mechanism evidence from Kehayova et al in cartilage tissue, where rs11583641 risk allele (C) was reported to up-regulate COLGALT2 expression by reducing enhancer methylation, it is plausible that such an expression change might contribute to excessive collagen glycosylation and altered ECM mechanical properties, which in turn could correlate with more severe pain and dysfunction.16,24 However, it should be emphasized that the WOMAC association cannot directly prove that altered expression is the mediating mechanism for symptom aggravation, because symptoms are also influenced by multiple other pathways (eg., synovitis, bone marrow lesions, muscle strength, and psychological factors). Subsequent cell and animal experiments are therefore still needed to test these hypotheses.
This study observed that the expression of COLGALT2 mRNA in PBMC of OA patients was significantly up-regulated and associated with risk genotypes. At rs11583641, the risk-related CC genotype was the highest. At rs1046934, the risk-related AA genotype had the lowest performance. We speculate that the regulation of genetic risk on COLGALT2 may have a certain “systemic explicitness”, and peripheral blood can partially reflect the overall activation of ECM/repair-related pathways.35 At the same time, it is not excluded that the difference in peripheral blood is mainly driven by inflammatory status or changes in the proportion of white blood cell subsets, and COLGALT2 is only an accompanying signal.35 Previous studies have shown that peripheral blood gene expression profiles are associated with OA pain and progression and have certain predictive value,36 but also emphasize the need to control cell composition and inflammation.37 In addition, the opposite expression patterns of COLGALT2 between genotype carriers of rs11583641 and rs1046934 might reflect complex allele‑specific regulatory mechanisms within this gene region, but could also be related to the limited statistical power of the current sample size in subgroup analyses. Consequently, larger and more prospective cohorts are needed to further validate these findings, and functional experiments are required to elucidate the underlying molecular mechanisms.
Although Kehayova et al reported that rs11583641 regulates synovium in the opposite direction to cartilage,15 the pattern we observed in peripheral blood is closer to the cartilage effect. This observation may reflect a shared/dominant degeneration-repair transcription program, or could be attributable to difference in blood cell composition or disease stage.38 In view of the significant tissue/cell type specificity of genetic regulation and even the opposite direction effect,37,39–41 multi-tissue paired samples and single cell/deconvolution framework are still needed to further verify its tissue origin and pathological significance.
However, this study has many limitations. The sample size is modest, and the relatively small numbers in certain subgroups (eg., by K-L grade or disease duration) increase the risk of Type II errors, which may have masked weaker but potentially true associations. The cross-sectional cannot establish causality or infer disease progression, and expression analysis was limited to peripheral blood mRNA, lacking evidence from joint tissues or protein activity. In the future, the association should replicate in a larger, multicenter Chinese population cohort, and longitudinal studies are needed to assess whether rs11583641 is associated with imaging progression and joint replacement risk. We did not adjust for PBMC subset composition (eg., by flow cytometry or transcriptomic deconvolution) nor measure inflammatory markers such as C-reactive protein (CRP)/erythrocyte sedimentation rate (ESR). Therefore, the association between COLGALT2 expression and OA risk may be confounded. Future studies should incorporate cell‑type enumeration and inflammatory profiling. In addition, knee and hip OA cases were analyzed as a combined OA cohort, and joint location was not included as a covariate in the regression model, which may have introduced site-related heterogeneity. Finally, the potential utility of peripheral blood COLGALT2 as a circulating marker for OA diagnosis, classification, or efficacy monitoring remains to be systematically evaluated, and further mechanistic exploration will require cell and animal experiments.
Conclusion
In summary, this study replicated significant associations between polymorphisms of rs11583641 and rs1046934 in the COLGALT2 gene region and OA susceptibility in the Chinese population, thereby extending previous findings to an East Asian cohort. Further stratified analysis indicated that rs11583641 was also associated with longer disease duration, higher imaging severity (K-L grade) and heavier symptom burden (WOMAC), providing additional evidence for its potential involvement in disease heterogeneity. At the same time, we detected elevated COLGALT2 mRNA expression in PBMC, and its level was correlated with the dose of risk allele, which offers preliminary correlative evidence for the systematic reflection of genetic risk and hints at its possible non‑invasive biomarker value, pending validation in future studies. Collectively, these results provide additional population‑based validation for explaining the genetic heterogeneity and clinical phenotype spectrum of OA, and lay a foundation for subsequent validation, fine‑mapping and mechanistic studies in larger samples and longitudinal cohorts.
Data Sharing Statement
All the results are presented in the article. Further inquiries can be directed to the corresponding authors.
Ethics Statement
The research protocol was approved by the Ethics Committee of the First Affiliated Hospital of Bengbu Medical University (2023-41). All experiments and procedures were performed according to the Declaration of Helsinki (as revised in 2013).
Disclosure
The authors report no conflicts of interest in this work.
References
1. Arruda AL, Katsoula G, Chen S, Reimann E, Kreitmaier P, Zeggini E. The Genetics and Functional Genomics of Osteoarthritis. Ann Rev Genomics Hum Genet. 2024;25(1):239–13. doi:10.1146/annurev-genom-010423-095636
2. Davis S, Karali K, Zekonyte J, Roldo M, Blunn G. 3D full-field strain distribution across the osteochondral unit during osteoarthritis progression. View. 2025;6(6):20250062.
3. Khadembashiri MA, Khadembashiri MM, Khonji MS, et al. Burden of Osteoarthritis in Iran: a National and Subnational Perspective, 1990–2019 Global Burden of Disease Study. Health Sci Rep. 2025;8(5):e70829. doi:10.1002/hsr2.70829
4. Long H, Liu Q, Yin H, et al. Prevalence Trends of Site-Specific Osteoarthritis From 1990 to 2019: findings From the Global Burden of Disease Study 2019. Arthrit Rheumatol. 2022;74(7):1172–1183.
5. Shinde M, Pardeshi D, Patel M, et al. Grading of Knee Osteoarthritis Based on Kellgren-Lawrence Classification and Finding an Association Between Radiographic Features and Pain: a Cross-Sectional Study at a Tertiary Health Care Hospital. Cureus. 2024;16(11):e73224. doi:10.7759/cureus.73224
6. Boer CG, Hatzikotoulas K, Southam L, et al. Deciphering osteoarthritis genetics across 826,690 individuals from 9 populations. Cell. 2021;184(18):4784–4818. doi:10.1016/j.cell.2021.07.038
7. Zhai G, Huang J. Genetics of osteoarthritis. Best Pract Res. 2024;38(4):101972. doi:10.1016/j.berh.2024.101972
8. Hatzikotoulas K, Southam L, Stefansdottir L, et al. Translational genomics of osteoarthritis in 1,962,069 individuals. Nature. 2025;641(8065):1217–1224. doi:10.1038/s41586-025-08771-z
9. Tvaroška I. Glycosylation Modulates the Structure and Functions of Collagen: a Review. Molecules. 2024;29(7):1417. doi:10.3390/molecules29071417
10. Papathanasiou I, Mourmoura E, Balis C, Tsezou A. Impact of miR-SNP rs2910164 on miR-146a expression in osteoarthritic chondrocytes. Adv Med Sci. 2020;65(1):78–85. doi:10.1016/j.advms.2019.12.005
11. Wang X, Cai W, Liu Y, et al. Exploring biomarkers associated with severity of knee osteoarthritis in Southern China using widely targeted metabolomics. BMC Musculoskeletal Disord. 2023;24(1):953. doi:10.1186/s12891-023-07084-4
12. Yau MS, Yerges-Armstrong LM, Liu Y, et al. Genome-Wide Association Study of Radiographic Knee Osteoarthritis in North American Caucasians. Arthrit Rheumatol. 2017;69(2):343–351. doi:10.1002/art.39932
13. Tang H, Cheng Z, Ma W, et al. TLR10 and NFKBIA contributed to the risk of Hip osteoarthritis: systematic evaluation based on Han Chinese population. Sci Rep. 2018;8(1):10243. doi:10.1038/s41598-018-28597-2
14. Bellamy N, Buchanan WW, Goldsmith CH, Campbell J, Stitt LW. Validation study of WOMAC: a health status instrument for measuring clinically important patient relevant outcomes to antirheumatic drug therapy in patients with osteoarthritis of the Hip or knee. J Rheumatol. 1988;15(12):1833–1840.
15. Kehayova YS, Wilkinson JM, Rice SJ, Loughlin J. Osteoarthritis genetic risk acting on the galactosyltransferase gene COLGALT2 has opposing functional effects in articulating joint tissues. Arthritis Res Ther. 2023;25(1):83. doi:10.1186/s13075-023-03066-y
16. Kehayova YS, Wilkinson JM, Rice SJ, Loughlin J. Mediation of the Same Epigenetic and Transcriptional Effect by Independent Osteoarthritis Risk-Conferring Alleles on a Shared Target Gene, COLGALT2. Arthrit Rheumatol. 2023;75(6):910–922. doi:10.1002/art.42427
17. Kowalczyk M, Kowalczyk E, Galita G, et al. Association of Polymorphic Variants in Argonaute Genes with Depression Risk in a Polish Population. Int J Mol Sci. 2022;23(18):10586. doi:10.3390/ijms231810586
18. Cichocka E, Górczyńska-Kosiorz S, Misiołek M, et al. DIAPH2 gene polymorphisms and laryngeal cancer risk in men. J Cancer Res Clin Oncol. 2024;150(6):295. doi:10.1007/s00432-024-05820-4
19. Liu W, Hu X, Bao Z, et al. Serum metabolic fingerprints encode functional biomarkers for ovarian cancer diagnosis: a large-scale cohort study. EBioMedicine. 2025;115:105706. doi:10.1016/j.ebiom.2025.105706
20. Yu D, Ding W, Xue X, et al. A six-gene expression signature in peripheral blood mononuclear cells effectively diagnoses osteoarthritis. Front Med. 2025;12:1632348. doi:10.3389/fmed.2025.1632348
21. Tu B, Fang R, Lu P, et al. Multi-omic profiling reveals age-specific blood biomarkers and aging-driven B cell remodeling in osteoarthritis. Int J Surg. 2025;111(11):7814–7828. doi:10.1097/JS9.0000000000003076
22. Yu B, Yang M, Yu J, et al. The effectiveness and safety of azvudine treatment in COVID-19 patients with kidney disease based on a multicenter retrospective cohort study. View. 2025;6(3):20240075.
23. Sun J, Yang M, Yao D, et al. Antiviral effectiveness and safety of azvudine in hospitalized SARS-CoV-2 patients with pre-existing chronic respiratory diseases: a multicenter, retrospective cohort study. View. 2025;6(2):20240133.
24. Kehayova YS, Watson E, Wilkinson JM, Loughlin J, Rice SJ. Genetic and Epigenetic Interplay Within a COLGALT2 Enhancer Associated With Osteoarthritis. Arthrit Rheumatol. 2021;73(10):1856–1865. doi:10.1002/art.41738
25. Xu Y, Xu Q, Yang L, et al. Identification and validation of a blood-based 18-gene expression signature in colorectal cancer. Clin Cancer Res. 2013;19(11):3039–3049. doi:10.1158/1078-0432.CCR-12-3851
26. Zhu X, Zou Y, Jia L, et al. Using multi-tissue transcriptome-wide association study to identify candidate susceptibility genes for respiratory infectious diseases. Front Genetics. 2023;14:1164274. doi:10.3389/fgene.2023.1164274
27. Shi T, Shen X, Gao G. Gene Expression Profiles of Peripheral Blood Monocytes in Osteoarthritis and Analysis of Differentially Expressed Genes. Biomed Res Int. 2019;2019:4291689. doi:10.1155/2019/4291689
28. Luo S, Shi Q, Chen J, Wang H, Wu W, Zha Z. Expression and Significance of MMPs in Synovial Fluid, Serum and PBMC Culture Supernatant Stimulated by LPS in Osteoarthritis Patients With or Without Diabetes. Experiment Clin Eendocrinol Diabet. 2019;127(4):195–202. doi:10.1055/s-0043-122223
29. Schaid DJ, Chen W, Larson NB. From genome-wide associations to candidate causal variants by statistical fine-mapping. Nat Rev Genet. 2018;19(8):491–504. doi:10.1038/s41576-018-0016-z
30. Wang J, Tiezzi F, Huang Y, et al. Fine-mapping methods for complex traits: essential adaptations for samples of related individuals. Briefings Bioinf. 2025;26(6). doi:10.1093/bib/bbaf614.
31. Kellgren JH, Lawrence JS. Radiological assessment of osteo-arthrosis. Ann Rheumatic Dis. 1957;16(4):494–502. doi:10.1136/ard.16.4.494
32. Previtali D, Boffa A, Di Martino A, Deabate L, Delcogliano M, Filardo G. Recall Bias Affects Pain Assessment in Knee Osteoarthritis: a Pilot Study. Cartilage. 2022;13(4):50–58. doi:10.1177/19476035221118417
33. Steenkamp W, Rachuene PA, Dey R, Mzayiya NL, Ramasuvha BE. The correlation between clinical and radiological severity of osteoarthritis of the knee. Sicot J. 2022;8:14. doi:10.1051/sicotj/2022014
34. Finan PH, Buenaver LF, Bounds SC, et al. Discordance between pain and radiographic severity in knee osteoarthritis: findings from quantitative sensory testing of central sensitization. Arthritis Rheum. 2013;65(2):363–372. doi:10.1002/art.34646
35. Aguet F, Anand S, Ardlie KG. The GTEx Consortium atlas of genetic regulatory effects across human tissues. Science. 2020;369(6509):1318–1330. doi:10.1126/science.aaz1776
36. Attur M, Krasnokutsky S, Zhou H, et al. The combination of an inflammatory peripheral blood gene expression and imaging biomarkers enhance prediction of radiographic progression in knee osteoarthritis. Arthritis Res Ther. 2020;22(1):208. doi:10.1186/s13075-020-02298-6
37. O’Connell GC, Wang J, Smothers C. Donor white blood cell differential is the single largest determinant of whole blood gene expression patterns. Genomics. 2023;115(6):110708. doi:10.1016/j.ygeno.2023.110708
38. Korostyński M, Małek N, Piechota M, Starowicz K. Blood Transcriptional Signatures for Disease Progression in a Rat Model of Osteoarthritis. Int J Genom. 2017;2017:1746426. doi:10.1155/2017/1746426
39. Mizuno A, Okada Y. Biological characterization of expression quantitative trait loci (eQTLs) showing tissue-specific opposite directional effects. Eur J Human Genet. 2019;27(11):1745–1756. doi:10.1038/s41431-019-0468-4
40. Basu M, Wang K, Ruppin E, Hannenhalli S. Predicting tissue-specific gene expression from whole blood transcriptome. Sci Adv. 2021;7(14). doi:10.1126/sciadv.abd6991
41. Newman AM, Steen CB, Liu CL, et al. Determining cell type abundance and expression from bulk tissues with digital cytometry. Nature Biotechnol. 2019;37(7):773–782. doi:10.1038/s41587-019-0114-2
 © 2026 The Author(s). This work is published and licensed by Dove Medical Press Limited. The
full terms of this license are available at https://www.dovepress.com/terms
and incorporate the Creative Commons Attribution
- Non Commercial (unported, 4.0) License.
By accessing the work you hereby accept the Terms. Non-commercial uses of the work are permitted
without any further permission from Dove Medical Press Limited, provided the work is properly
attributed. For permission for commercial use of this work, please see paragraphs 4.2 and 5 of our Terms.
© 2026 The Author(s). This work is published and licensed by Dove Medical Press Limited. The
full terms of this license are available at https://www.dovepress.com/terms
and incorporate the Creative Commons Attribution
- Non Commercial (unported, 4.0) License.
By accessing the work you hereby accept the Terms. Non-commercial uses of the work are permitted
without any further permission from Dove Medical Press Limited, provided the work is properly
attributed. For permission for commercial use of this work, please see paragraphs 4.2 and 5 of our Terms.
Recommended articles
Network Analysis of Osteoarthritis Progression Using a Steiner Minimal Tree Algorithm
Xie Y, Shao F, Ji Y, Feng D, Wang L, Huang Z, Wu S, Sun F, Jiang H, Miyamoto A, Wang H, Zhang C
Journal of Inflammation Research 2024, 17:3201-3209
Published Date: 18 May 2024