Back to Journals » Neuropsychiatric Disease and Treatment » Volume 19
CNN for a Regression Machine Learning Algorithm for Predicting Cognitive Impairment Using qEEG
Authors Simfukwe C ![]() , Youn YC
, Youn YC ![]() , Kim MJ, Paik J, Han SH
, Kim MJ, Paik J, Han SH
Received 27 January 2023
Accepted for publication 5 April 2023
Published 12 April 2023 Volume 2023:19 Pages 851—863
DOI https://doi.org/10.2147/NDT.S404528
Checked for plagiarism Yes
Review by Single anonymous peer review
Peer reviewer comments 2
Editor who approved publication: Professor Taro Kishi
Chanda Simfukwe,1 Young Chul Youn,1 Min-Jae Kim,2 Joonki Paik,2 Su-Hyun Han1
1Department of Neurology, Chung-Ang University College of Medicine, Seoul, South Korea; 2Department of Image, Chung-Ang University, Seoul, South Korea
Correspondence: Young Chul Youn; Su-Hyun Han, Department of Neurology, Chung-Ang University Hospital, Seoul, Republic of Korea, Email [email protected]; [email protected]
Purpose: Electroencephalogram (EEG) signals give detailed information on the electrical brain activities occurring in the cerebral cortex. They are used to study brain-related disorders such as mild cognitive impairment (MCI) and Alzheimer’s disease (AD). Brain signals obtained using an EEG machine can be a neurophysiological biomarker for early diagnosis of dementia through quantitative EEG (qEEG) analysis. This paper proposes a machine learning methodology to detect MCI and AD from qEEG time-frequency (TF) images of the subjects in an eyes-closed resting state (ECR).
Participants and Methods: The dataset consisted of 16,910 TF images from 890 subjects: 269 healthy controls (HC), 356 MCI, and 265 AD. First, EEG signals were transformed into TF images using a Fast Fourier Transform (FFT) containing different event-rated changes of frequency sub-bands preprocessed from the EEGlab toolbox in the MATLAB R2021a environment software. The preprocessed TF images were applied in a convolutional neural network (CNN) with adjusted parameters. For classification, the computed image features were concatenated with age data and went through the feed-forward neural network (FNN).
Results: The trained models’, HC vs MCI, HC vs AD, and HC vs CASE (MCI + AD), performance metrics were evaluated based on the test dataset of the subjects. The accuracy, sensitivity, and specificity were evaluated: HC vs MCI was 83%, 93%, and 73%, HC vs AD was 81%, 80%, and 83%, and HC vs CASE (MCI + AD) was 88%, 80%, and 90%, respectively.
Conclusion: The proposed models trained with TF images and age can be used to assist clinicians as a biomarker in detecting cognitively impaired subjects at an early stage in clinical sectors.
Keywords: neurodegenerative diseases, electroencephalography, supervised machine learning, regression analysis
Corrigendum for this paper has been published.
Introduction
Electroencephalogram (EEG) is considered a biomarker in the early detection and classification of Alzheimer’s disease (AD), mild cognitive impairment (MCI), and dementia.1,2 Dementia is most frequently caused by AD, differentiated by progressive and severe memory loss with cognitive impairment. The neurofibrillary tangles, senile plaques, and extensive loss of neuronal cells in the hippocampus are its distinguishing features. The fibrillary tangles are composed of aberrant hyperphosphorylated insoluble forms of total tau (t-tau) and phospho-tau (p-tau) in cerebrospinal fluid (CSF). Whereas, the senile plaques are composed primarily of amyloid β (Aβ) peptides.3 The global prevalence of AD is anticipated to double over the next 20 years due to increased life expectancy in most populations.4 MCI is a stage of cognitive degeneration that falls between the expected decline of normal aging and the severe deterioration of dementia yet does not affect daily activities.5 Dementia, on the other hand, is characterized by a progressive cognitive decline that might impair one’s capacity to operate independently in daily tasks.6
Neuroimaging plays a significant role in early AD detection, allowing health-care professionals to prevent misdiagnosis, improve overall disease management, and provide quicker and more effective options for treatment.7 Although these advanced imaging methods, such as positron emission tomography (PET) and magnetic resonance imaging (MRI), are broad, they still suffer from several disadvantages, such as high cost, time-consuming, immobility, and radiation hazards.8 Likely, EEG can play an essential part in accomplishing these needs and aid in AD diagnosis.9
The EEG analysis has traditionally been employed in therapeutic settings to assess a variety of illnesses, including emotion recognition, epilepsy, sleep disorders, and strokes.10,11 In addition, EEG can be used to diagnose dementia using visual and statistical techniques.9 Henderson et al12 applied EEG to detect dementia presence early with excellent sensitivity and specificity. The EEG signal can be divided into five frequencies (alpha, beta, delta, theta, and gamma), typically between 10 µv and 100 µv with a frequency range of 1 to 100 Hz.13 Patients with MCI and dementia sometimes exhibit anomalies in their EEG signals, such as slowing of the signals that are accompanied by a decrease in power frequencies of the alpha and beta bands of 8–30 Hz and an increase in the power frequencies of the delta and theta bands of 0.5–8 Hz.14
One approach to analyzing the EEG is using quantitative EEG (qEEG), which is the numerical analysis of the EEG data color-coded for a single summary page. The qEEG helps neurologists summarize EEG data more effectively than conventional EEG data.15 Several studies have revealed a distinctive qEEG pattern in AD patients, with notable changes found in the alpha, theta, and delta frequency band values.16,17 Particularly, delta/theta amplitudes are increased, whereas alpha amplitudes are significantly reduced.16 One type of qEEG marker is frequency domain analysis, performed by Fast Fourier Transform (FFT) spectral analysis and time analysis,18,19 and a promising marker of disease state in patients with AD.20 The FFT-based spectral analysis estimates the average amplitude and power of the EEG oscillations in various frequency bands over a predetermined recording period. Additionally, qEEG is reasonably affordable with good spatial and temporal resolution21 and it provides consistent and measurable data that can be used in associative and correlative research.22 Jelic et al23 and Luckhaus et al24 showed in a qEEG study that the best indicators of future cognitive decline in MCI subjects are a combination of alpha and theta power. Although qEEG can detect AD, it has low anatomical specificity25 and poor performance in analysis for AD diagnosis. However, artificial intelligence (AI) analysis of qEED has the ability to evaluate signals with greater complexity and depth.
The branch of AI known as machine learning (ML) has been successfully implemented in medical research and used to predict the conversion of MCI-to-AD,26,27 as with most studies for early diagnosis of MCI and other types of dementia only, EEG was used as a biomarker focus on a group study.28 The goal of ML algorithms is to obtain elements of the data that are not visible using traditional statistical analysis techniques. This mimics the learning process of the human brain. Consequently, millions of learnable parameters, particularly helpful in image classification issues, are built to detect perturbation features. In classification problems like convolutional neural network (CNN) ImageNet, these algorithms produce better results than human performance.29 Several EEG analyses can produce graphical outputs that can be fed directly into these ML networks.
This study proposes a CNN regression algorithm that inputs mixed data trained with learnable parameters of CNN and feed-forward neural networks (FNN) that learn the relationships between the mixed variables, which serve as inputs to the network, and dependent variables designed as network outputs.30
This study aims to develop an ML algorithm to help screen MCI and AD patients. Our research focuses on EEG recordings in subjects’ eyes-closed resting state (ECR) that were converted into usable input images for an ML network. The algorithm consists of the CNN model concatenated with age that is connected to an FNN as an output layer to classify healthy controls (HC), MCI, and AD. The CNN model has qEEG images as the input dataset, whereas the FNN was a regression model input with mixed data, computed image features, and age, and the diagnosis prediction is the network output prediction (Figure 1). We evaluated the models’ performances using the performance metrics, confusion matrices, and receiver operating characteristic curve (ROC).31,32
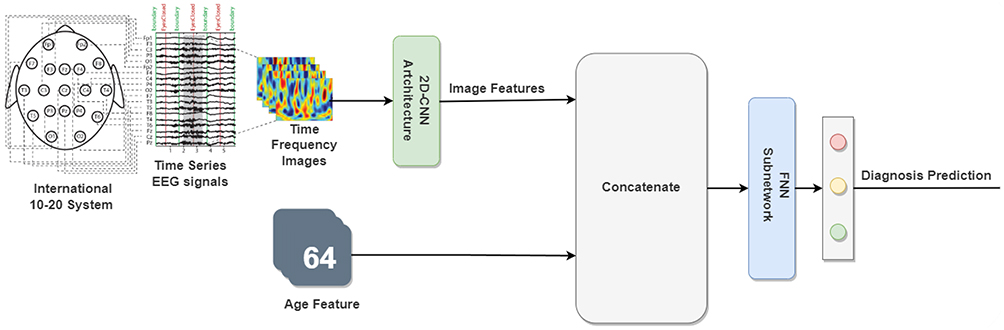 |
Figure 1 Study framework. Abbreviations: CNN, convolutional neural network; FNN, feed-forward neural network. Notes: Boundary indicates the break event of portions of the data that have been deleted. The shaded part is an epoch or event of interest during our study. |
Methods
Demographics of the Participants
The EEG signals of 890 subjects consisting of HC (n = 269), MCI (n = 356), and AD (n = 265) with an age of 64.54±9.03, 73.95±7.77, and 76.94±8.03, respectively (mean ± standard deviation, here and throughout) (Figure 2). The dataset was collected upon approval from the Chung-Ang University Hospital (IRB No. C2012049) under ethics committee approval (Number 1792-012-300). Originally, a cohort research study was conducted at a hospital to determine the prevalence of cognitive impairments and associated risk factors among the elderly.
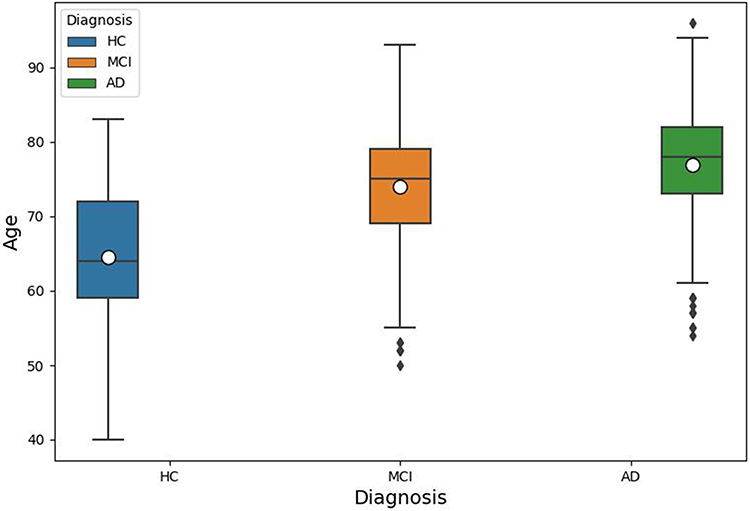 |
Figure 2 Demographics of age in different diagnosis groups. Abbreviations: HC, healthy controls; MCI, mild cognitive impairment; AD, Alzheimer’s disease. Note: Data are shown as mean ± standard deviation. |
The selection criteria of the MCI subjects were grouped according to the following criteria suggested by Peterson et al:33 1) patient and caregiver subjective memory complaints; 2) normal general cognitive function, as determined by scores on the Mini-Mental State Examination (MMSE) that are more than or equal to −1.0 standard deviation (SD) of the norms for age and educational level matched normal subjects; 3) the capacity to engage in daily activities of living as determined by a clinical assessment and activities of daily living scale; 4) objective memory decline on neuropsychological tests less than −1.0 SD; and 5) failure to meet the clinical standards for dementia diagnosis.
The diagnosing criteria for AD subjects included clinical recognition of a progressive decline in memory, a decline in the patient’s capacity for performing activities of daily living, personality change, and objective verbal memory on the Seoul Neuropsychological Screening Battery (SNSB). The SNSB is a thorough evaluation of cognitive abilities including memory, attention, language, associated process, and visuospatial function.34
The HC were subjects who performed their daily activities normally and had normality in global cognitive function with memory decline less than 1.0 SD below the normative mean on neuropsychological tests. All diagnoses were performed by a well-trained neurologist. Participants with acute mental problems, such as depression, neurological conditions like epilepsy, and psychiatric disorders like schizophrenia were excluded from the study. The subjects’ EEG data were preprocessed using the EEGlab tool in the MATLAB environment for artifacts removal.
EEG Recordings and Preprocessing
The EEG signals of all subjects were acquired using gold-cup EEG electrodes with a digital electroencephalograph (Comet AS40 amplifier EEG GRASS; Telefactor, USA), electrodes were placed according to the international 10–20 electrode placement standard (19 electrodes total: Fp1, Fp2, F7, F3, Fz, F4, F8, T3, C3, Cz, C4, T4, T5, P3, Pz, P4, T6, O1, and O2). All electrodes were referred to connected ear reference (Supplementary Figure 1).35,36 Electrode skin impedance was consistently less than 5 kΩ. The EEG signal was digitally recorded and saved on magnetic disks after being filtered with a bandpass of 0.5–70 Hz.
Participants were informed before recording whether to keep eyes-opened and -closed upon seeing the flashing light signal. At frequency of 200 Hz, the EEG was sampled 10 times with eyes-open for 30 seconds and eyes-closed for 30 seconds. About 3 minutes of the data collected during these were used. A total of 45 epochs, each lasting four seconds, were analyzed. The measured data for eyes-open and eyes-closed were converted based on the connected ear reference and saved in a text format without artifacts removal.
The participants were instructed to maintain a still, comfortable position in a quiet room and avoid making any physical movements (eg, swallowing, eyes blinking). The EEG signals were preprocessed on the MATLAB version R2021a environment software (https://kr.mathworks.com/) using the EEGlab version 2010 toolbox (https://sccn.ucsd.edu/eeglab/index.php) by applying FFT to obtain qEEG time-frequency (TF) images with a dimension of 875×656 for ECR with sub-bands (delta [1–4 Hz], theta [4–8 Hz], alpha [8–12 Hz], beta [12–30 Hz], and gamma [30–45 Hz]) from each EEG channel and TF images colormap was normalized in the range of [−20 20] dB. EEGlab is an interactive MATLAB toolkit for analyzing continuous and event-related EEG signals as well as other electrophysiological data. TF images or event-related spectral perturbation data are typically shown in 2D images, where the color of the pixels represents power fluctuations at various TF points in dB.37 The event-related perturbation analyzes the average dynamic amplitude changes in the broadband EEG frequency spectrum as a function of time in relation to an experimental event.38
Generally, preprocessing of raw EEG signals involves amplification, signal filtering, artifact removal, and independent component analysis (ICA).39 Figure 3 shows the general block diagram of the EEG signals preprocessing steps used in this study to obtain TF images.
 |
Figure 3 Block diagram of the EEG signals preprocessing and artifact removal. Abbreviations: EEG, electroencephalogram; ECR, eyes-closed resting state; CAR, common average reference; ASR, Artifact subspace reconstruction; ICA, independent component analysis. |
Proposed CNN for a Regression ML Algorithm
The essential parameters of CNN and regression models include convolutional layers, average pooling, relu activation, hidden layers, and FNN.40 Generally, as the network gets deeper, the neural network typically learns better.41 However, this may encourage the model to overfit during training. Therefore, we carefully designed a neural network architecture that required few parameters. After the training phase, the highest classification performance was calculated based on the test data.
The designed algorithm for this study convolved multiple inputs using Keras functional API (https://keras.io/guides/functional_api/). The output layer was connected as a FNN model by concatenating the CNN model with age. The CNN model took images compressed in an array of objects as the input data in a 3D array (height, width, depth) connected to a lambda layer (https://keras.io/api/layers/core_layers/lambda/) with a “preprocess_input” function from Keras applications MobileNet in Keras Tensorflow (https://keras.io/api/applications/mobilenet/). MobileNet is an efficient portable CNN architecture that builds lighter models. In contrast, the FNN model took computed image features and numeric data as input data, and predictions as the output data with different neurons and “relu” activation. The feature map in the CNN model was reduced using the global average pooling layer connected to denser layers with “relu” activation. The output layers for the CNN were concatenated with age and then connected to a FNN subnetwork with “sigmoid” activation for a classification task where the output predicted the outcomes (Figure 4).
 |
Figure 4 Proposed convolutional neural network (CNN) for a regression architecture. Abbreviations: CNN, convolutional neural network; EEG, electroencephalogram; TF, time-frequency. Notes: Image data were time-frequency images; image features were computed from CNN model. Age was numeric data; age features were computed from regression model. |
Model Training and Statistical Analyses
In the first step, subjects were categorized into three groups: HC, MCI, and AD, based on neuropsychological examination and criteria performed by a neurologist. The TF images and age were collected from all subjects. The dataset for ML was collected in “.CSV” format with three features: path to the images, age, and diagnosis. The path to the images was the directory of the TF images for each subject, age was the ages of the subjects, and the diagnosis was the target for our prediction, categorized as HC, MCI, and AD.
The second step involved compressing TF images, age, and diagnosis into “.npz” format stored as an array of objects using a function “asarray” from the NumPy library (https://numpy.org/). The NPZ is a zip file containing multiple “.npy” files, and NumPy is the primary array programming library for the Python language.
The dataset was prepared for binary classification models: HC vs MCI, HC vs AD, and HC vs CASE (MCI + AD). The HC vs MCI groups distinguished MCI from HC subjects with the first model. HC vs AD was analyzed as a dataset with the second model to distinguish AD among subjects. The HC vs CASE was analyzed as the third model, where the CASE class was made up of MCI combined with AD samples to assess the ability to distinguish between sick and healthy subjects.
The third step was splitting the data and training with an artificial neural network on the Google Colab cloud platform (https://colab.research.google.com/). We imported the images, age, and diagnosis data from each subject as an array of objects in the “.npy” format uncompressed from the “.npz” file. The dataset was randomly shuffled into training and validation. The validation dataset contained 30% of the data, while the train size was 0.70, indicating that 70% of the data from the training set had been withheld. The training dataset was applied for further model training in Keras Tensorflow (https://www.tensorflow.org/) utilizing CNN and regression algorithms.
After model training, the Tensorflow library was used to load the model with the “load_model” function. Then the test dataset was applied to the loaded model to predict the subject’s diagnosis. This trained model consisted of two architectures: CNN and regression. The architecture consisted of 17 layers. The CNN architecture had a global average-pooling layer, and a dropout rate of 0.2 was inserted on the MobileNet architecture before connecting it to the FNN, and “relu” activation was applied to all dense layers (Figure 4).
The FNN architecture was computed with image features and age as independent variables and diagnosis as a dependent variable. Neurons of 10–128 were connected to both architectures to improve accuracy, and cost was minimized with the “Adam” optimizer method with a learning rate of 0.01. A batch size of 19 with 100 epochs was applied to model training.
The fourth step involved calculating the model’s performance by computing common statistical metrics like recall, precision, F-measure, sensitivity, specificity, accuracy, and area under the ROC curve using Microsoft Excel version 2302 (Microsoft Corporation Chicago, IL, USA) and SPSS version 29 (IBM Corporation, Armonk, NY, USA).
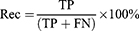
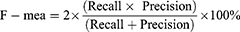
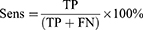
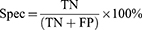
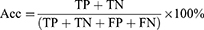
Where True Positive (TP): number of MCI or AD samples classified correctly by the algorithm as MCI or AD; False Positive (FP): number of HC samples classified incorrectly by the algorithm as MCI or AD; True Negative (TN): number of HC samples classified correctly by the algorithm as HC; False Negative (FN): number of MCI or AD samples classified incorrectly by the algorithm as HC. This process was achieved separately for the first, second, and third model.
Models’ Validation
The proposed models were validated using a train and test split; this is a statistically based evaluation method applied to a ML model with a limited dataset to demonstrate how well it can perform on new data. The data was split into three groups: training, validation, and testing data (Table 1). The test data was held back, not exposed during training, and applied to the models when evaluating the performances. Confusion matrices and area under the ROC curve (Figures 5a–c and 6) were calculated using the results from the test data.
 |
Table 1 Datasets of Time-Frequency Images Included in This Study and Their Classification in Training, Validation, and Testing Dataset |
 |
Figure 5 (a–c) The confusion matrices of the three predictors, the first, second, and third models. Abbreviations: HC, Healthy Controls; MCI, Mild Cognitive Impairment; AD, Alzheimer’s disease, CASE, MCI + Dementia. Note: The confusion matrices were obtained from the test dataset on each model classification performance. |
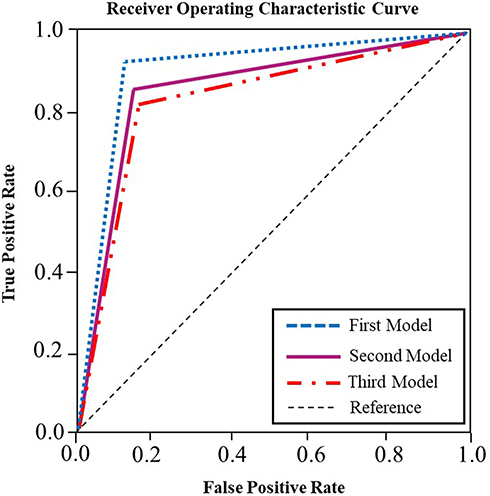 |
Figure 6 The ROC curve of the three predictors of the first (HC vs MCI), second (HC vs AD), and third (HC vs CASE (MCI + AD)) models. Note: The ROC curves were obtained using a roc_curve function from scikit.metrics library (https://scikit-learn.org/stable/) on each model classification performance with the test dataset. |
Results
A total of 16,910 TF images from each EEG channel for the 890 subjects were assigned to one of three datasets: training, validation, and testing. Every subject had 19 TF images from each EEG channel per directory. The first model was trained with 11,115 TF images of which 249 HC and 336 MCI subjects were in the training and validation dataset. The second model had a training and validation dataset of 9386 TF images of which 249 HC and 245 AD subjects and the third model had a training and validation dataset of 15,770 TF images of which 249 HC and 581 CASE (MCI + AD) subjects (Table 1). The test dataset for all models was comprised of 1140 TF images of 60 subjects to evaluate the performance.
The algorithm was designed in Python computer language using Keras Tensorflow on the google Colab cloud platform with GPU system configuration having a 24 GB random access memory. All models, HC vs MCI, HC vs AD, and HC vs CASE (MCI + AD), were subjected to the proposed CNN for a regression neural network algorithm. The evaluation matrices, namely precision, F-measure, sensitivity, specificity, and accuracy were used. A learning rate of 0.01 achieved the best-designed models. The first model (HC vs MCI) yielded an accuracy of 83%, a sensitivity of 93%, and a specificity of 73%.
In contrast, the second model (HC vs AD) had 81%, 80%, and 83%, accuracy, sensitivity, and specificity and the third model (HC vs CASE (MCI + AD)) had accuracy, sensitivity, and specificity of 88%, 80%, 90% (Table 2). Figure 5a–c shows the confusion matrices of our results based on the test dataset.
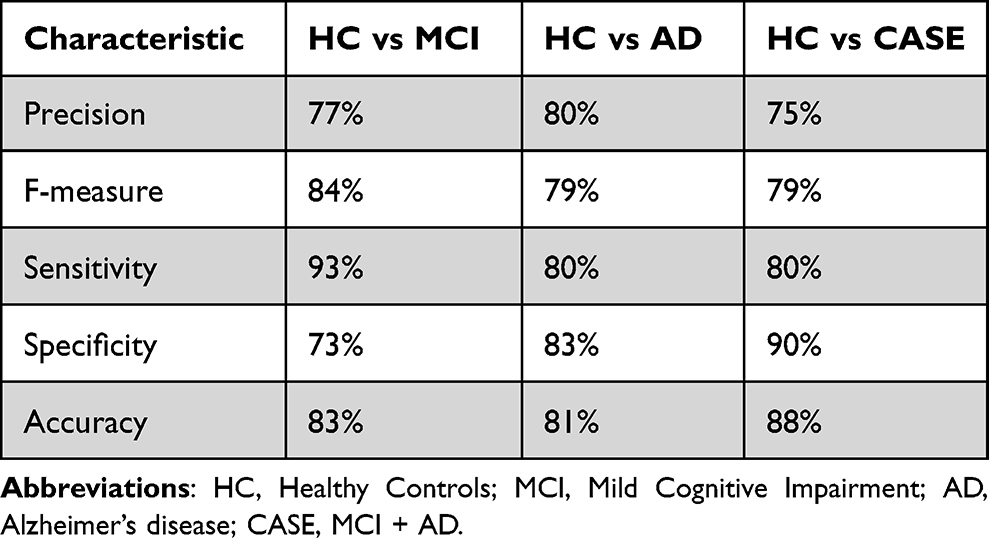 |
Table 2 Precision, F-Measure, Sensitivity, Specificity, and Accuracy of the CNN for Regression Models |
The ROC curves of the three predictors of the HC, MCI, and the combination of MCI and AD are provided in Figure 6. To discriminate cognitive impairment from HC, the HC vs MCI had the highest area under the ROC curve (0.88), followed by HC vs AD (0.84) and HC vs CASE (MCI +AD) (0.83).
Discussion
Although different neuroimaging techniques like MRI and PET can be used to aid in dementia diagnosis by giving quantitative information on abnormalities in the brain,7,8 EEG is non-invasive, less expensive, simpler, and faster to administer.1,42 Also, EEG signal analysis is important for identifying dementia in its early stages and classifying disease severity.43,44 Other studies have supported the possibility of detecting early-stage dementia using EEG and how EEG signal changes are associated with dementia.2,9 Supervised machine learning is one of the most widely used approaches for classifying brain disorders using EEG.45,46
Several studies evaluated the sensitivity and specificity of classification algorithms for clinical diagnosis and early dementia detection. This study aimed to develop ML models that detect MCI and AD among subjects using the TF images dataset as a new biomarker, thereby helping clinicians with early diagnosis of cognitive impairment and classify its severity. The suggested technique extracted artifact-free, 4 s long ECR EEG signals and analyzed them using EEGlab preprocessing software with FFT. The TF Image maps created from the output were then used as the input concatenated with age to an optimized ML model based on the proposed architecture (Figure 4) for two-way classification. The third model had higher accuracy of 88%, with sensitivity, specificity, and area under the curve (AUC) of 80%, 90%, and 88%, respectively. The first and second models also had good sensitivities of 93% and 80%, with AUCs of 84% and 83% for detecting cognitive impairment (Figure 6). Generally, screening tools need a higher sensitivity with AUC to avoid missing cognitively impaired patients among subjects and differentiating the two groups.47 All models were more accurate in detecting the cognitive state of the subjects and could be easily applied to assist clinicians in diagnosing patients as a screening tool when applied in clinical sectors.
There are several techniques using qEEG for the early diagnosis of MCI and AD. Kim and Kim48 created a model to distinguish between MCI and HC participants to study early AD diagnosis. The model comprised an ML with feature-based inputs relating to the relative power of different frequency bands within EEG signals. Compared to our study, the model performed poorly, with just 75% accuracy in binary classification (HC vs MCI). In comparison to the paper published by Fan et al,49 multiscale entropy (MSE), a complexity metric, was used to extract EEG signal components in numerical form for the ML linear regression models’ input. For a binary classification (HC vs AD) with an unbalanced dataset of 15 HC and 108 AD cases, a calculated 46,471 features were used, yielding a maximum accuracy result of 82%. These findings demonstrated a definite accuracy advantage for adopting an unbalanced dataset during ML training.
Marabito et al50 developed a CNN classifier to differentiate between participants EEG recordings of HC, MCI, and AD. The system was based on the engineering feature of the statistical quantities mean (µ), standard deviation (σ), and skewness (υ) from the TF feature representations of the EEG time series. The classification performance was achieved with 85% accuracy in HC vs MCI and 85% accuracy in HC vs AD classification. Fisco et al51 performed different tree-based supervised algorithms by using eyes-closed qEEG features evaluated from TF analysis based on discrete Fourier and Wavelet transforms of 109 samples belonging to HC, MCI, and AD classes. The discrete Fourier feature extraction achieved accuracies of 71.2%, 72%, and 80.2% in HC vs MCI, HC vs AD, and MCI vs AD, respectively. Unlike the current study, the proposed CNN for a regression algorithm supervised learning was evaluated in this study on ECR TF images composed from each directory of the subject with a better performance and ROC analysis was carried out.
Previous studies discuss screening MCI, dementia, and cognitive dysfunction using ML.52,53 Different ML-supervised algorithms were applied to EEG signals, and various performance metrics were used to calculate the model predictions. Durongbhan et al54 proposed a supervised classification framework that used eyes-open EEG signals to classify normal controls and AD dementia participants. The framework incorporated topographic visualization, feature extraction, K-nearest neighbor classification, data augmentation, and quantitative evaluation. The K-nearest neighbor algorithm achieved 99% classification on short (4s) eyes-open EEG epochs to detect AD among participants. In addition, Pedro et al55 applied a surrogate decision tree classifier algorithm with two different ways of cross-validation. The best classification of early-stage AD using EEG signals performance was obtained with vectors of 10 features with an accuracy of 94.88%, AUC, sensitivity, and specificity were 93.4%, 86.19%, and 99.35%, respectively. This had an 88% accuracy, obtained for classification between 3-class subjective cognitive impairment, AD, and other patients. On the other hand, Trambaiolli et al56 suggest a support vector machine algorithm to search patterns in EEG epochs to differentiate patients with AD from normal individuals with 87.0% accuracy and 91.7% sensitivity.
The two-way classification models were intentionally chosen over a three-way class model. First, the adopted classifier’s nature is intrinsically binary and therefore they are expected to perform better. Second, we want to determine if the three groups have specific traits that single them out with respect to the rest of the data. We obtained poorer performances when three classes were used (accuracy below 50%) and the present study had a relatively small number of subjects for a deep neural network study. Therefore, more research is required with an increased dataset to improve the models’ performance. In the future, the authors intend to apply the developed model to a large database of people of various races and ages, create a “international Standard” dataset for training and testing-related systems for the diagnosis of dementia, and use the model on additional databases (outside of sample data) to further understand its reliability and accuracy.
Conclusion
In this current study, we proposed a supervised learning algorithm CNN for a regression. The algorithm was trained based on the age and TF images of the resting state to differentiate the HC, MCI, and AD classes. We tested our trained models on 60 subjects (20 HC, 20 MCI, and 20 dementia) and performed well with accuracy, sensitivity, and AUC above 80%.
While these results are highly positive, additional effort is needed to advance this research. The primary objective was to develop a clinically accurate tool that would help medical professionals diagnose people earlier with symptoms indicative of MCI or AD.
The findings from this study have significantly increased our understanding of the use of ML on qEEG data for AD diagnosis. These developed ML models can support clinicians in identifying key features related to neurodegenerative diseases and provide a quantifiable probability value for a patient’s diagnosis to counteract the resource-intensive and human-dependent procedures now in use.
Abbreviations
EEG, Electroencephalogram; AD, Alzheimer’s disease; MCI, Mild cognitive impairment; Aβ, Amyloid beta; p-tau, Phospho-tau; t-tau, Total-tau; CSF, Cerebrospinal fluid; MRI, Magnetic resonance imaging; PET, Positron emission tomography; FFT, Fast Fourier Transform; qEEG, Quantitative electroencephalogram; ML, Machine learning; CNN, Convolutional neural network; FNN, feed-forward neural networks; ECR, Eyes-closed resting state; HC, Healthy controls; MMSE, Mini-Mental State Examination; SD, Standard deviation; SNSB, Seoul Neuropsychological Screening Battery; TF, Time-Frequency; ICA, Independent component analysis; ASR, Artifact subspace reconstruction; ROC, receiver operating characteristics; AUC, area under the curve; MSE, multiscale entropy.
Data Sharing Statement
The machine learning algorithms and datasets used and analyzed during the current study are available in the GitHub (https://github.com/chanda1993/CNN-for-A-Regression-Machine-Learning-Algorithm-for-Predicting-Cognitive-Impairment-using-qEEG.git) repository.
Ethics Approval and Consent to Participate
The study was conducted in accordance with the Declaration of Helsinki and approved by the Institutional Review Board of the Chung-Ang University Hospital (IRB No. C2012049). Informed consent was waived by the IRB of Chung-Ang University Hospital since this study was retrospective and blinding of the personal information in the data was performed. All methods were carried out in accordance with relevant guidelines and regulations.
Acknowledgments
We thank the Department of Neurology at Chung-Ang University Hospital for providing the necessary tools to make this research successful.
Author Contributions
All authors made a significant contribution to the work reported, whether that is in the conception, study design, execution, acquisition of data, analysis and interpretation, or in all these areas; took part in drafting, revising, or critically reviewing the article; gave the final approval of the version to be published; have agreed on the journal to which the article has been submitted; and agree to be accountable for all aspects of the work.
Funding
The publication costs, design of the study, data management, and writing the manuscript for this article were supported by the Ministry of Education of the Republic of Korea and the National Research Foundation of Korea (Project Number: NRF-2017S1A6A3A01078538).
Disclosure
The authors declare that they have no competing interests.
References
1. Snyder SM, Hall JR, Cornwell SL, Falk JD. Addition of EEG improves accuracy of a logistic model that uses neuropsychological and cardiovascular factors to identify dementia and MCI. Psychiatry Res. 2011;186(1):97–102. doi:10.1016/j.psychres.2010.04.058
2. Al-Qazzaz NK, Ali SH, Ahmad SA, Chellappan K, Islam MS, Escudero J. Role of EEG as biomarker in the early detection and classification of dementia. Sci World J. 2014;2014:906038. doi:10.1155/2014/906038
3. DeTure MA, Dickson DW. The neuropathological diagnosis of Alzheimer’s disease. Mol Neurodegener. 2019;14(1):32. doi:10.1186/s13024-019-0333-5
4. Mayeux R, Stern Y. Epidemiology of Alzheimer disease. Cold Spring Harb Perspect Med. 2012;2(8):a006239. doi:10.1101/cshperspect.a006239
5. Petersen RC, Caracciolo B, Brayne C, Gauthier S, Jelic V, Fratiglioni L. Mild cognitive impairment: a concept in evolution. J Intern Med. 2014;275(3):214–228. doi:10.1111/joim.12190
6. Duong S, Patel T, Chang F. Dementia: what pharmacists need to know. Can Pharma J. 2017;150(2):118–129. doi:10.1177/1715163517690745
7. Banerjee D, Muralidharan A, Hakim Mohammed AR, Malik BH. Neuroimaging in dementia: a brief review. Cureus. 2020;12(6):e8682. doi:10.7759/cureus.8682
8. Decarli C, DeKosky ST, Leon MJ, et al. The use of MRI and PET for clinical diagnosis of dementia and investigation of cognitive impairment: a consensus report. 2004.
9. Ferreira D, Jelic V, Cavallin L, et al. Electroencephalography is a good complement to currently established dementia biomarkers. Dement Geriatr Cogn Disord. 2016;42(1–2):80–92. doi:10.1159/000448394
10. St. Louis EK, Frey LC, Britton JW, et al. Electroencephalography (EEG): An Introductory Text and Atlas of Normal and Abnormal Findings in Adults, Children, and Infants. American Epilepsy Society; 2016.
11. Komolovaitė D, Maskeliūnas R, Damaševičius R. Deep convolutional neural network-based visual stimuli classification using electroencephalography signals of healthy and alzheimer’s disease subjects. Life. 2022;12(3):374. doi:10.3390/life12030374
12. Henderson G, Ifeachor E, Hudson N, et al. Development and assessment of methods for detecting dementia using the human electroencephalogram. IEEE Trans Biomed Eng. 2006;53(8):1557–1568. doi:10.1109/TBME.2006.878067
13. Amo C, De santiago L, Barea R, López-Dorado A, Boquete L. Analysis of gamma-band activity from human EEG using empirical mode decomposition. Sensors. 2017;17(5):989. doi:10.3390/s17050989
14. Algin DI, Adapinar DO, Erdinc OO. EEG biomarker for alzheimer’s disease. In: Neurodegenerative Diseases - Molecular Mechanisms and Current Therapeutic Approaches. IntechOpen; 2020. doi10.5772/intechopen.93711
15. Koberda JL, Moses A, Koberda P, Koberda L. Clinical advantages of quantitative electroencephalogram (QEEG)-electrical neuroimaging application in general neurology practice. Clin EEG Neurosci. 2013;44(4):273–285. doi:10.1177/1550059412475291
16. Kim JS, Lee SH, Park G, et al. Clinical implications of quantitative electroencephalography and current source density in patients with Alzheimer’s disease. Brain Topogr. 2012;25(4):461–474. doi:10.1007/s10548-012-0234-1
17. Smailovic U, Jelic V. Neurophysiological markers of alzheimer’s disease: quantitative EEG approach. Neurol Ther. 2019;8(Suppl 2):37–55. doi:10.1007/s40120-019-00169-0
18. Al-Nuaimi AH, Blūma M, Al-Juboori SS, et al. Robust EEG based biomarkers to detect alzheimer’s disease. Brain Sci. 2021;11(8):1026. doi:10.3390/brainsci11081026
19. Babiloni C, Binetti G, Cassetta E, et al. Sources of cortical rhythms change as a function of cognitive impairment in pathological aging: a multicenter study. Clin Neurophysiol. 2006;117(2):252–268. doi:10.1016/j.clinph.2005.09.019
20. Huang C, Wahlund L, Dierks T, Julin P, Winblad B, Jelic V. Discrimination of Alzheimer’s disease and mild cognitive impairment by equivalent EEG sources: a cross-sectional and longitudinal study. Clin Neurophysiol. 2000;111(11):1961–1967. doi:10.1016/s1388-2457(00)00454-5
21. Turner RP. Clinical application of combined EEG-qEEG functional neuroimaging in the practice of pediatric neuroscience: a personal perspective. Clin EEG Neurosci. 2021;52(2):126–135. doi:10.1177/1550059420982419
22. Nuwer M. Assessment of digital EEG, quantitative EEG, and EEG brain mapping: report of the American Academy of Neurology and the American Clinical Neurophysiology Society. Neurology. 1997;49(1):277–292. doi:10.1212/wnl.49.1.277
23. Jelic V, Shigeta M, Julin P, Almkvist O, Winblad B, Wahlund LO. Quantitative electroencephalography power and coherence in Alzheimer’s disease and mild cognitive impairment. Dementia. 1996;7(6):314–323. doi:10.1159/000106897
24. Luckhaus C, Grass-Kapanke B, Blaeser I, et al. Quantitative EEG in progressing vs stable mild cognitive impairment (MCI): results of a 1-year follow-up study. Int J Geriatr Psychiatry. 2008;23(11):1148–1155. doi:10.1002/gps.2042
25. Van der Zande JJ, Gouw AA, van Steenoven I, Scheltens P, Stam CJ, Lemstra AW. EEG characteristics of dementia with Lewy bodies, Alzheimer’s disease and mixed pathology. Front Aging Neurosci. 2018;10:190. doi:10.3389/fnagi.2018.00190
26. Skolariki K, Terrera GM, Danso S. Multivariate data analysis and machine learning for prediction of MCI-to-AD conversion. Adv Exp Med Biol. 2020;1194:81–103. doi:10.1007/978-3-030-32622-7_8
27. Kim NH, Yang DW, Choi SH, Kang SW. Machine learning to predict brain amyloid pathology in pre-dementia Alzheimer’s disease using QEEG features and genetic algorithm heuristic. Front Comput Neurosci. 2021;15:755499. doi:10.3389/fncom.2021.755499
28. Rossini PM, Miraglia F, Vecchio F. Early dementia diagnosis, MCI-to-dementia risk prediction, and the role of machine learning methods for feature extraction from integrated biomarkers, in particular for EEG signal analysis. Alzheimers Dement. 2022;18:2699–2706. doi:10.1002/alz.12645
29. Dodge S, Karam L. A study and comparison of human and deep learning recognition performance under visual distortions. arXiv. 2017. doi:10.48550/arXiv.1705.02498
30. Schober P, Vetter TR. Linear regression in medical research. Anesth Analg. 2021;132(1):108–109. doi:10.1213/ANE.0000000000005206
31. Ting KM. Confusion matrix. In: Sammut C, Webb GI, editors. Encyclopedia of Machine Learning. Boston, MA: Springer; 2011. doi:10.1007/978-0-387-30164-8_157
32. Park SH, Goo JM, Jo CH. Receiver operating characteristic (ROC) curve: practical review for radiologists. Korean J Radiol. 2004;5(1):11–18. doi:10.3348/kjr.2004.5.1.11
33. Petersen RC, Smith GE, Waring SC, Ivnik RJ, Tangalos EG, Kokmen E. Mild cognitive impairment: clinical characterization and outcome. Arch Neurol. 1999;56(3):303–308. doi:10.1001/archneur.56.3.303
34. Ahn HJ, Chin J, Park A, et al. Seoul Neuropsychological Screening Battery-dementia version (SNSB-D): a useful tool for assessing and monitoring cognitive impairments in dementia patients. J Korean Med Sci. 2010;25(7):1071–1076. doi:10.3346/jkms.2010.25.7.1071
35. Gouw AA, Alsema AM, Tijms BM, et al. EEG spectral analysis as a putative early prognostic biomarker in nondemented, amyloid positive subjects. Neurobiol Aging. 2017;57:133–142. doi:10.1016/j.neurobiolaging.2017.05.017
36. Shim YS, Shin HE. Analysis of neuropsychiatric symptoms in patients with Alzheimer’s disease using quantitative EEG and sLORETA. Neurodegener Dis. 2020;20(1):12–19. doi:10.1159/000508130
37. Delorme A, Makeig S. EEGLAB: an open source toolbox for analysis of single-trial EEG dynamics including independent component analysis. J Neurosci Methods. 2004;134(1):9–21. doi:10.1016/j.jneumeth.2003.10.009
38. Makeig S. Auditory event-related dynamics of the EEG spectrum and effects of exposure to tones. Electroencephalogr Clin Neurophysiol. 1993;86(4):283–293. doi:10.1016/0013-4694(93)90110-h
39. Jiang X, Bian GB, Tian Z. Removal of artifacts from EEG signal: A Review. Sensors (Basel). 2019;19(5):987. doi:10.3390/s19050987.
40. Acharya UR, Fujita H, Oh SL, et al. Automated identification of shockable and non-shockable life-threatening ventricular arrhythmias using convolutional neural network. Future Gener Comput Syst. 2018;79(3):952–959. doi:10.1016/j.future.2017.08.039
41. Faust O, Hagiwara Y, Hong TJ, Lih OS, Acharya UR. Deep learning for healthcare applications based on physiological signals: a review. Comput Methods Programs Biomed. 2018;161:1–13. doi:10.1016/j.cmpb.2018.04.005
42. DeKosky ST, Marek K. Looking backward to move forward: early detection of neurodegenerative disorders. Science. 2003;302(5646):830–834. doi:10.1126/science.1090349
43. Jackson CE, Snyder PJ. Electroencephalography and event-related potentials as biomarkers of mild cognitive impairment and mild Alzheimer’s disease. Alzheimers Dement. 2008;4(1 Suppl 1):S137–S143. doi:10.1016/j.jalz.2007.10.008
44. Hampel H, Lista S, Teipel SJ, et al. Perspective on future role of biological markers in clinical therapy trials of Alzheimer’s disease: a long-range point of view beyond 2020. Biochem Pharmacol. 2014;88(4):426–449. doi:10.1016/j.bcp.2013.11.009
45. Shi M, Wang C, Li XZ, Li MQ, Wang L, Xie NG. EEG signal classification based on SVM with improved squirrel search algorithm. Biomed Tech. 2020;66(2):137–152. doi:10.1515/bmt-2020-0038
46. He C, Liu J, Zhu Y, Du W. Data augmentation for deep neural networks model in EEG classification task: a review. Front Hum Neurosci. 2021;15:765525. doi:10.3389/fnhum.2021.765525
47. Carpenter CR, Bassett ER, Fischer GM, Shirshekan J, Galvin JE, Morris JC. Four sensitive screening tools to detect cognitive dysfunction in geriatric emergency department patients: brief Alzheimer’s Screen, Short Blessed Test, Ottawa 3DY, and the caregiver-completed AD8. Acad Emerg Med. 2011;18(4):374–384. doi:10.1111/j.1553-2712.2011.01040.x
48. Kim D, Kim K. Detection of early stage Alzheimer’s disease using EEG relative power with deep neural network.
49. Fan M, Yang AC, Fuh JL, Chou CA. Topological pattern recognition of severe alzheimer’s disease via regularized supervised learning of EEG complexity. Front Neurosci. 2018;12:685. doi:10.3389/fnins.2018.00685
50. Morabito FC, Campolo M, Leracitano C, et al. Deep convolutional neural networks for classification of mild cognitive impaired and Alzheimer’s disease patients from scalp EEG recordings.
51. Fiscon G, Weitschek E, Cialini A, et al. Combining EEG signal processing with supervised methods for Alzheimer’s patients classification. BMC Med Inform Decis Mak. 2018;18(1):35. doi:10.1186/s12911-018-0613-y
52. Trzepacz PT, Yu P, Sun J, et al.; Alzheimer’s Disease Neuroimaging Initiative. Comparison of neuroimaging modalities for the prediction of conversion from mild cognitive impairment to Alzheimer’s dementia. Neurobiol Aging. 2014;35(1):143–151. doi:10.1016/j.neurobiolaging.2013.06.018
53. Leracitano C, Mammone N, Hussain A, Morabito FC. A novel multi-modal machine learning based approach for automatic classification of EEG recordings in dementia. Neural Ntwk. 2020;123:176–190. doi:10.1016/j.neunet.2019.12.006
54. Durongbhan P, Zhao Y, Chen L, et al. A dementia classification framework using frequency and time-frequency features based on EEG signals. IEEE Trans Neural Syst Rehabil Eng. 2019;27(5):826–835. doi:10.1109/TNSRE.2019.2909100
55. Pedro MR, João PT, Carolina G, Dílio A, Diamantino F. Alzheimer’s early prediction with electroencephalogram. Procedia Comput Sci. 2016;100:865–871. doi:10.1016/j.procs.2016.09.236
56. Trambaiolli LR, Lorena AC, Fraga FJ, Kanda PA, Anghinah R, Nitrini R. Improving Alzheimer’s disease diagnosis with machine learning techniques. Clin EEG Neurosci. 2011;42(3):160–165. doi:10.1177/155005941104200304
 © 2023 The Author(s). This work is published and licensed by Dove Medical Press Limited. The
full terms of this license are available at https://www.dovepress.com/terms
and incorporate the Creative Commons Attribution
- Non Commercial (unported, 3.0) License.
By accessing the work you hereby accept the Terms. Non-commercial uses of the work are permitted
without any further permission from Dove Medical Press Limited, provided the work is properly
attributed. For permission for commercial use of this work, please see paragraphs 4.2 and 5 of our Terms.
© 2023 The Author(s). This work is published and licensed by Dove Medical Press Limited. The
full terms of this license are available at https://www.dovepress.com/terms
and incorporate the Creative Commons Attribution
- Non Commercial (unported, 3.0) License.
By accessing the work you hereby accept the Terms. Non-commercial uses of the work are permitted
without any further permission from Dove Medical Press Limited, provided the work is properly
attributed. For permission for commercial use of this work, please see paragraphs 4.2 and 5 of our Terms.