Back to Journals » International Journal of General Medicine » Volume 14
Clinical Value of Shear Wave Elastography Color Scores in Classifying Thyroid Nodules
Authors Zhang YX, Xue JP, Li HZ, Miao JW, Kang CS
Received 27 July 2021
Accepted for publication 19 October 2021
Published 10 November 2021 Volume 2021:14 Pages 8007—8018
DOI https://doi.org/10.2147/IJGM.S331406
Checked for plagiarism Yes
Review by Single anonymous peer review
Peer reviewer comments 2
Editor who approved publication: Dr Scott Fraser
Yan-Xia Zhang, Ji-Ping Xue, Hui-Zhan Li, Jun-Wang Miao, Chun-Song Kang
Department of Ultrasonography, Third Hospital of Shanxi Medical University, Shanxi Bethune Hospital, Shanxi Academy of Medical Sciences, Taiyuan, 030032, People’s Republic of China
Correspondence: Chun-Song Kang
Department of Ultrasonography, Third Hospital of Shanxi Medical University, Shanxi Bethune Hospital, Shanxi Academy of Medical Sciences, Taiyuan, 030032, People’s Republic of China
Tel +86-13834518776
Email [email protected]
Objective: To evaluate the clinical value of qualitative shear wave elastography (SWE) color in the differential diagnosis of benign and malignant thyroid nodules.
Methods: From January 2017 to July 2018, 241 patients with 261 thyroid nodules, who underwent conventional ultrasonography and SWE examination before surgical resection, were enrolled. The nodules were also evaluated by histopathologic analyses. The SWE color characteristics that could differentiate malignant and benign thyroid nodules were selected and scored based on the malignancy rate. The diagnostic performances were evaluated by receiver operating characteristic (ROC) curves analysis.
Results: Among the 261 thyroid nodules, 58 were benign, and 203 were malignant. Malignancy was associated with orange or red as the color of maximum hardness inside a nodule, green as the primary color, with a “stiff rim,” inhomogeneous internal color, and inhomogeneous color between the nodules and its surrounding areas. The SWE color scores for benign thyroid nodules were mainly 0 and 1, while 4 and 5 were for malignant thyroid nodules. The area under the ROC curve (AUC) of the SWE color score ≥ 3 for the diagnosis of malignant thyroid nodules was 0.828 (95% CI: 0.764, 0.891) with a sensitivity of 82.8%, a specificity of 82.8%, and an accuracy of 83.1%. Additionally, conventional ultrasound combined with SWE color scores had a higher diagnostic performance than conventional ultrasound (AUC 0.820 vs AUC 0.796, P = 0.04).
Conclusion: The SWE color scores might be a convenient and effective method to assist in differentiating thyroid nodules.
Keywords: thyroid nodules, ultrasound, shear wave elastography, color characteristic
Background
Thyroid nodules are common and are detected by high-resolution ultrasonography in 19–67% of healthy asymptomatic individuals.1 The majority of these nodules are benign, and thyroid cancer accounts for approximately 7–15% of thyroid nodules.2 Ultrasonography is the first-line imaging examination for the diagnosis of thyroid nodules. However, no imaging methods, including ultrasonography, can accurately differentiate between benign and malignant thyroid nodules.3,4
It is generally believed in clinical practice that malignant tumors are often harder than benign tumors.5 Based on this, ultrasound elastography technology has been used more and more widely in recent years as an assessment of the properties of thyroid nodules.6–8 But in the early stage The ultrasound elastography technology relies on applying pressure to the inspected tissue to generate strain to assess the stiffness of the tissue. It lacks quantitative evaluation and is easily relied on by the operator, which has certain limitations.9 Shear wave elastography (SWE) is a novel technology that assesses tissue stiffness in real-time and is more quantitative and independent for the user.10 SWE exhibited high accuracy in distinguishing malignant nodules and was considered an independent predictive factor and diagnostic marker for thyroid nodules.11,12 The SWE elasticity indices could quantitatively reflect local tissue stiffness, which could be affected by the size and depth of lesions, heterogeneous echogenicity, and calcifications.13,14 There were obvious dissimilarities in different studies about the optimal cut-off value of SWE elasticity indices. Kyriakidou et al found that maximum stiffness (Emax) with an optimal cut-off at 21.07 kPa showed the highest sensitivity, specificity, and accuracy in distinguishing between benign and malignant thyroid nodules,15 whereas Emax with an optimal cut-off at 65 kPa was reported in the study of Kim et al.16 The SWE color patterns could qualitatively evaluate the overall hardness of the lesion with better repeatability.17,18 Studies have suggested that the qualitative SWE color pattern classification might be representative of quantitative SWE parameters, which showed better diagnostic performance and improved specificity in the diagnosis of suspicious breast masses.19,20 Hence, the SWE color characteristics that could differentiate malignant and benign thyroid nodules were screened and then scored in the current study, and the diagnostic value of SWE color scores in distinguishing thyroid nodules was further evaluated. We hope that the SWE color scores we proposed may be a convenient and effective method to assist in differentiating thyroid nodules.
Materials and Methods
Patients
In total, 241 patients (32 males and 209 females) with thyroid nodules were enrolled in the current study from January 2017 to July 2018. All the patients underwent conventional ultrasonography and SWE examination before surgical resection, and the nodules were evaluated by histopathologic analyses. Patients meeting the following criteria were included: (a) patients aged >18 years; (b) patients with no treatment or biopsy examination before ultrasound examinations; and (c) patients with solid or primarily solid (<25% cystic) nodules by conventional ultrasound examinations. On the other hand, patients were excluded when meeting the following criteria: (a) patients with Hashimoto thyroiditis and patients with nodules more than 3 cm in size (overstepping the maximum coverage of the SWE color); (b) calcification within or around the nodules, which could result in the loss of elastic image information; (c) patients with nodules located in the isthmus or adjacent to the tracheal cartilage and the common carotid artery, as the lateral displacement of the pulsatile flow could cause the nodule hardness to produce artifacts. This study was conducted in accordance with the Declaration of Helsinki. The Ethics Committee of the Bethune Hospital of Shanxi Medical University approved this study, and all patients signed informed consent forms before the examination.
Ultrasound Examinations
All conventional ultrasound and Two-dimensional Shear Wave Elastography (2DSWE) images were collected by the same operator, who was experienced (>5 years) in thyroid ultrasound imaging, utilizing the Aixplorer US system (SuperSonic Imagine, Aix-en-Provence, France) and a linear probe with a frequency range of 4 to 15 MHz. During examinations, the patient was in a supine position with the neck slightly extended. The location, size, echogenicity, shape, margin, and calcification of thyroid nodules were evaluated using a gray-scale ultrasound examination and were categorized based on the Thyroid Imaging Reporting and Data System (TI-RADS) developed by Kwak et al.21 The suspicious ultrasound features included solid components, hypoechogenicity or marked hypoechogenicity, irregular or microlobulated margins, a taller-than-wide shape, and microcalcifications. Based on the TI-RADS, category 3 was defined as having no suspicious ultrasound features, while category 4a was defined as having one suspicious ultrasound feature. Both TI-RADS categories 3 and 4a were considered to be benign. TI-RADS categories 4b, 4c, and 5 were defined as having two, three or four, and five suspicious ultrasound features, respectively. TI-RADS categories 4b, 4c, and 5 were considered to be malignant.
Following ultrasound, the examination was converted to SWE to obtain SWE images. The nodule, as well as their adjacent normal tissue, were set to be included in the built-in region of interest (ROI) during the examination. Tissue stiffness was shown by the default color scale ranges, with softer tissue appearing as blue and harder tissue appearing as red. The tissue elastic modulus was shown using kPa, with the maximum setting at 100 kPa. The images were acquired while patients held their breath and refrained from other movements for 3–5 seconds. Four SWE images for each nodule were obtained for analysis.
Evaluation of SWE Images
Two independent physicians, who were not informed of the clinical information, evaluated the SWE images of all nodules. The imaging color characteristics of each nodule were summarized by synthetically evaluating all four images, and the representative color characteristics for benign and malignant nodules were selected according to the frequency of the color characteristics of each nodule that appeared in the samples. The selected indicators were evaluated by χ2 and Fisher’s exact tests, and indicators of statistical significance were selected as the evaluation index. One week later, all the thyroid nodules were evaluated independently by the two physicians based on the evaluation index, and disagreements were settled by discussing with a third physician.
A total of five color characteristics of SWE images were selected: (a) the hardest color, colors of maximum hardness inside a nodule, including red, orange, blue, and green (Figure 1); (b) the primary color, refers to the color that filled the entire nodule or was predominant in the nodule, including red, orange, blue, and green (Figure 2); (c) the stiff rim, a high-hardness area (orange or red) with an annular or semi-cyclic distribution at the edge of a nodule (Figure 3); (d) internal color homogeneity, where homogeneity refers to the appearance of only one color in a nodule, while inhomogeneity refers to the appearance of two or more colors in a nodule (Figure 4); (e) color homogeneity with surrounding glands, where homogeneity refers to the consistency of the color of the nodule with its surrounding glands, while inhomogeneity refers to the inconsistency of the color of the nodule with its surrounding glands, defined by a clear edge marking the separation (Figure 5). The color characteristics were scored according to the rate of malignancy of the thyroid nodules. The evaluation index of each color characteristic with the lowest malignant rate was scored 0 as the baseline. For each color characteristic, the evaluation index with a higher malignant rate was assigned a score that was one point more than the lower malignant rate. When there was no statistical significance present, two evaluation indices were assigned the same score. The SWE color scores for each thyroid nodule were the sum of the score for each color characteristic on the SWE images.
 |
Figure 1 Representative SWE images of the hardest color. The hardest color, which corresponds to the maximum hardness inside a nodule, includes blue (A), green (B), Orange (C), and red (D). |
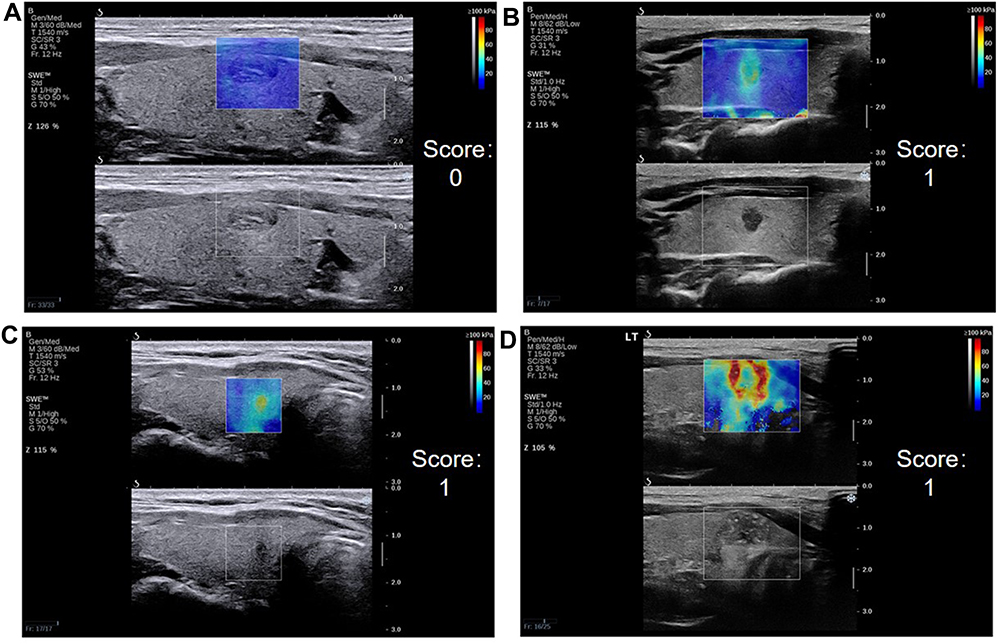 |
Figure 2 Representative SWE images of the main color. The main color, which fills the entire nodule or is predominant in the nodule, includes blue (A), green (B), Orange (C) and red (D). |
 |
Figure 3 Representative SWE images of the stiff rim. The stiff rim is a high-hardness area with an annular or semi-cyclic distribution at the edge of a nodule. Representative SWE images with stiff rim (A) and without stiff rim (B). |
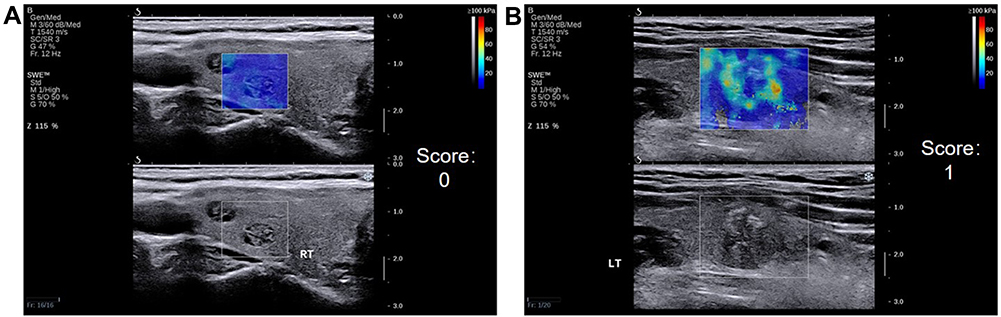 |
Figure 4 Representative SWE images of internal color homogeneity. Homogeneity refers to the appearance of only one color in a nodule (A), while inhomogeneity refers to the appearance of two or more colors in a nodule (B). |
 |
Figure 5 Representative SWE images of color homogeneity with surrounding glands. Homogeneity refers to the consistency of the color of the nodule with its surrounding glands (A), while inhomogeneity refers to the inconsistency of the color of the nodule with its surrounding glands, showing a clear edge to separate the nodule from its surrounding glands (B). |
Statistical Analysis
Data were analyzed utilizing R Statistical Software (Release 2.12.2). Continuous and categorical variables are displayed as mean ± standard deviation and frequencies with percentages, respectively. χ2 test and Fisher’s exact test were applied in the selection of the statistical significance evaluation index. The malignant rate was calculated using the equation: total malignant nodules/total nodules. The kappa test was used to assess the consistency between two observers. Receiver operating characteristic (ROC) curve analysis was used to assess the diagnostic performance of each SWE color characteristic, SWE color scores, conventional ultrasound, and conventional ultrasound combined with SWE color scores. Based on the Youden index (sensitivity + specificity – 1), the optimal cut-off value was detected. The statistical significance was determined by P < 0.05.
Results
Thyroid Nodules
There were 261 thyroid nodules from the 241 patients. Among the 261 thyroid nodules, 58 benign thyroid nodules (including 54 nodular goiters and four adenomas) and 203 malignant thyroid nodules (202 papillary thyroid carcinomas and one medullary carcinoma) were determined by histopathologic analyses. Table 1 shows the other baseline information of patients with malignant and benign thyroid nodules. The mean nodule size of the malignant thyroid nodules was 1.13 ± 0.69 cm, while the mean nodule size was 1.62 ± 0.66 cm for the benign thyroid nodules. Among the 203 malignant nodules, 39 were cervical lymph node metastasis.
 |
Table 1 Baseline Information of Patients with Malignant and Benign Thyroid Nodules |
Color Characteristics of SWE Images for Benign and Malignant Thyroid Nodules
The evaluation indices of each color characteristic in the differentiation of benign and malignant nodules showed significant differences (P < 0.001, Table 2). For malignant thyroid nodules, the color of maximum hardness inside a nodule was orange (47.8%), the primary color was green (60.6%), with a stiff rim (44.8%), internal color inhomogeneity (79.3%), and color inhomogeneity with surrounding glands (82.3%). For benign thyroid nodules, the color of maximum hardness inside a nodule was blue (51.7%), the primary color was blue (82.7%), without a stiff rim (87.9%), internal color homogeneity (65.5%), and color homogeneity with surrounding glands (63.8%).
 |
Table 2 SWE Color Characteristics for Benign and Malignant Nodules |
Designation of SWE Color Scores
The score for each evaluation index of color characteristics is shown in Table 3. For color characteristic 1 (color of maximum hardness inside a nodule), four evaluation indices were included, red, orange, green, and blue. The four evaluation indices were compared pairwise using the χ2 or Fisher’s exact tests, followed by the Bonferroni test, and P < 0.008 was selected to determine statistical significance. Based on the method, the blue color had the lowest malignancy rate and was scored 0. There was no significant difference in the malignancy rate between the blue and green groups (χ2 = 5.882, P = 0.015); hence, the green color was scored 0. There was a significant difference in the malignancy rate between the green and orange groups (χ2 = 18.780, P < 0.001); hence, the orange color was scored 1. In addition, red was scored 1, for there was no significant difference for the malignancy rate between the orange and red groups (χ2 = 0.975, P = 0.323). Similarly, for color characteristic 2 (the primary color), four evaluation indices were included, red, orange, green, and blue. The blue color had the lowest malignancy rate and was scored 0. Green (green vs blue, χ2 = 65.210, P < 0.001), orange (orange vs green, χ2 = 0.557, P = 0.456), and red (red vs orange, P = 1.000) were all scored 1.
 |
Table 3 Malignancy Rates and SWE Color Scores |
SWE Color Scores in Benign and Malignant Thyroid Nodules
The SWE color scores of benign thyroid nodules were smaller than the malignant thyroid nodules. The SWE color scores of benign thyroid nodules were mainly 0 (Figure 6A) and 1 (Figure 6B), accounting for 74.1% (43/58). The color of maximum hardness inside a nodule (color characteristic 1) for benign thyroid nodules was mainly blue and green, and the primary color (color characteristic 2) was blue.
 |
Figure 6 SWE images and HE staining of benign thyroid nodule. Imaging with SWE (A) shows blue as the hardest color, blue as the main color, no stiff rim, homogeneity of the internal color, and the color between the nodules and its surrounding. The SWE score was 0. HE histopathological staining (magnification, 40x). Nodular goiter: Follicles vary in size and are nodular. Imaging with SWE (B) shows green as the hardest color, blue as the main color, no stiff rim, inhomogeneity of the internal color, and the color between the nodules and its surrounding. The SWE score was 1. HE histopathological staining (magnification, 100x). Adenomatous goiter: a single nodule with a capsule visible on the surface. The follicles in the capsule are relatively uniform in size, showing adenoma-like hyperplasia. |
The SWE color scores of malignant thyroid nodules were mainly 4 (Figure 7A) and 5 (Figure 7B), accounting for 72.4% (147/203). The color of maximum hardness inside a nodule (color characteristic 1) for malignant thyroid nodules was mainly red and orange, and the primary color (color characteristic 2) was green. In addition, malignant thyroid nodules showed a stiff rim in annular or semi-cyclic distribution at the edge of a nodule (color characteristic 3).
 |
Figure 7 SWE images and HE staining of malignant thyroid nodule. Imaging with SWE (A) shows red as the hardest color, green as the main color, no stiff rim, inhomogeneity of the internal color, and the color between the nodules and its surrounding. The SWE score was 4. HE histopathological staining (magnification, 40x). Papillary microcarcinoma: The tumor grows liked a papillary, with enlarged nuclei, crowded, ground glass-like, with nuclear grooves; interstitial fibrous tissue hyperplasia and hyaline degeneration. Imaging with SWE (B) shows red as the hardest color, green as the main color, showing stiff rim, inhomogeneity of the internal color, and the color between the nodules and its surrounding. The SWE score was 5. HE histopathological staining (magnification, 100x). Papillary carcinoma: The tumor was papillary and follicular growth, the nucleus was enlarged, deeply stained, crowded, ground glass-like, and nuclear grooves could be seen; interstitial fibrous tissue hyperplasia, hyaline degeneration. |
Diagnostic Performance of Conventional Ultrasound Combined with SWE Color Scores
The area under ROC curve (AUC) of SWE color scores ≥3 for the diagnosis of malignant thyroid nodules was 0.828 (95% CI: 0.764, 0.891), with a sensitivity of 82.8%, a specificity of 82.8%, and an accuracy of 83.1% (Table 4). The SWE color score 3 showed a better diagnostic performance for malignant thyroid nodules in comparison with others.
 |
Table 4 Diagnostic Performance of Different Parameters Analyzed by Receiver Operating Characteristic (ROC) Curves Analysis |
For conventional ultrasound combined with SWE color scores, the TI-RADS grade was evaluated based on conventional ultrasound, and the TI-RADS grade was increased by one when the SWE color scores were ≥3 (except for TI-RADS 5), while the TI-RADS grade was decreased by one when the SWE color scores were <3. The AUC of conventional ultrasound combined with the SWE color scores was 0.820 (0.753, 0.887), with a sensitivity of 85.2%, a specificity of 81.0%, and an accuracy of 84.3%, while the AUC of conventional ultrasound was 0.796 (0.723, 0.868), with a sensitivity of 86.7%, a specificity of 72.4%, and an accuracy of 83.5%. We further compared the diagnostic performance of the SWE color score, conventional ultrasound, and conventional ultrasound combined with SWE color scores. The results showed no significant differences between the SWE color score and conventional ultrasound (P = 0.103) and between the SWE color score and conventional ultrasound combined with SWE color scores (P = 0.717). While conventional ultrasound combined with SWE color scores showed a higher diagnostic performance than conventional ultrasound (P = 0.04).
Reliability Between Clinicians
The reliability of the ratings by two clinicians from the independent examinations of all 261 thyroid nodules with each SWE image color characteristic was analyzed using a kappa test (Table 5). There was good consistency between the two clinicians for evaluating the five color characteristics.
 |
Table 5 Reliability Between Clinicians |
Discussion
The elasticity of the tissue in the SWE examination was quantified by Young’s modulus, and the elastic modulus was converted into color code in real-time. The hard tissue in the elastic image was shown in red, while soft tissue was shown in blue, providing a direct-viewing response of distribution and difference of tissue hardness. In the current study, SWE color scores showed a better diagnostic performance than SWE image color characteristics in distinguishing between benign and malignant thyroid nodules. In addition, conventional ultrasound combined with SWE color scores improved the diagnostic specificity clearly in comparison with conventional ultrasound. Cong et al showed that the TI-RADS categories changed by qualitative color pattern classification could improve the specificity, and such qualitative classification could be a complementary tool of conventional ultrasound.19 Berg et al indicated that upgrade category 3 by visual color stiffness and downgrade category 4a by lack of stiffness could increase specificity from 61.1% to 78.5%.22 The four-color visual SWE image pattern classification proposed by Tozaki et al showed a sensitivity of 91.3% and a specificity of 80.6%, indicating the visual pattern classification was useful in the evaluation.23 These suggested that the SWE color scores in distinguishing between benign and malignant thyroid nodules could contribute to reducing unnecessary fine needle aspiration biopsies and surgeries.
The color of maximum hardness inside a nodule for most malignant nodules was orange, and green was the primary color. On the contrary, the color of maximum hardness inside a nodule for most benign nodules was blue, and blue was the primary color. This indicated that the nodular stiffness of malignant thyroid nodules was higher in comparison with benign nodules, and the degree of malignancy of thyroid nodules was probably associated with nodular stiffness.24–27 Andrioli et al reported that a local-regional pattern of color showing incremental stiffness in the lesion edge was a typical marker of malignant tumors,27 which was named the “stiff rim” sign by Zhou et al.28 The existence of a stiff rim revealed that tissue surrounding the malignant lesion had a high hardness, probably due to desmoplastic reaction or cancer cell infiltration to peritumoral tissue. The high stiffness of tissue surrounding the malignant lesion could attenuate the SWE, which led to a decrease in the amplitude of the shear wave inside the nodule, showing a difference in the color inside the nodule. In our study, malignant nodules showed a higher rate of the “stiff rim” sign in comparison with benign nodules (44.8% vs 12.1%). Moreover, the “stiff rim” sign showed higher specificity (87.9%) than other SWE image color characteristics in diagnosing malignant thyroid nodules. The malignant thyroid nodules showed inhomogeneous internal color and inhomogeneous color between the nodules and their surrounding glands, which was associated with the complex composition and inconsistent distribution of malignant tissues.29,30 However, malignant/benign nodules had overlaps in corresponding SWE color characteristics. Such an overlap might be caused by the different growth stages of the nodules, necrosis or liquefaction appearing in malignant nodules, and organization and calcification appearing in benign nodules.31
The SWE color scores (scores 0 and 1) of benign thyroid nodules were lower than most malignant nodules (scores 4 and 5), suggesting that the SWE color scores could reflect the changes in nodular stiffness. The optimal cut-off of the SWE color scores ≥3 provided a higher AUC than each SWE image color characteristic, showing a better diagnostic performance. The results of this study revealed that the SWE color score was comparable to previous elastography in the diagnostic accuracy of malignant thyroid nodules. A meta-analysis by Veer et al, including 5942 nodules, reported a pooled sensitivity of 87.0%, a specificity of 80.6%, and an accuracy of 81.7% for elastography in distinguishing between benign and malignant thyroid nodules.32 Another meta-analysis by Sjoerd et al of 24 studies, including 3908 nodules, indicated a pooled sensitivity of 85% and a specificity of 80% for qualitative elastography in diagnosing benign and malignant thyroid nodules.33 The SWE color scores provided a new diagnostic way to differentiate thyroid nodules. Recently, studies about elastography paid more attention to the potential of decreasing unnecessary biopsies with benign results. For example, Faisal et al indicated that TI-RADS in B-mode ultrasound combined with SWE quantitative elasticity obtained significant superiority on specificity in comparison with TI-RADS alone.34 Another study showed that quantitative and qualitative SWE features could significantly increase the specificity of TI-RADS alone from 61.1% to 78.5%.22 In the current study, downgrading or upgrading TI-RADS categories by an SWE color score <3 and SWE color scores ≥3, respectively, the specificity of the combination of conventional ultrasound and SWE color scores were significantly improved without losing sensitivity. Based on the results, we concluded that SWE color scores could be used to decrease unnecessary thyroid biopsies. SWE color scores could provide a helpful additional diagnostic criterion for characterizing thyroid nodules.
Despite the findings, there were some limitations to our study. First, the diagnostic utility in this study would be limited because papillary carcinomas accounted for the majority of malignant nodules. Second, only patients who underwent surgery were included in this study. Therefore, there was a sampling bias, especially for patients with benign nodules, that might affect the results. Third, in order to maintain the two-dimensional morphological diversity of benign nodules, five patients with cystic, solid nodules with cystic components <25% that did not affect SWE measurements were included in the study. The inclusion of cystic components may increase the rate of benign nodules. Fourth, the comparison with the results of an elasticity index or shear wave velocity should be performed to further explore the superiority of the SWE color scores. This was also the direction for further empirical research. Additionally, there are requirements to validate the current results with a larger population. In addition, studies have compared the role of artificial intelligence technology and SWE in carpal tunnel syndrome, and it is believed that artificial intelligence method, as an auxiliary tool to evaluate carpal tunnel syndrome with high accuracy, has broad application prospects in clinical practice.35 We could also make efforts in this aspect in the next step.
Conclusion
In conclusion, the SWE color scores were helpful in differentiating benign and malignant thyroid nodules, and SWE color scores combined with conventional ultrasound showed improved specificity. Overall, we suggest that the SWE color scores might be a convenient and effective method to assist in differentiating thyroid nodules.
Funding
This study was supported by Key research and Development Projects in Shanxi Province (grant number 201803D31143).
Disclosure
The authors declared that there was no conflict of interest.
References
1. Yoon JH, Lee HS, Kim E-K, Moon HJ, Kwak JY. Malignancy risk stratification of thyroid nodules: comparison between the thyroid imaging reporting and data system and the 2014 American thyroid association management guidelines. Radiology. 2016;278(3):917–924. doi:10.1148/radiol.2015150056
2. Kuo JH, McManus C, Graves CE, et al. Updates in the management of thyroid nodules. Curr Probl Surg. 2019;56(3):103–127.
3. Pemayun TG. Current diagnosis and management of thyroid nodules. Acta Medica Indonesiana. 2016;48(3):247–257.
4. Detweiler K, Elfenbein DM, Mayers D. Evaluation of thyroid nodules. Surg Clin North Am. 2019;99(4):571–586.
5. Shuzhen C. Comparison analysis between conventional ultrasonography and ultrasound elastography of thyroid nodules. Eur J Radiol. 2012;81(8):1806–1811.
6. Zhao CK, Xu HX. Ultrasound elastography of the thyroid: principles and current status. Ultrasonography (Seoul, Korea). 2019;38(2):106–124.
7. Zakaria OM, Mousa A, AlSadhan R, et al. Reliability of sonoelastography in predicting pediatric cervical lymph node malignancy. Pediatr Surg Int. 2018;34:885–890.
8. Gharib H, Papini E, Garber JR, et al. American association of clinical endocrinologists, American College of endocrinology, and associazione medici endocrinologi medical guidelines for clinical practice for the diagnosis and management of thyroid nodules-2016 update. Endocrine Pract. 2016;22(5):622–639.
9. Ragazzoni F, Deandrea M, Mormile A, et al. High diagnostic accuracy and interobserver reliability of real-time elastography in the evaluation of thyroid nodules. Ultrasound Med Biol. 2012;38:1154–1162.
10. Taljanovic MS, Gimber LH, Becker GW, et al. Shear-wave elastography: basic physics and musculoskeletal applications. Radiographics. 2017;37(3):855–870.
11. Chang N, Zhang X, Wan W, Zhang C, Zhang X. The preciseness in diagnosing thyroid malignant nodules using shear-wave elastography. Med Sci Monitor. 2018;24:671–677.
12. Liao LJ, Chen HW, Hsu WL, Chen YS. Comparison of strain elastography, shear wave elastography, and conventional ultrasound in diagnosing thyroid nodules. J Med Ultrasound. 2019;27(1):26–32.
13. Swan KZ, Bonnema SJ, Jespersen ML, Nielsen VE. Reappraisal of shear wave elastography as a diagnostic tool for identifying thyroid carcinoma. Endocrine Connections. 2019;8(8):1195–1205.
14. Yoon JH, Jung HK, Lee JT, Ko KH. Shear-wave elastography in the diagnosis of solid breast masses: what leads to false-negative or false-positive results? Eur Radiol. 2013;23(9):2432–2440.
15. Kyriakidou G, Friedrich-Rust M, Bon D, et al. Comparison of strain elastography, point shear wave elastography using acoustic radiation force impulse imaging and 2D-shear wave elastography for the differentiation of thyroid nodules. PLoS One. 2018;13(9):e0204095.
16. Kim H, Kim JA, Son EJ, Youk JH. Quantitative assessment of shear-wave ultrasound elastography in thyroid nodules: diagnostic performance for predicting malignancy. Eur Radiol. 2013;23(9):2532–2537.
17. Park J, Woo OH, Shin HS, Cho KR, Seo BK, Kang EY. Diagnostic performance and color overlay pattern in shear wave elastography (SWE) for palpable breast mass. Eur J Radiol. 2015;84(10):1943–1948.
18. Gweon HM, Youk JH, Son EJ, Kim JA. Clinical application of qualitative assessment for breast masses in shear-wave elastography. Eur J Radiol. 2013;82(11):e680–5.
19. Cong R, Li J, Guo S. A new qualitative pattern classification of shear wave elastography for solid breast mass evaluation. Eur J Radiol. 2017;87:111–119.
20. Yoon JH, Ko KH, Jung HK, Lee JT. Qualitative pattern classification of shear wave elastography for breast masses: how it correlates to quantitative measurements. Eur J Radiol. 2013;82(12):2199–2204.
21. Kwak JY, Han KH, Yoon JH, et al. Thyroid imaging reporting and data system for US features of nodules: a step in establishing better stratification of cancer risk. Radiology. 2011;260(3):892–899.
22. Berg WA, Cosgrove DO, Doré CJ, et al. Shear-wave elastography improves the specificity of breast US: the BE1 multinational study of 939 masses. Radiology. 2012;262(2):435–449.
23. Tozaki M, Fukuma E. Pattern classification of ShearWave™ Elastography images for differential diagnosis between benign and malignant solid breast masses. Acta Radiologica (Stockholm, Sweden: 1987). 2011;52(10):1069–1075.
24. Park AY, Son EJ, Han K, Youk JH, Kim JA, Park CS. Shear wave elastography of thyroid nodules for the prediction of malignancy in a large scale study. Eur J Radiol. 2015;84(3):407–412.
25. Cong S. Comparison analysis between conventional ultrasonography and ultrasound elastography of thyroid nodules. Eur J Radiol. 2012;81(8):1806–1811.
26. Koperek O, Scheuba C, Puri C, et al. Molecular characterization of the desmoplastic tumor stroma in medullary thyroid carcinoma. Int J Oncol. 2007;31(1):59–67.
27. Andrioli M, Persani L. Elastographic techniques of thyroid gland: current status. Endocrine. 2014;46(3):455–461.
28. Zhou J, Zhan W, Chang C, et al. Breast lesions: evaluation with shear wave elastography, with special emphasis on the “stiff rim” sign. Radiology. 2014;272(1):63–72.
29. Wang Y, Dan HJ, Dan HY, Li T, Hu B. Differential diagnosis of small single solid thyroid nodules using real-time ultrasound elastography. J Int Med Res. 2010;38(2):466–472.
30. Dighe MK. Elastography of thyroid masses. Ultrasound Clin. 2014;9(1):13–24.
31. Frates MC, Benson CB, Charboneau JW, et al. Management of thyroid nodules detected at US: society of Radiologists in Ultrasound consensus conference statement. Radiology. 2005;237(3):794–800.
32. Veer V, Puttagunta S. The role of elastography in evaluating thyroid nodules: a literature review and meta-analysis. Eur Arch Oto-Rhino-Laryngol. 2015;272(8):1845–1855.
33. Nell S, Kist JW, Debray TP, et al. Qualitative elastography can replace thyroid nodule fine-needle aspiration in patients with soft thyroid nodules. A systematic review and meta-analysis. Eur J Radiol. 2015;84(4):652–661.
34. Faisal B, Liu S, Hoi-Chun L, Shea-Ping Y, Helen L, Ying M. Shear wave elastography combining with conventional grey scale ultrasound improves the diagnostic accuracy in differentiating benign and malignant thyroid nodules. Appl Sci. 2017;7(11):1103.
35. Ali A, Ahmadreza A, Shweta B, et al. Diagnosis of carpal tunnel syndrome: a comparative study of shear wave elastography, morphometry and artificial intelligence techniques. Pattern Recogn Lett. 2020;133:77–85.
 © 2021 The Author(s). This work is published and licensed by Dove Medical Press Limited. The
full terms of this license are available at https://www.dovepress.com/terms
and incorporate the Creative Commons Attribution
- Non Commercial (unported, 3.0) License.
By accessing the work you hereby accept the Terms. Non-commercial uses of the work are permitted
without any further permission from Dove Medical Press Limited, provided the work is properly
attributed. For permission for commercial use of this work, please see paragraphs 4.2 and 5 of our Terms.
© 2021 The Author(s). This work is published and licensed by Dove Medical Press Limited. The
full terms of this license are available at https://www.dovepress.com/terms
and incorporate the Creative Commons Attribution
- Non Commercial (unported, 3.0) License.
By accessing the work you hereby accept the Terms. Non-commercial uses of the work are permitted
without any further permission from Dove Medical Press Limited, provided the work is properly
attributed. For permission for commercial use of this work, please see paragraphs 4.2 and 5 of our Terms.