Back to Journals » Diabetes, Metabolic Syndrome and Obesity » Volume 17
Clinical Significance of Serum Bile Acid Profiles in Fatty Liver
Authors Sun HY, Wu LC, Xu MJ, Zheng ED, Yu YC, Ye Y
Received 5 September 2024
Accepted for publication 30 November 2024
Published 20 December 2024 Volume 2024:17 Pages 4843—4856
DOI https://doi.org/10.2147/DMSO.S494810
Checked for plagiarism Yes
Review by Single anonymous peer review
Peer reviewer comments 2
Editor who approved publication: Dr Konstantinos Tziomalos
Hao-Yue Sun,1 Le-Can Wu,1 Meng-Jie Xu,2 En-Dian Zheng,1 Ying-Cong Yu,1 Yi Ye1
1Department of Gastroenterology, The Wenzhou Third Clinical Institute Affiliated to Wenzhou Medical University, Wenzhou People’s Hospital, The Third Affiliated Hospital of Shanghai University, Wenzhou, Zhejiang, 325000, People’s Republic of China; 2Department of Laboratory Medicine, The Wenzhou Third Clinical Institute Affiliated to Wenzhou Medical University, Wenzhou People’s Hospital, The Third Affiliated Hospital of Shanghai University, Wenzhou, Zhejiang, 325000, People’s Republic of China
Correspondence: Yi Ye; Ying-Cong Yu, Department of Gastroenterology, The Wenzhou Third Clinical Institute Affiliated to Wenzhou Medical University, Wenzhou People’s Hospital, No. 299, Guan Road, Ouhai District, Wenzhou, Zhejiang, 325000, People’s Republic of China, Tel +86 13695853687; +86 13868322200, Email [email protected]; [email protected]
Objective: This study aims to investigate the alterations in serum bile acid profiles among individuals with fatty liver (including non-alcoholic fatty liver (NAFL) and alcoholic fatty liver (AFL) and evaluate their clinical significance when combined with liver enzyme levels.
Methods: A cohort of 110 individuals with fatty liver (including non-alcoholic fatty liver 58 individuals and alcoholic fatty liver 52 individuals) was selected from the Department of Gastroenterology at Wenzhou People’s Hospital between January 2021 and December 2022, while a control group of 66 healthy individuals was recruited from the hospital’s health examination center during the same period. Clinical data and blood samples were collected from all participants. Serum bile acid profiles were quantified using ultra-performance liquid chromatography coupled with tandem mass spectrometry (UPLC-MS/MS). Statistical analysis was conducted in conjunction with liver enzyme indicators.
Results: In the NAFL group, GCA, TCA, and TCDCA levels were significantly elevated compared to the control group, with GCA (AUC 0.754, sensitivity 0.707, specificity 0.712), TCA (AUC 0.770, sensitivity 0.724, specificity 0.712), and TCDCA (AUC 0.782, sensitivity 0.810, specificity 0.652) showing strong diagnostic value. In the AFL group, TCDCA, TCA, GCA, TUDCA, and GUDCA were significantly elevated, with AUC values ranging from 0.848 to 0.912. Among these, TUDCA had the highest sensitivity (0.885) and specificity (0.773) for AFL diagnosis. TUDCA (sensitivity 0.615, specificity 0.897) was the key bile acid distinguishing AFL from NAFL, with an optimal cut-off of 36.33 nmol/L. These bile acids show significant diagnostic potential for differentiating NAFL and AFL.
Conclusion: The bile acid profiles in both NAFL and AFL patients show changes, which hold potential clinical significance and may serve as serum biomarkers to differentiate NAFL from AFL.
Keywords: bile acid profile, diagnosis, non-alcoholic fatty liver, alcoholic fatty liver
Introduction
Fatty liver disease (FLD) is a clinicopathological syndrome characterized by excessive fat accumulation and steatosis in hepatocytes. It primarily includes non-alcoholic fatty liver disease (NAFLD) and alcoholic fatty liver disease (AFLD). In recent years, with the increasing prevalence of metabolic syndrome and alcohol consumption, the incidence of fatty liver disease has also been on the rise. NAFLD is a chronic, progressive liver condition that develops in genetically susceptible individuals due to obesity and insulin resistance (IR). It encompasses a spectrum of liver abnormalities such as non-alcoholic fatty liver (NAFL), non-alcoholic steatohepatitis (NASH), and the subsequent development of fibrosis and cirrhosis.1 In recent years, NAFLD has emerged as the most prevalent chronic liver disease in China, often serving as the primary cause of liver function abnormalities identified during routine health examinations.2 Extensive research on the pathogenesis of NAFLD has identified several contributing factors, including genetic predispositions, insulin resistance (IR), inflammatory liver responses, oxidative stress, gut microbiome disturbances, and dysregulation of bile acid metabolism.3–7 AFLD is a group of liver disorders caused by long-term alcohol consumption or high intake of alcohol over a short period. AFLD mainly includes simple steatosis, alcoholic steatohepatitis, alcoholic liver fibrosis, and alcoholic cirrhosis.8 Alcohol has become the second leading cause of liver damage after viral hepatitis in China. Bile acids, as primary components of bile, are mainly found in the enterohepatic circulation system, aiding in the emulsification of fats and promoting lipid digestion and absorption. They play a significant role in fat metabolism and can also act as signaling molecules and metabolic regulators, activating nuclear receptors and G protein-coupled receptor signaling pathways to help maintain metabolic balance in the body. Changes in serum total bile acid concentrations are closely associated with gut microbiota, liver metabolism, and other metabolic processes.9
Notably, in the early stage of liver disease, significant alterations in the concentrations of specific bile acid subtypes in the serum have been observed, even when total serum bile acid levels remain unchanged.2 This study aimed to evaluate the serum bile acid profiles, liver enzyme markers, and lipid levels in patients with fatty liver (including NAFL and AFL), and to analyze their correlations with the diseases, as well as the diagnostic significance of shifts in bile acid subtype concentrations.
Participants and Methods
Study Population
The study included 110 individuals diagnosed with fatty liver disease, which divided the NAFL group and the AFL group, recruited from the Department of Gastroenterology at Wenzhou People’s Hospital between January 2021 and December 2022. The NAFL group consisted of 34 males and 24 females, aged between 28 and 76 years, with a mean age of 52.19 ± 11.75 years, and the AFL group consisted of 50 males and 2 females, aged between 35 and 78 years, with a mean age of 59.04 ± 1.61 years. For comparison, a control group was established, comprising 66 healthy individuals (30 males and 36 females) who attended the hospital’s physical examination center during the same period. The control group participants were aged between 28 and 70 years, with a mean age of 51.79 ± 8.71 years. The study protocol received approval from the hospital’s ethics committee (ethics approval number: 2021–266), and an informed consent form was obtained from all participants.
The inclusion criteria for the NAFL group were aligned with the Guidelines for the Prevention and Treatment of Metabolic Dysfunction-Associated (Non-Alcoholic) Fatty Liver Disease (2018 updated version) and included the following:
The inclusion criteria for the AFL group were aligned with the Guidelines for the Prevention and Treatment of Alcoholic Liver Disease (2018 updated version)10 and included the following:
For the control group, the inclusion criteria were as follows:
Research Methods
Sample Collection
Basic clinical data were collected from patients, including information on age, gender, height, weight, blood pressure, and the presence of underlying conditions such as diabetes, dyslipidemia, and hepatitis. Imaging results, including abdominal ultrasound, CT, and MRI, conducted after hospital admission were also recorded.
For serum collection, venous peripheral blood samples (2.0 mL) were obtained from patients after an 8-hour fast in the morning. Samples were collected using disposable vacuum yellow cap separator tubes (5 mL, containing coagulant and separation gel). The serum was separated by centrifugation at 3000 rpm for 3–5 minutes within 2 hours of collection. If immediate analysis was not feasible, the samples were stored at 2–8°C, shielded from light, and kept for no longer than 7 days, with no more than three freeze-thaw cycles. Other biochemical markers were collected following the same procedure.
Detection Methods
The detection and quantification of 15 bile acid subtypes in serum were performed using the Waters Acquity UPLC-TQD liquid chromatography-mass spectrometry system (Waters Corporation, USA). The bile acids analyzed included cholic acid (CA), chenodeoxycholic acid (CDCA), deoxycholic acid (DCA), lithocholic acid (LCA), ursodeoxycholic acid (UDCA), and their glycine-conjugated and taurine-conjugated forms. Quantification was carried out using the selected reaction monitoring mode combined with isotope-labeled internal standards and followed by multivariate statistical analysis.
Other serum parameters, including total bilirubin (TBIL), direct bilirubin (DBIL), indirect bilirubin (IBIL), serum albumin (ALB), alanine aminotransferase (ALT), aspartate aminotransferase (AST), r-glutamyltranspeptidase (GGT), total bile acids (TBA), urea (UA), creatinine (Cr), triglycerides (TG), total cholesterol (TC) and prothrombin (PT), were measured using a Roche Automated Biochemical Analyzer P800. Alpha fetoprotein (AFP) levels were determined using a Roche Combas 6000 biochemical analyzer.
Statistical Methods
General Data Analysis
Statistical analyses were performed using SPSS 25.0. The normality and homogeneity of variances for each dataset were initially assessed. Data that conformed to a normal distribution were presented as mean ± standard deviation ( ), and comparisons between groups were made using the t-test. For data that did not follow a normal distribution, they were expressed as a median and interquartile range [M (Q1, Q3)]), with comparisons between groups made using the Mann–Whitney U-test. Categorical data were represented as frequencies, and the groups were compared using the x² test to identify statistically significant differences.
Selection of Characteristic Bile Acid Subtypes
The bile acid profile data were processed using a log2 transformation and subsequently imported into SIMCA 14.1 software for multivariate statistical analysis. To identify the most relevant bile acid subtypes, orthogonal partial least squares-discriminant analysis (OPLS-DA) was employed to decompose the information in the X matrix into categories related and unrelated to Y. Orthogonal signal correction techniques were applied to filter out irrelevant classification information, thereby concentrating relevant information in a single predictive component. A pattern recognition model was then established, and its robustness was evaluated using 200 permutation tests to check for overfitting. Initial screening of characteristic bile acid subtypes was based on variable importance in projection (VIP) values obtained from the VIP+s-plot, selecting subtypes with VIP > 1 and a correlation coefficient (absolute value) p (corr) > 0.7.
Subsequently, Spearman’s rank correlation analysis was conducted to explore the correlations between differential indicators and the corresponding fatty liver, selecting indicators with strong correlations. Additionally, ROC curves were plotted for the characteristic bile acid subtypes and TBA to observe and compare their cut-off values, sensitivity, and specificity.
Results
The NAFL Group Vs the Control Group
Comparison of Clinical Data and Routine Biochemical Values Between Groups
There were no statistically significant differences in age and gender between the NAFL group and the control group (all P values > 0.05). However, the NAFL group had significantly higher values for BMI, TBIL, IBIL, ALT, AST, ALP, GGT, TBA, Gly, TG, TC, PT, AFP, PIVKA, HbA1c, UA, and Cr compared to the control group, with statistically significant differences (all P values < 0.05). Refer to Table 1.
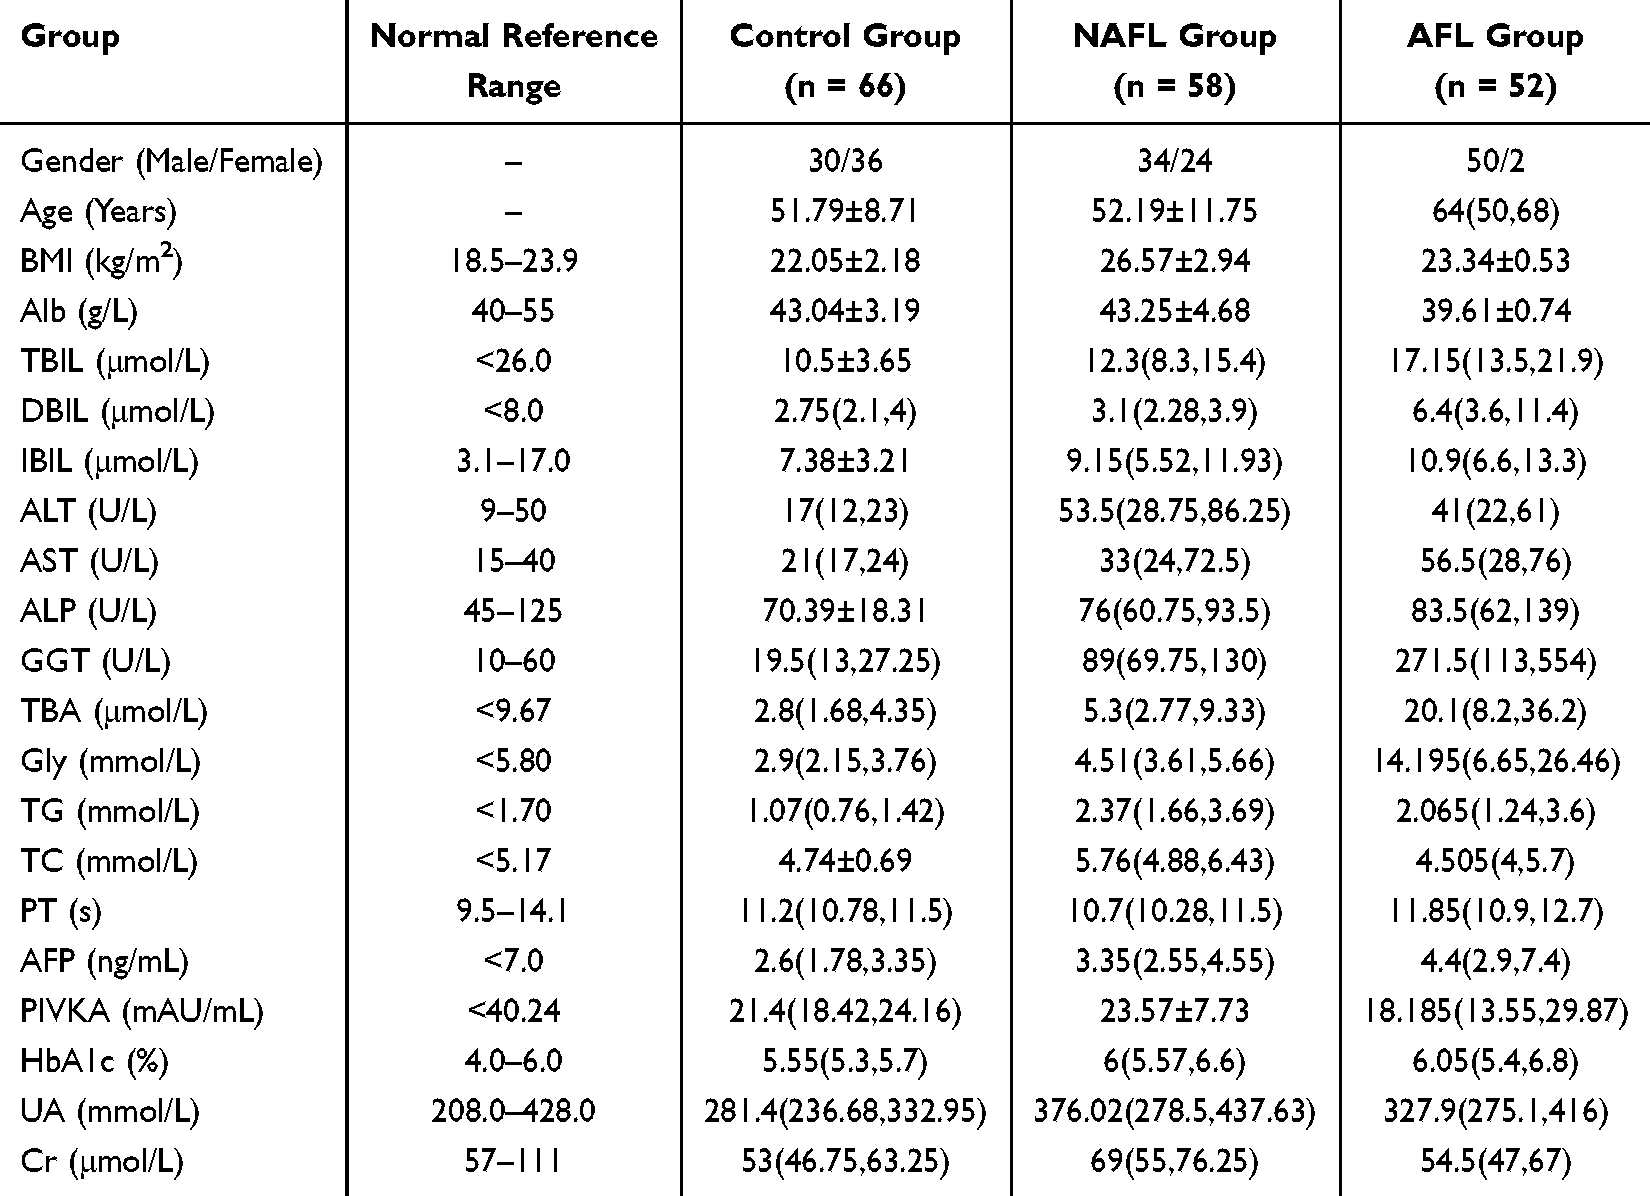 |
Table 1 General Information and Biochemical Test Indicators of Patients in the Fatty Liver Groups and the Control Group |
Analysis of Bile Acid Profiles Between Groups
After processing the bile acid profile data from Table 2 (log2 transformation) and analyzing it using SIMCA 14.1 software, the OPLS-DA analysis revealed that the bile acid profiles of the NAFL group and the control group were dispersed in different areas of the plot (see Figure 1A), indicating distinct group differences and intra-group clustering. A 200-time permutation test validated the OPLS-DA models, confirming that the model was not overfitted (the criterion for a valid model was met: all permutation values on the left were lower than the original values on the right, and the blue Q2 point’s regression line intersected or was < 0 on the x-axis) (see Figure 1B). Consequently, these results indicate significant differences in bile acid profile compositions between the two groups. Furthermore, based on Figure 1C, bile acid subtypes with VIP values > 1 and s-plot correlation coefficients (absolute value) P (corr) > 0.7 were selected, specifically: GCA, TCA and TCDCA.
 |
Table 2 Bile Acid Concentrations (Nmol/L, [M (Q1, Q3)]) in the Fatty Liver Groups and the Control Group |
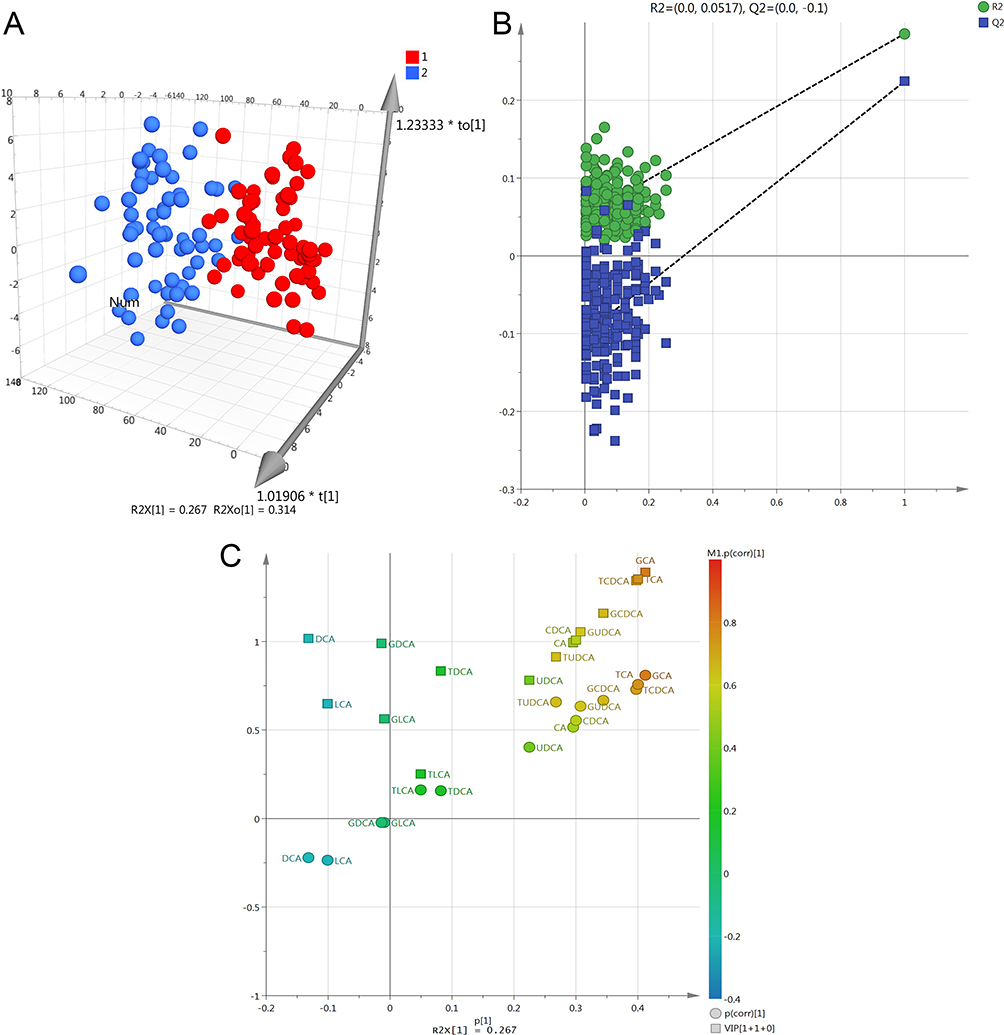 |
Figure 1 (A) OPLS-DA model of bile acid profiles comparing the NAFL group to the control group (red represents the control group; blue represents the NAFL group). (B) Permutation test plot for bile acid profiles comparing the NAFL group to the control group (R2 indicates Model Fit; Q2 indicates Model Prediction). (C) VIP+s-Plot of bile acid profiles comparing the NAFL group to the control group. |
Spearman Correlation Analysis
Spearman correlation analysis was conducted to explore the relationships between selected differential bile acid subtypes, biochemical markers, and NAFL, focusing on correlations with coefficients |r| ≥ 0.4. Significant moderate positive correlations were identified between NAFL and ALT, AST, GGT, TG, TC, HbA1c, BMI, DCA, TCA, and TCDCA. (see Table 3).
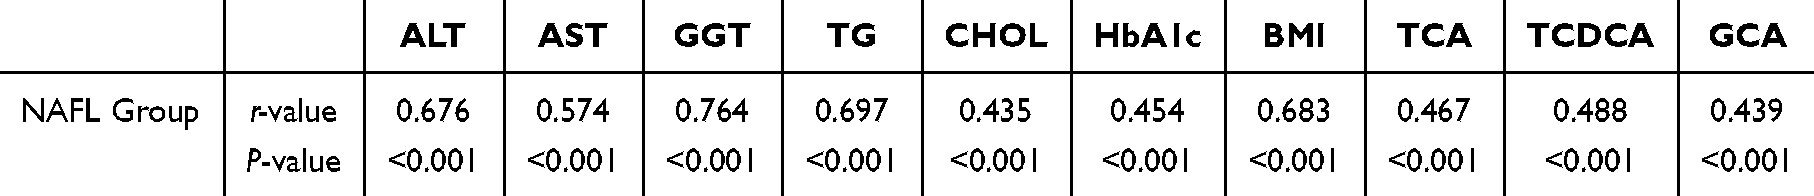 |
Table 3 Spearman Correlation Analysis of Differential Metabolites in the NAFL Group |
Diagnostic Efficacy Evaluation of GCA, TCA, TCDCA and TBA
ROC curves were plotted for GCA, TCA, TCDCA and TBA. The results showed that the AUC for serum GCA, TCA, TCDCA and TBA were 0.754, 0.770, 0.782 and 0.721 respectively. The optimal cut-off points were identified as 173.91 nmol/L for GCA, 21.75 nmol/L for TCA, 89.76 nmol/L for TCDCA and 4.65 nmol/L for TBA. The sensitivity and specificity for GCA were 0.707 and 0.712, TCA were 0.724 and 0.712, TCDCA were 0.81 and 0.652 respectively, while for TBA, they were 0.603 and 0.833 (see Table 4, Figure 2).
 |
Table 4 ROC Curve Analysis for Predicting NAFL Using GCA, TCA, TCDCA and TBA |
 |
Figure 2 ROC curve results for GCA, TCA, TCDCA and TBA in identifying NAFL. |
The AFL Group Vs the Control Group
Comparison of Clinical Data and Routine Biochemical Values Between Groups
A comparison of patients with AFL and the control group in terms of age and gender showed that P-values were all < 0.05, indicating that AFL patients tend to be older than the control group and predominantly male. In the AFL group, BMI, TBIL, DBIL, IBIL, ALT, AST, ALP, GGT, TBA, Gly, TG, PT, AFP, HbA1c, and UA levels were significantly higher than those in the control group, while ALB levels were significantly lower. These differences are statistically significant P-values < 0.05 (see Table 1).
Analysis of Bile Acid Profiles Between Groups
The OPLS-DA analysis revealed differences in bile acid composition between the AFL group and the control group (see Figure 3A). A 200-permutation test confirmed the validity of the predictive model, indicating no model overfitting (see Figure 3B). Bile acid subtypes were selected based on VIP values >1 and s-plot correlation coefficients (absolute value) p (corr)>0.7, identifying the following bile acids as differentiators: TCDCA, TCA, GCA, TUDCA, and GUDCA (see Figure 3C).
 |
Figure 3 (A) OPLS-DA model of bile acid profiles comparing the AFL group to the control group (red represents the control group; yellow represents the AFL group). (B) Permutation test plot for bile acid profiles comparing the AFL group to the control group. (C) VIP+s-Plot of bile acid profiles comparing the AFL group to the control group. |
Spearman Correlation Analysis
We then performed a Spearman correlation analysis between the selected differential bile acid subtypes, biochemical indicators, and early alcoholic liver disease. By choosing a correlation coefficient |r|≥0.4, we identified TBIL, DBIL, ALT, AST, GGT, TBA, Gly, TG, AFP, TCDCA, TCA, GCA, TUDCA, and GUDCA as having a significant positive moderate correlation with alcoholic fatty liver disease (see Table 5).
 |
Table 5 Spearman Correlation Analysis of Differential Metabolites in AFL Group |
Diagnostic Efficacy Evaluation of TCDCA, TCA, GCA, TUDCA, GUDCA and TBA
We next plotted the ROC curves for TCDCA, TCA, GCA, TUDCA, GUDCA, and TBA, as shown in Table 6 and Figure 4. The AUC values for serum TCDCA, TCA, GCA, TUDCA, GUDCA, and TBA were 0.876, 0.882, 0.892, 0.912, 0.848, and 0.887, respectively. The optimal cutoff points were 333.865 nmol/L, 78.765 nmol/L, 457.635 nmol/L, 12.235 nmol/L, 292.56 nmol/L, and 6.7 nmol/L, with corresponding sensitivities and specificities as follows: 0.731/0.894, 0.731/0.939, 0.769/0.924, 0.885/0.773, 0.846/0.803, and 0.846/0.909.
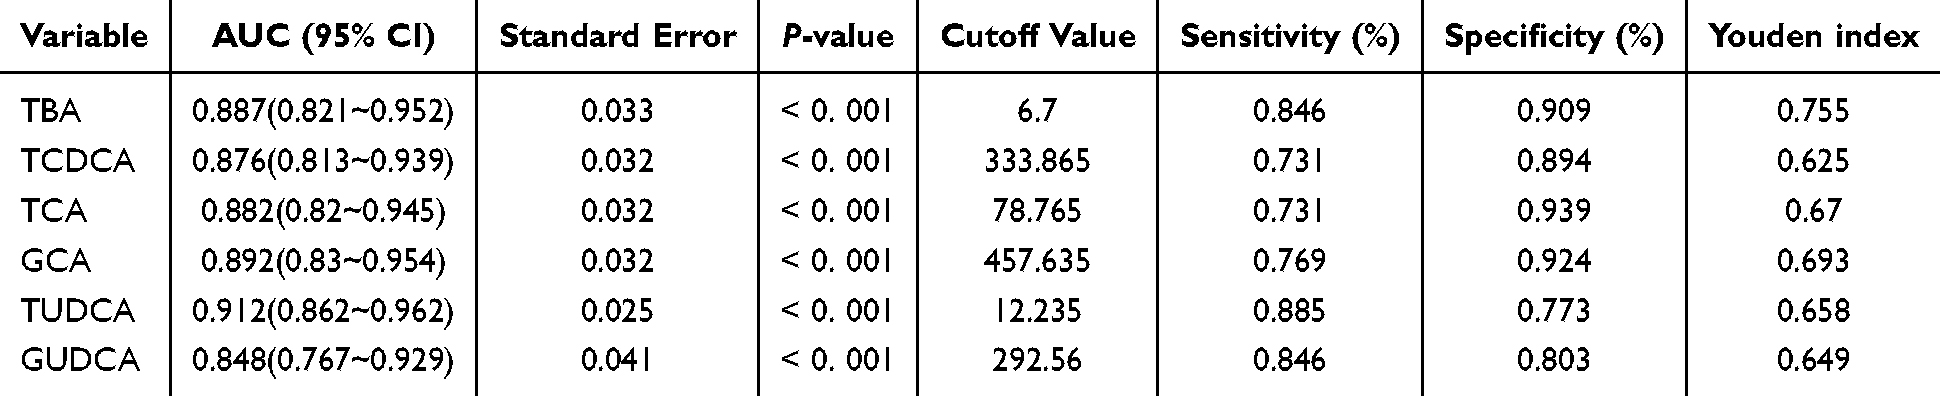 |
Table 6 ROC Curve Analysis for Predicting AFL Using TCDCA, TCA, GCA TUDCA, GUDCA and TBA |
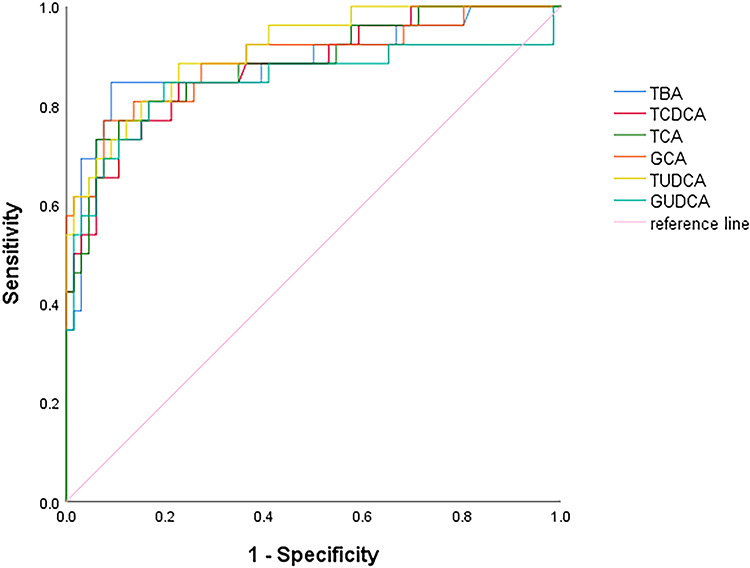 |
Figure 4 ROC curve results for different bile acids and TBA in identifying AFL. |
The NAFL Group Vs the AFL Group
Comparison of Clinical Data and Routine Biochemical Values Between Groups
The comparison of age and gender between the two groups of fatty liver showed a P-value < 0.05, indicating that patients with AFL were older than those with NAFL, and there were more males than females in the AFL group. In addition, patients in the AFL group had significantly higher levels of TBIL, DBIL, AST, GGT, TBA, Gly, PT, and AFP compared to those in the NAFL group. Conversely, BMI, Alb, TC, PIVKA, and Cr were lower in the AFL group compared to the NAFL group, with all differences being statistically significant (P-values < 0.05) (see Table 1).
Analysis of Bile Acid Profiles Between Groups
Similarly, the OPLS-DA analysis showed that the bile acid profile composition differed between the NAFL and the AFL (see Figure 5A). The 200-time permutation test confirmed the validity of the prediction model, with no signs of overfitting (Figure 5B). Based on VIP values > 1 and s-plot correlation coefficients (absolute p (corr)>0.7), the bile acid subtype identified was TUDCA (see Figure 5C).
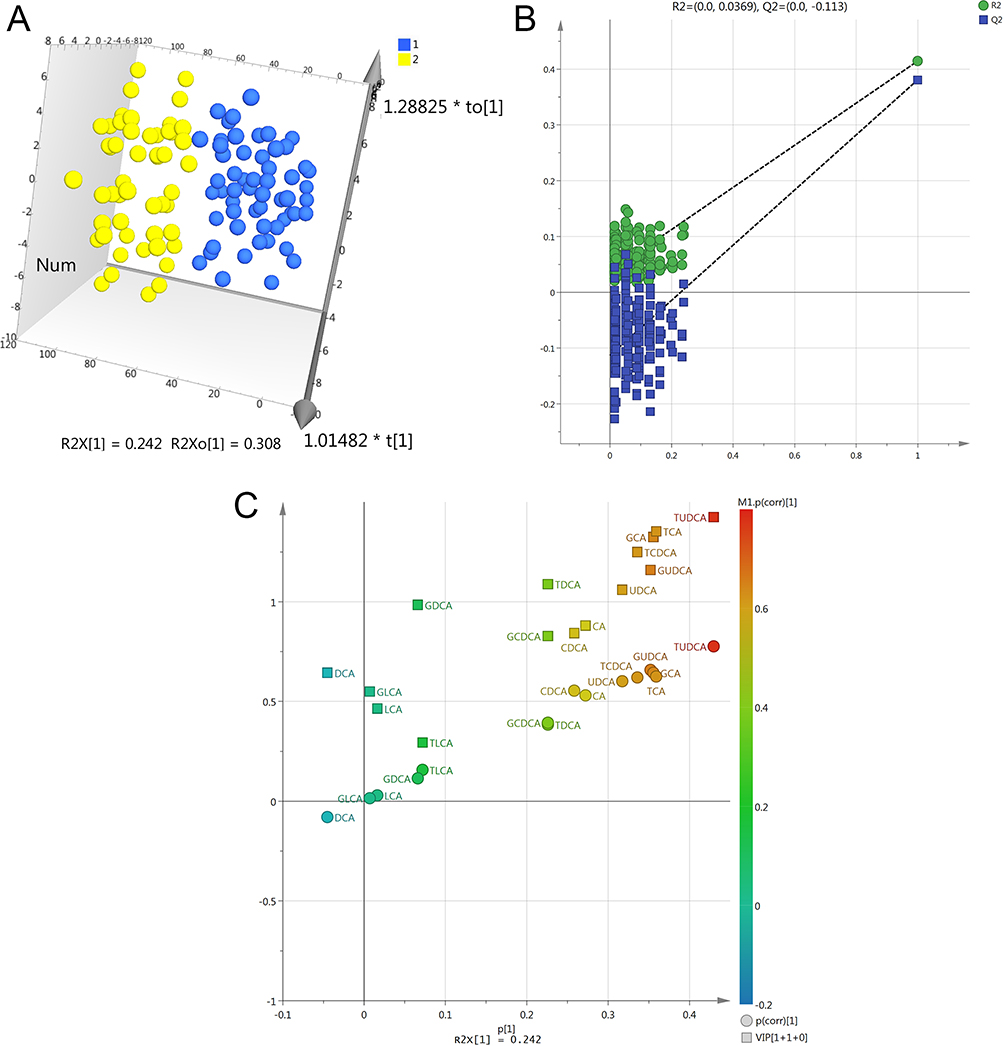 |
Figure 5 (A) OPLS-DA model of bile acid profiles comparing the NAFL group to the AFL group (blue represents the NAFL group; yellow represents the AFL group). (B) Permutation test plot for bile acid profiles comparing the NAFL group to the AFL group. (C) VIP+s-Plot of bile acid profiles comparing the NAFL group to the AFL group. |
Spearman Correlation Analysis
Spearman correlation analysis was conducted between the selected bile acid subtypes and biochemical indicators with NAFL and AFL. A correlation coefficient |r|≥0.4 was used, and the results showed a significant moderate positive correlation between TBIL, DBIL, GGT, TBA, Gly, TUDCA, and the composition of alcoholic fatty liver disease, while BMI showed a moderate negative correlation (see Table 7).
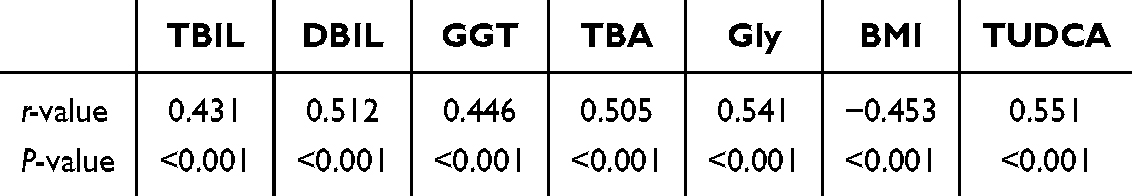 |
Table 7 Spearman Correlation Analysis of Differential Metabolites in NAFL Group and AFL Group |
The Efficacy Analysis of TUDCA and TBA in Differentiating NAFL and AFL
ROC curves were plotted for TUDCA and TBA, and the results are shown in Table 8 and Figure 6. For the diagnostic differentiation between NAFL and AFL, the AUC values for serum TUDCA and TBA were 0.818 and 0.792, respectively. The optimal cutoff points were 36.33 nmol/L for TUDCA and 10.85 nmol/L for TBA. The sensitivity and specificity values were 0.615 and 0.897 for TUDCA, and 0.692 and 0.845 for TBA.
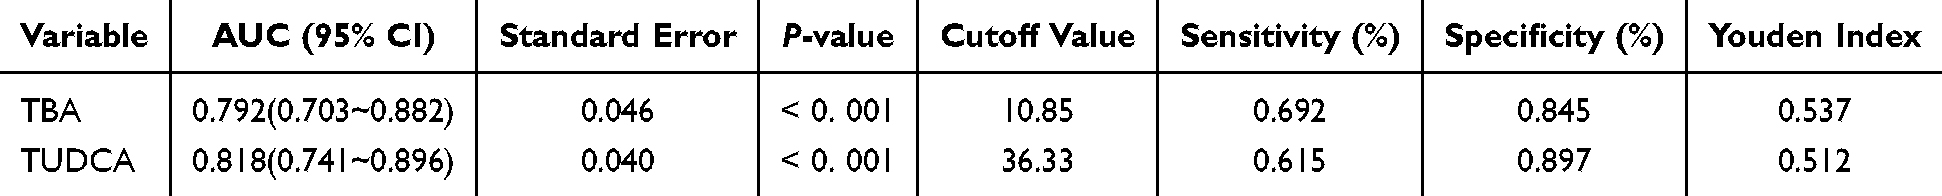 |
Table 8 The Efficacy of TUDCA and TBA in Distinguishing NAFL from AFL |
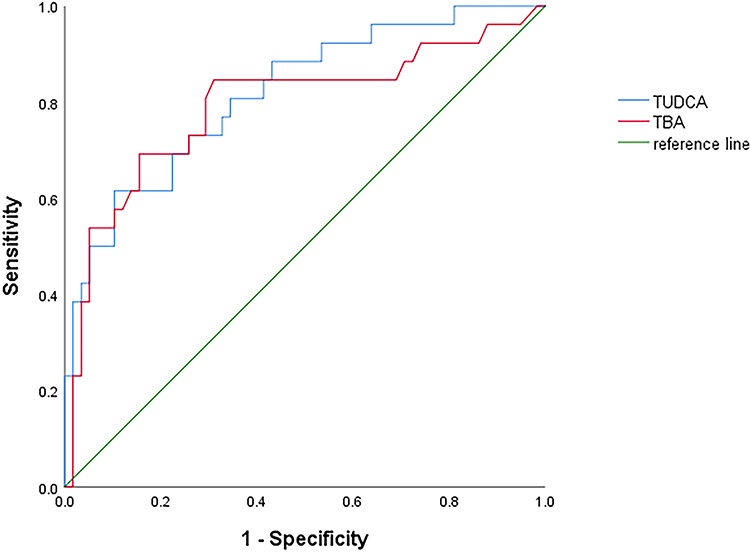 |
Figure 6 ROC curve results for TUDCA and TBA in identifying NAFL and AFL. |
Discussion
With the rising global prevalence of obesity and type 2 diabetes, particularly in China, the incidence and prevalence of NAFLD continue to increase.11–13 The development of NAFLD is strongly associated with metabolic syndrome and type 2 diabetes, conditions that contribute to the progression of liver decompensation, hepatocellular carcinoma, and cardiovascular events. The increase in alcohol consumption has led to a significant rise in alcohol-related liver disease cases. In 2020, approximately 741,300 new cancer cases were attributed to alcohol consumption globally, with around 154,700 liver cancer cases caused by alcohol, making it a major focus for prevention and treatment.14 ALD has become one of the leading causes of cirrhosis in countries such as China, the United States, the United Kingdom, and Mexico.15 Therefore, whether in non-alcoholic liver disease or alcoholic liver disease, identifying metabolic markers and underlying mechanisms during the early stages of the disease, such as during the fatty liver stage, can provide new insights for diagnosis and prevention.
Bile acids are essential components of bile, cholesterol undergoes conversion into primary bile acids within hepatocytes through classical and alternative pathways, and these primary bile acids are subsequently transformed into secondary bile acids by intestinal microbiota. Beyond their role in the digestion and absorption of lipids, various bile acids function as signaling molecules, interacting with bile acid receptors, including the farnesoid X receptor (FXR) and G protein-coupled receptor 5 (TGR5), located in different tissues.
Disruption of FXR has been implicated in hepatic cholestasis, non-alcoholic fatty liver diseases, and hepatocellular carcinoma.16 A further fine regulation of the bile acids pool is due to the membrane-associated G-protein-coupled bile acid receptor 1 also called transmembrane G protein-coupled receptor 5 (TGR5) that modulates the energy homeostasis and glucose metabolism.17 Furthermore, recent findings identify TGR5 as a negative mediator of inflammation18 and liver regeneration.19 Another observation found that chronic alcohol consumption results in increased bile acids pool and decreased excretion of bile acids, hypothesizing that alcohol consumption could impair the enterohepatic circulation.20 Accordingly, a lack of TGR5 was associated with worsening of alcohol-induced liver injury, a phenotype mainly related to intestinal microbiota dysbiosis.21 Apart from creating dysregulation of gut flora, alcohol may down-regulate FXR, which results in increased bile acid synthesis and hepatic bile acid pool.22 In addition, we should also focus on the mechanisms by which bile acids themselves contribute to liver cell damage. Pathways of the bile acids-dependent damage might involve mitochondrial impairment23 and induction of apoptosis entailing epidermal growth factor receptor (EGF-R) activation and EGF-R-dependent CD95 tyrosine phosphorylation, which in turn triggers CD95 membrane targeting and Fas-associated death domain/caspase-8 recruitment.24
These interactions play a critical role in regulating carbohydrate, fat, and energy metabolism in the body, thus playing a role in the formation mechanism of NAFL and AFL.25–27 Current research has identified approximately 72 distinct bile acid subtypes within the human bile acid profile.
Therefore, examining the concentration changes of various bile acid subtypes rather than focusing solely on the changes in total bile acids holds clinical significance for the non-invasive diagnosis evaluation of NAFL and AFL.
Research on alterations in the serum bile acid profiles of patients with NAFL has shown inconsistent results across different studies.28 Studies by Zhou et al found that in individuals with NAFLD, the levels of total BA, CDCA, DCA, GCA, TCA, GDCA, TDCA, GCDCA, TCDCA, and TLCA increase with the severity of NAFLD.29 Conversely, studies by Xie et al and Nimer et al reported significant elevations in the levels of CA, DCA, TCA, TDCA, and TCDCA in patients with NAFLD compared to healthy controls.30,31 Partially consistent with these findings, the present study identified increased concentrations of GCA, TCA and TCDCA in patients with NAFL compared to the control group.
Basic research has demonstrated that TCA can activate the NRF2 signaling pathway, thereby enhancing the antioxidant capabilities of the liver in rats with obesity and type 2 diabetes. This effect is achieved by inhibiting M1-type Kupffer cell polarization and promoting M2-type Kupffer cell polarization, thereby reducing liver inflammation32 Moreover, supplementing with exogenous TCA can modify the gut microbiota and bile acid composition, activate FXR expression, and increase bile acid reabsorption, ultimately regulating bile acid metabolism, and reducing lipid accumulation in the liver.33 Another study suggested that low concentrations of TCA can support cholangiocyte proliferation, contributing to the mitigation of liver damage to some extent. However, high concentrations of TCA (≥ 50 μmol/L) have been reported to directly stimulate the proliferation and activity of hepatic stellate cells (HSCs), leading to increased secretion of various cytokines and chemokines by hepatocytes and cholangiocytes. This process recruits HSCs and activates hepatic progenitor cells, inducing a biliary response and thereby promoting liver fibrosis.34 Consequently, low concentrations of TCA have a protective effect on liver cholangiocytes, whereas high concentrations contribute to the progression of liver fibrosis.
In the current study, the selected participants with NAFL, had not progressed to liver fibrosis or cirrhosis stages. Their TCA levels were recorded at 48.28 (15.1, 173.39) nmol/L, indicating that increased TCA concentrations in the early stages of liver damage may exert a protective effect. Additionally, it has been reported that TCDCA inhibits the expression of the multifunctional intracellular linker protein and co-transcription factor (YAP), along with its downstream target genes, during liver fibrogenesis, thereby alleviating liver fibrosis in animal models.35
In clinical diagnosis, GCA, TCA, and TCDCA all demonstrated higher sensitivity than TBA for diagnosing NAFL, making them more favorable for disease diagnosis. In the case of AFL, an animal study showed that when rats were fed an alcohol-based diet, hydrophobic bile acids (such as CDCA) significantly increased in both the serum and liver, with an elevated proportion of glycine-conjugated bile acids (such as GCDCA), which is consistent with the findings of this study. However, the bile acids with the most significant increase in concentration and statistical significance in this study were TCDCA, TCA, GCA, TUDCA, and GUDCA. Regarding AFL diagnosis, TUDCA showed higher sensitivity than TBA, and TCA and GCA exhibited higher specificity than TBA. When comparing NAFL with AFL, TUDCA levels were higher in AFL than in NAFL, and it had a greater diagnostic significance. The cutoff value for TUDCA was found to be 36.33 nmol/L, with specificity higher than that of TBA, making it useful for differentiating NAFL from AFL.
Conclusion
In conclusion, the findings of this study reveal that alterations in bile acid profiles have changed accordingly in patients with fatty liver. Specifically, in NAFL, the primary bile acids are GCA, TCA, and TCDCA, whereas in AFL, TCDCA, TCA, GCA, TUDCA, and GUDCA are the predominant bile acids, all of which are positively correlated with the disease. This suggests that bile acid metabolism dysregulation plays a significant role in the occurrence and progression of both NAFL and AFL and may be involved in disease diagnosis. However, this study has limitations, such as the lack of histological diagnosis—the pathological gold standard for identifying NAFL and AFL—and a small sample size, which may introduce statistical bias. Further basic experiments are needed to verify how specific bile acid subtypes influence disease progression through related pathways, providing evidence for identifying effective therapeutic targets for NAFL and AFL.
Abbreviations
TBA, Total bile acid; CA, Cholic acid; DCA, Deoxycholic acid; LCA, Lithocholic acid; UDCA, Ursodeoxycholic acid; CDCA, Chenodeoxycholic acid; TCA, Taurocholic acid; TLCA, Taurolithocholic acid; TDCA, Taurodeoxycholic acid; TUDCA, Tauroursodeoxycholic acid; TCDCA, Taurochenodeoxycholic acid; GDCA, Glycodeoxycholic acid; GCDCA, Glycochenodeoxycholic acid; GUDCA, Glycoursodeoxycholic acid; GCA, Glycocholic acid; GLCA, Glycolithocholic acid; FLD, Fatty liver disease; NAFL, Non-alcoholic fatty liver disease; ALD, Alcoholic liver disease; NAFL, Non-alcoholic fatty liver; AFL, Alcoholic fatty liver; TBil, Total bilirubin; DBil, Direct bilirubin; IBil, Indirect bilirubin; ALB, Albumin; ALT, Alanine aminotransferase; AST, Aspartate aminotransferase; ALP, Alkaline phosphatase; GGT, Glutamyltranspeptidase; BMI, Body Mass Index; TC,Total Cholesterol; TG, Triglyceride; IR, Insulin resistance; NASH, Non-alcoholic steatohepatitis; UA, Urea; CR, Creatinine; PT, Prothrombin; AFP, Alpha fetoprotein; HSC, Hepatic stellate cell; UPLC-MS/MS, Ultra performance liquid chromatography-mass spectrometry/mass spectrometry; OPLS-DA, Orthogonal partial least squares-discriminant analysis; PLS, Partial least squares; PCA, Principal component analysis; ROC, Receiver operating characteristic curve; AUC, Area Under Curve.
Data Sharing Statement
The datasets used and/or analyzed during the current study are available from the corresponding author upon reasonable request.
Ethics Approval and Consent to Participate
This study was conducted with approval from the Ethics Committee of Wenzhou People’s Hospital (Approval Number: 2021-266). This study was conducted in accordance with the declaration of Helsinki. Written informed consent was obtained from all participants.
Funding
This study was funded by the Research Project in Wenzhou City Zhejiang Province (Grant Number: Y20210865). The funding body had no role in the design of the study and collection, analysis, and interpretation of data and in writing the manuscript.
Disclosure
The authors declare that they have no conflict of interests.
References
1. Rinella ME, Neuschwander-Tetri BA, Siddiqui MS, et al. AASLD practice guidance on the clinical assessment and management of nonalcoholic fatty liver disease. Hepatology. 2023;77(5):1797–1835. doi:10.1097/HEP.0000000000000323
2. National Workshop On Fatty Liver And Alcoholic Liver Disease Chinese Society Of Hepatology, Chinese Medical Association Fatty Liver Expert Committee Chinese Medical Doctor Association. Guidelines for prevention and treatment of non-alcoholic fatty liver disease (2018 Update). Infect Dis Inform. 2018;31(05):393–402.
3. Jiao N, Baker SS, Chapa-Rodriguez A, et al. Suppressed hepatic bile acid signalling despite elevated production of primary and secondary bile acids in NAFLD. Gut. 2018;67(10):1881–1891. doi:10.1136/gutjnl-2017-314307
4. Safari Z, Gérard P. The links between the gut microbiome and non-alcoholic fatty liver disease (NAFLD). Cell Mol Life Sci. 2019;76(8):1541–1558. doi:10.1007/s00018-019-03011-w
5. Hao M, Zhao MT, Tong HJ, et al. Ultra-performance liquid chromatography-quadrupole/time-of-flight mass spectrometry based bile and urine metabonomics study on the ameliorative effects of curcuma wenyujin rhizoma on acute blood stasis in rats. World J Tradit Chin Med. 2022;8:141–152. doi:10.4103/wjtcm.wjtcm_55_21
6. Ferro D, Baratta F, Pastori D, et al. New insights into the pathogenesis of non-alcoholic fatty liver disease: gut-derived lipopolysaccharides and oxidative stress. Nutrients. 2020;12(9):2762. doi:10.3390/nu12092762
7. Jonas W, Schürmann A. Genetic and epigenetic factors determining NAFLD risk. Mol Metab. 2021;50:101111. doi:10.1016/j.molmet.2020.101111
8. Zhang ZY, Ma CH. Immunomodulatory role of bile acids in hepato-intestinal diseases. J Shandong Uni Med. 2021;59(09):30–36. doi:10.6040/j.issn.1671-7554.0.2021.0924
9. Chiang JY. Bile acid metabolism and signaling. Compr Physiol. 2013;3(3):1191–1212. doi:10.1002/cphy.c120023
10. National Workshop On Fatty Liver And Alcoholic Liver Disease Chinese Society Of Hepatology, Fatty Liver Expert Committee Chinese Medical Doctor Association. Guidelines for prevention and treatment of alcoholic liver disease (2018 Update). J Clin Hepatob Dis. 2018;34(05):939–946. doi:10.3969/j.issn.1672-5069.2018.02.006
11. Cusi K, Isaacs S, Barb D, et al. American association of clinical endocrinology clinical practice guideline for the diagnosis and management of nonalcoholic fatty liver disease in primary care and endocrinology clinical settings: co-sponsored by the American association for the study of liver diseases (AASLD). Endocr Pract. 2022;28(5):528–562. doi:10.1016/j.eprac.2022.03.010
12. Lou TW, Yang RX, Fan JG. The global burden of fatty liver disease: the major impact of China. Hepatobiliary Surg Nutr. 2024;13(1):119–123. doi:10.21037/hbsn-23-556
13. Riazi K, Azhari H, Charette JH, et al. The prevalence and incidence of NAFLD worldwide: a systematic review and meta-analysis. Lancet Gastroenterol Hepatol. 2022;7(9):851–861. doi:10.1016/S2468-1253(22)00165-0
14. Rumgay H, Shield K, Charvat H, et al. Global burden of cancer in 2020 attributable to alcohol consumption: a population-based study. Lancet Oncol. 2021;22(8):1071–1080. doi:10.1016/S1470-2045(21)00279-5
15. Méndez-Sánchez N, Valencia-Rodriguez A, Vera-Barajas A, et al. The mechanism of dysbiosis in alcoholic liver disease leading to liver cancer. Hepatoma Res. 2020;6:5. doi:10.20517/2394-5079.2019.29
16. Stofan M, Guo GL. Bile acids and FXR: novel targets for liver diseases. Front Med. 2020;7:544. doi:10.3389/fmed.2020.00544
17. Kawamata Y, Fujii R, Hosoya M, et al. A G protein-coupled receptor responsive to bile acids. J Biol Chem. 2003;278(11):9435–9440. doi:10.1074/jbc.M209706200
18. Wang YD, Chen WD, Yu D, Forman BM, Huang W. The G-protein-coupled bile acid receptor, Gpbar1 (TGR5), negatively regulates hepatic inflammatory response through antagonizing nuclear factor κ light-chain enhancer of activated B cells (NF-κB) in mice. Hepatology. 2011;54(4):1421–1432. doi:10.1002/hep.24525
19. Guo C, Chen WD, Wang YD. TGR5, Not Only a Metabolic Regulator. Front Physiol. 2016;7:646. doi:10.3389/fphys.2016.00646
20. Lefevre AF, DeCarli LM, Lieber CS. Effect of ethanol on cholesterol and bile acid metabolism. J Lipid Res. 1972;13(1):48–55. doi:10.1016/S0022-2275(20)39435-9
21. Spatz M, Ciocan D, Merlen G, et al. Bile acid-receptor TGR5 deficiency worsens liver injury in alcohol-fed mice by inducing intestinal microbiota dysbiosis. JHEP Rep. 2021;3(2):100230. doi:10.1016/j.jhepr.2021.100230
22. Xie G, Zhong W, Li H, et al. Alteration of bile acid metabolism in the rat induced by chronic ethanol consumption. FASEB J. 2013;27(9):3583–3593. doi:10.1096/fj.13-231860
23. Yerushalmi B, Dahl R, Devereaux MW, Gumpricht E, Sokol RJ. Bile acid-induced rat hepatocyte apoptosis is inhibited by antioxidants and blockers of the mitochondrial permeability transition. Hepatology. 2001;33(3):616–626. doi:10.1053/jhep.2001.22702
24. Reinehr R, Graf D, Häussinger D. Bile salt-induced hepatocyte apoptosis involves epidermal growth factor receptor-dependent CD95 tyrosine phosphorylation. Gastroenterology. 2003;125(3):839–853. doi:10.1016/s0016-5085(03)01055-2
25. Rotman Y, Sanyal AJ. Current and upcoming pharmacotherapy for non-alcoholic fatty liver disease. Gut. 2017;66(1):180–190. doi:10.1136/gutjnl-2016-312431
26. Perino A, Demagny H, Velazquez-Villegas L, Schoonjans K. Molecular physiology of bile acid signaling in health, disease, and aging. Physiol Rev. 2021;101(2):683–731. doi:10.1152/physrev.00049.2019
27. Huang J, Li M, Zhou WJ, et al. Integrated miRNA and mRNA analysis identified potential mechanisms and targets of qianggan extracts in preventing nonalcoholic steatohepatitis. World J Tradit Chin Med. 2022;8:77–86. doi:10.4103/wjtcm.wjtcm_48_21
28. Sun YL, Dai HL. Expression level and clinical significance of bile acid profile in patients with early nonalcoholic fatty liver disease. J Med Res. 2023;52(11):170–174.
29. Zhou Y, Lu W, Yang G, Chen Y, Cao J, Zhou C. Bile acid metabolism and liver fibrosis following treatment with bifid triple viable capsules in nonalcoholic fatty liver disease. Am J Transl Res. 2021;13(12):13485–13497.
30. Xie G, Wang X, Huang F, et al. Dysregulated hepatic bile acids collaboratively promote liver carcinogenesis. Int, J, Cancer. 2016;139(8):1764–1775. doi:10.1002/ijc.30219
31. Nimer N, Choucair I, Wang Z, et al. Bile acids profile, histopathological indices and genetic variants for non-alcoholic fatty liver disease progression. Metabolism. 2021;116:154457. doi:10.1016/j.metabol.2020.154457
32. Tong JH. Effects of taurine and taurocholic acid on oxidative stress and inflammation in liver of obese type 2 diabetic rats. Shenyang Agricultural University. 2022.
33. Xu J, Xie S, Chi S, Zhang S, Cao J, Tan B. Protective effects of taurocholic acid on excessive hepatic lipid accumulation via regulation of bile acid metabolism in grouper. Food Funct. 2022;13(5):3050–3062. doi:10.1039/d1fo04085e
34. Le YB, Wang KH, Zou L. Mechanism of taurocholic acid promoting the development of cirrhosis. J Clin Hepatobil Dis. 2021;37(11):2658–2662.
35. Zhang JW Taurodeoxycholic acid alleviates hepatic fibrosis by inhibiting hepatic stellate cell activation through Hippo/YAP pathway. Huazhong Agricultural University.
 © 2024 The Author(s). This work is published and licensed by Dove Medical Press Limited. The
full terms of this license are available at https://www.dovepress.com/terms
and incorporate the Creative Commons Attribution
- Non Commercial (unported, 3.0) License.
By accessing the work you hereby accept the Terms. Non-commercial uses of the work are permitted
without any further permission from Dove Medical Press Limited, provided the work is properly
attributed. For permission for commercial use of this work, please see paragraphs 4.2 and 5 of our Terms.
© 2024 The Author(s). This work is published and licensed by Dove Medical Press Limited. The
full terms of this license are available at https://www.dovepress.com/terms
and incorporate the Creative Commons Attribution
- Non Commercial (unported, 3.0) License.
By accessing the work you hereby accept the Terms. Non-commercial uses of the work are permitted
without any further permission from Dove Medical Press Limited, provided the work is properly
attributed. For permission for commercial use of this work, please see paragraphs 4.2 and 5 of our Terms.