")
Back to Journals » Journal of Inflammation Research » Volume 16
Clinical Significance of Fibrinogen and Platelet to Pre-Albumin Ratio in Predicting the Prognosis of Advanced Gastric Cancer
Authors Tian H, Liu Z, Zhang Z, Zhang L , Zong Z, Liu J, Ying H , Li H
Received 11 March 2023
Accepted for publication 13 June 2023
Published 2 October 2023 Volume 2023:16 Pages 4373—4388
DOI https://doi.org/10.2147/JIR.S412033
Checked for plagiarism Yes
Review by Single anonymous peer review
Peer reviewer comments 2
Editor who approved publication: Dr Monika Sharma
Huakai Tian,1,* Zitao Liu,2,* Zuo Zhang,3,* Lipeng Zhang,2,* Zhen Zong,2 Jiang Liu,2 Houqun Ying,4 Hui Li5
1Department of General Surgery, First Affiliated Hospital of Nanchang University, Nanchang, 330006, People’s Republic of China; 2Department of Gastrointestinal Surgery, Second Affiliated Hospital of Nanchang University, Nanchang, 330006, People’s Republic of China; 3Department of Obstetrics and Gynecology, Second Affiliated Hospital of Nanchang University, Nanchang, 330006, People’s Republic of China; 4Department of Nuclear Medicine, Jiangxi Province Key Laboratory of Laboratory Medicine, the Second Affiliated Hospital of Nanchang University, Nanchang, 330006, People’s Republic of China; 5Department of Rheumatology and Immunology, First Affiliated Hospital of Nanchang University, Nanchang, 330006, People’s Republic of China
*These authors contributed equally to this work
Correspondence: Hui Li, Department of Rheumatology and Immunology, First Affiliated Hospital of Nanchang University, 17 Yongwai Main Street, Nanchang, 330006, People’s Republic of China, Tel +86-15079108591, Email [email protected] Houqun Ying, Department of Nuclear Medicine, Jiangxi province Key Laboratory of Laboratory Medicine, the Second Affiliated Hospital of Nanchang University, 1 Minde Road, Nanchang, 330006, People’s Republic of China, Tel/Fax +86 791-86300410, Email [email protected]
Objective: The aim of this study was to investigate the clinical significance of Fibrinogen and Platelet to Pre-albumin Ratio(FPAR) in predicting the prognosis of patients with advanced gastric cancer(AGC) and to construct a predictive model.
Methods: We collected clinical data from 489 postoperative patients with AGC. FPAR was divided into high and low groups according to the receiver operating characteristic (ROC) curve. The value of FPAR in predicting the prognosis of progressive gastric cancer was analysed using univariate and multivariable Cox regression analysis and its relationship with clinicopathological features. Finally, the Overall Survival(OS) and recurrence-free survival(RFS) prediction models were constructed and validated using FPAR.
Results: Univariate and multifactorial cox regression analysis showed that grade (P< 0.001), TNM-stage (P< 0.001), chemotherapy (P< 0.001), and FPAR (OR=3.054,95% CI:2.088– 4.467, P< 0.001) were independent risk factors for OS; grade (P=0.021), N-stage (P=0.024), TNM-stage (P=0.033), and FPAR (OR=2.215,95% CI:1.634– 3.003, P< 0.001) were independent risk factors for RFS. Subgroup analysis showed that the FPAR-low group had higher OS and RFS than the FPAR-high group, regardless of the patient’s TNM stage (p< 0.05). However, OS was instead higher in the the stage III-FPAR-low group than in the the stage II-FPAR-high group (p< 0.05), while RFS was not significantly different. Predictive models incorporating FPAR had better predictive performance than those without FPAR, showing wide range of net benefit and AUC. After correction, the 2-year AUC, 3-year AUC and C-index of the OS model were 0.737, 0.756, and 0.746; the 2-year AUC, 3-year AUC, and C-index of the RFS model were 0.738, 0.758, and 0.711.
Conclusion: FPAR levels were associated with prognosis in patients with AGC and could independently predict RFS and OS.
Keywords: advanced gastric cancer, FPAR, overall survival, recurrence-free survival, prognosis
Introduction
Gastric cancer (GC), ranking morbidity fifth and mortality third, is one of the most common malignant tumors of the digestive system.1,2 In recent years, although the incidence of GC has declined, the mortality is on the rise. As we all know, except for early GC, the prognosis of AGC is poor. Although radical surgical resection combined with adjuvant therapy, including targeted, immune and other comprehensive treatments are currently used, the 5-year survival rate of AGC is still less than 50%.3 It has been reported that over 70% of tumour-related deaths in patients with gastric cancer are related to tumour recurrence and metastasis.4 Therefore, accurate judgment of the recurrence and metastasis risk and prognosis of gastric cancer patients will help guide the diagnosis and treatment plan.
It is well known that the development of gastric cancer is an extremely complex process, closely related to systemic inflammation, immunity, nutritional status and other factors.5 It has been shown that inflammation plays an important role in the tumour microenvironment and is closely related to the occurrence, development, infiltration and metastasis of tumors, and various inflammatory markers have been explored to predict tumour prognosis, such as neutrophil-to-lymphocyte ratio (NLR) and platelet-to-lymphocyte ratio (PLR).6–8 In recent years, the Systemic Inflammatory Response Index (SIRI) is a newly developed prognostic index that has been shown to better predict the prognosis of patients with hepatocellular carcinoma, pancreatic cancer and gastric cancer.9–11 On the other hand, various tumors have been reported to be closely related to systemic immune status and coagulation, including fibrinogen (FIB), albumin, pre-albumin, platelets, etc.12–14 It has been shown that reduced levels of albumin and prealbumin in the body will lead to a reduced nutritional status and impaired immune function in patients, thus promoting tumour progression.15,16 FIB increases during tumour development, promoting platelet adhesion and binding to growth factors, accelerating tumour cell adsorption and metastasis.17,18 Fibrinogen to pre-albumin ratio and fibrinogen to albumin ratio have previously been shown to be potential predictive biomarkers for various cancers.19
However, predictive values consisting of a single indicator or two indicators are inevitably influenced by other diseases or organismal states, which can lead to biased predictions. For example, elevated FIB is more often seen in the course of an infection or other inflammatory response, and advanced tumours are often associated with an inflammatory response, but elevated FIB may be due to other inflammatory responses. Pre-albumin is not only associated with malignancy in combination with malnutrition, but often also predicts impaired synthesis in the liver and is associated with liver-related diseases. Therefore, we also need to explore more valid and reliable indicators. This study is the first to investigate the clinical significance of a new biomarker, fibrinogen and platelet to pre-albumin ratio (FPAR), in predicting the prognosis of AGC, and to compare it with previously identified markers.
Methods
Study Population
We collected 489 cases of gastric cancer patients admitted to the Second Affiliated Hospital of Nanchang University from January 2015 to January 2017. Inclusion criteria: (1) pathologically confirmed AGC (In this study, advanced gastric cancer was locally advanced, excluding patients with metastasis.); (2) no pre-operative radiotherapy or immunotherapy; (3) no distant metastases; (4) no patients with severe cardiovascular or cerebrovascular disease, haematological disorders, liver or renal impairment. Exclusion criteria: (1) patients without radical gastrectomy (less than 15 lymph nodes cleared); (2) multiple in situ tumours or residual gastric cancer; (3) patients with infection or insufficient evidence of infection but temperature >38 °C; (4) missing clinical or follow-up data. All patients signed an informed consent form. The Ethics Committee of the Second Affiliated Hospital of Nanchang University approved the study (The Examination and Approval No. Review[2018]No.(104)).
Clinical Data Collection and Follow Up
We collected baseline characteristics including age, sex, tumour size, T-stage, N-stage, grade, chemotherapy, radiotherapy, laboratory data (fibrinogen, monocyte count, pre-albumin, neutrophil count, platelet count, lymphocyte count). All laboratory tests were obtained within 48 hours of the patient’s initial hospitalisation and all tests were completed within two hours of sample collection. The patient’s pathological stage, depth of tumour infiltration and lymph node metastases were determined according to the 8th edition of the AJCC staging of gastric cancer.20 The chemotherapic regimens were classified as follows: single fluorouracil derivative oral anticancer agents such as Capecitabine or Tegafur, Gimeracil, and Oteracil potassium capsules [5-Fluorouracil (5-FU)]; Capecitabine combined with Oxaliplatin regimen (XELOX); combined 5-FU, Leucovorin Calcium, and oxaliplatin regimen (FOLFOX); combined 5-FU and oxaliplatin regimen. Some patients are unable to receive or refuse chemotherapy due to their age, financial situation, poor physical condition, or inability to tolerate it. The indications for radiation therapy:1) Positive surgical margins;2) R0 resection and lymph node dissection <D2 range. According to the radiotherapy guidelines for gastric cancer, the recommended clinical target area is Dt45-50.4Gy at 1.8Gy per session for a total of 25–28 sessions.21
Patients’ conditions are followed up and analysed by telephone follow-ups and access to patient review data. The total duration of follow-up was 36 months, with patient death, loss of follow-up and cessation of follow-up as endpoints. The time from postoperative to recurrence and metastasis, and the survival status and survival time during the follow-up period were recorded and calculated.
Statistical methods
All the statistics were analyzed using R 4.1.0 (Institute for Statistics and Mathematics, Vienna, Austria). The flow of this study is shown in Figure 1. We used the “timeROC” function to plot time-dependent receiver operating characteristic curve for the effect of various markers on OS, to calculate the area under curve(AUC) and to determine the optimal cut-off value for each marker. Markers were divided into high and low groups based on the best cut-off values. Heat maps were drawn for correlation analysis between the variables. Variables include age, sex, tumour size, grade, T-stage, N-stage, TNM-stage, chemotherapy, radiotherapy, SIRI, NLR, PLR, FPAR. The correlation between these variables and the prognosis of AGC was analyzed by univariate, and the meaningful variables were included in multivariable Cox regression analysis, and the independent risk factors affecting OS and RFS were screened out by stepwise backward regression. Kaplan-Meier curves were used to analyse each of the independent risk factors and perform subgroup analysis. The “nomogram” function was used to plot the OS and RFS nomograms. The ROC values of the two forecasting models were calculated using the “survivalROC” package, the “calibration” function calculated the concordance index (C-index) and plot the calibration curve, and the Decision Curve Analysis (DCA), which combines the forecasting performance of the models using three evaluation indicators. We compared the OS and RFS prediction models with and without FPAR values and evaluated them by DCA curves and ROC AUC values. In addition, we used 100 times ten-fold cross-validation for internal validation, evaluated the performance of the model by the area under the ROC curve and the C-index, and visualised the results of the cross-validation. p < 0.05 was defined as statistical significance.
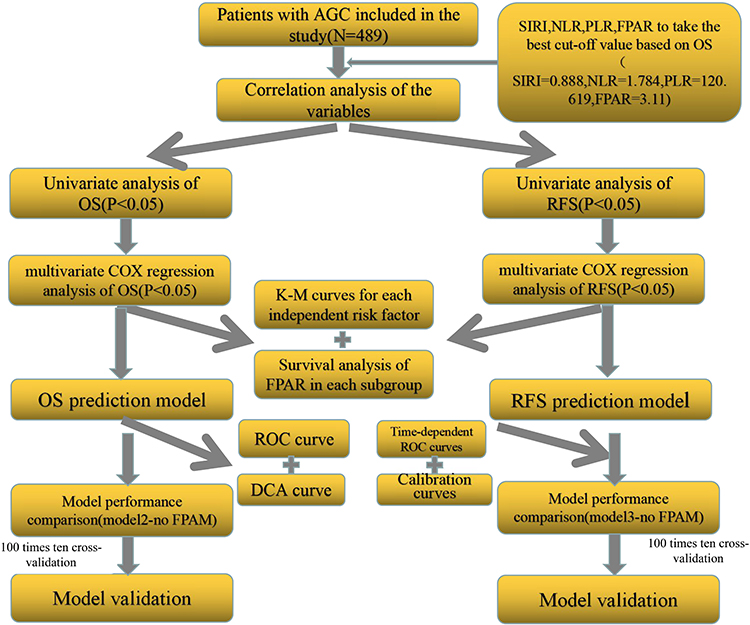 |
Figure 1 Flow chart for this study. |
Results
Baseline Characteristics of the Patients
In this study we included 489 patients with AGC, 58(11.86%) in stage I, 220(44.99%) in stage II and 211(43.15%) in stage III. 385 patients (78.73%) received adjuvant chemotherapy, of which 26 patients received radiotherapy at the same time; 104 patients (21.27%) could not accept or refuse adjuvant chemotherapy due to age, economic situation, and physical tolerance. During the follow-up period, 180 patients developed recurrence and metastasis (36.8%), and 133 patients died (27.2%). The optimal cutoff values for the four markers SIRI, NLR, PLR and FPAR were calculated from the time-dependent ROC and divided into high and low groups. The cutoff values were 0.888, 1.784, 120.619, 3.11. There were 194 cases in the SIRI high-group and 295 cases in the low-group; 329 cases in the NLR high-group and 160 cases in the low-group; 310 cases in the PLR high-group and 179 cases in the low-group; 215 cases in the FPAR high-group and 274 cases in the low-group (Table 1).
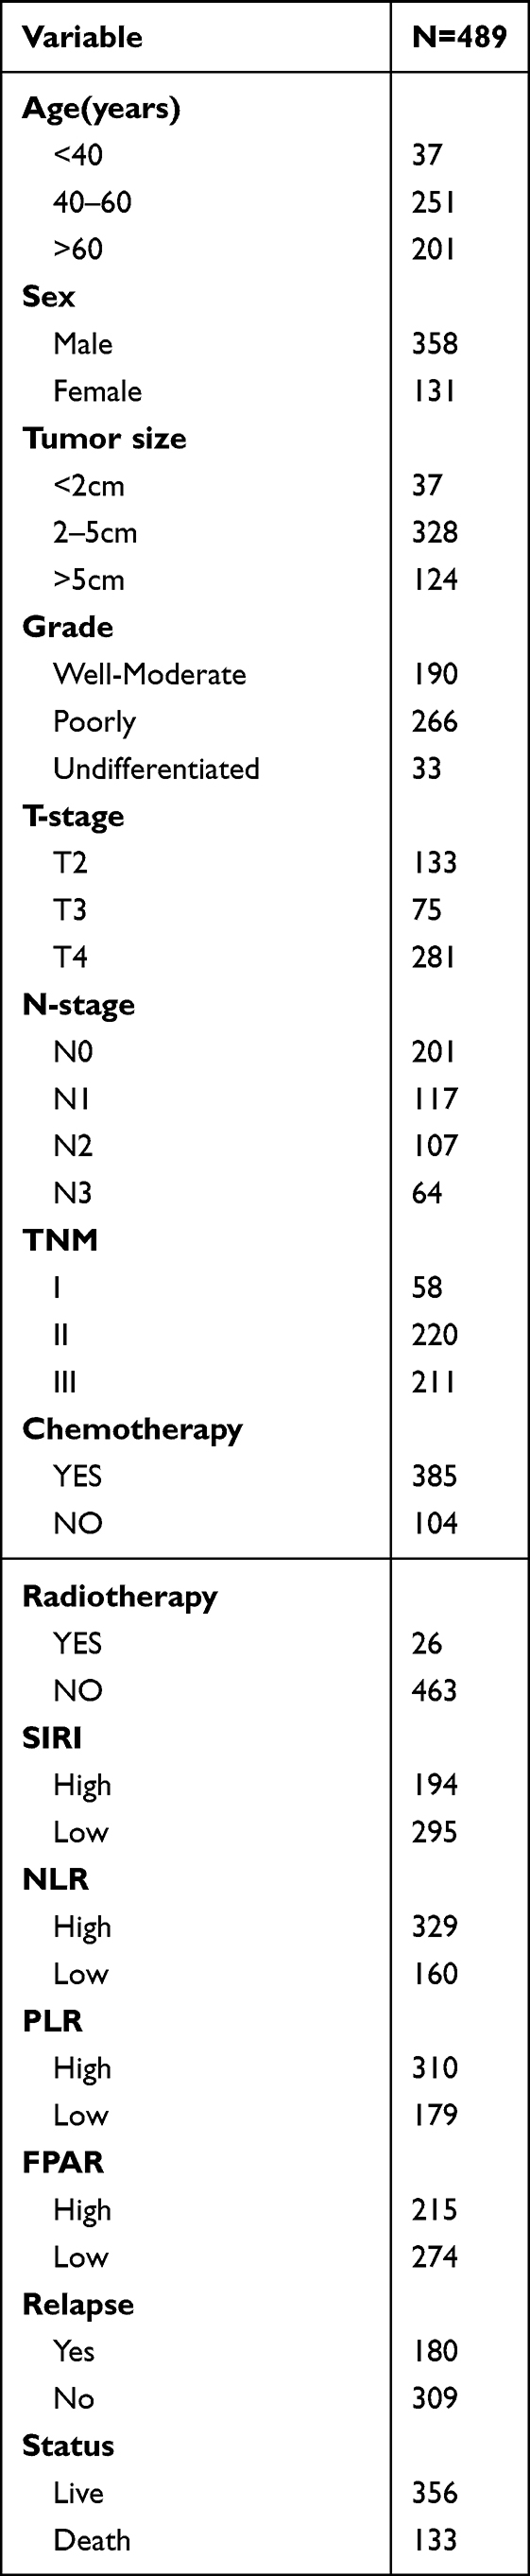 |
Table 1 Baseline Clinicopathological Characteristics of the Enrolled Patients |
Correlation Analysis Between Variables
We conducted a Pearson correlation analysis between the variables (Figure 2). Secondly, the association between FPAR and clinicopathological variables was analysed. The results in Table 2 show that FPAR was associated with age, sex, tumour size, grade and T-stage, but not with N-stage or TNM-stage. Interestingly, we found that the FPAR low-group was more often seen in patients who were young(<60), male, small tumour size(<2cm), well-moderate grade and low tumour infiltration(p<0.05).
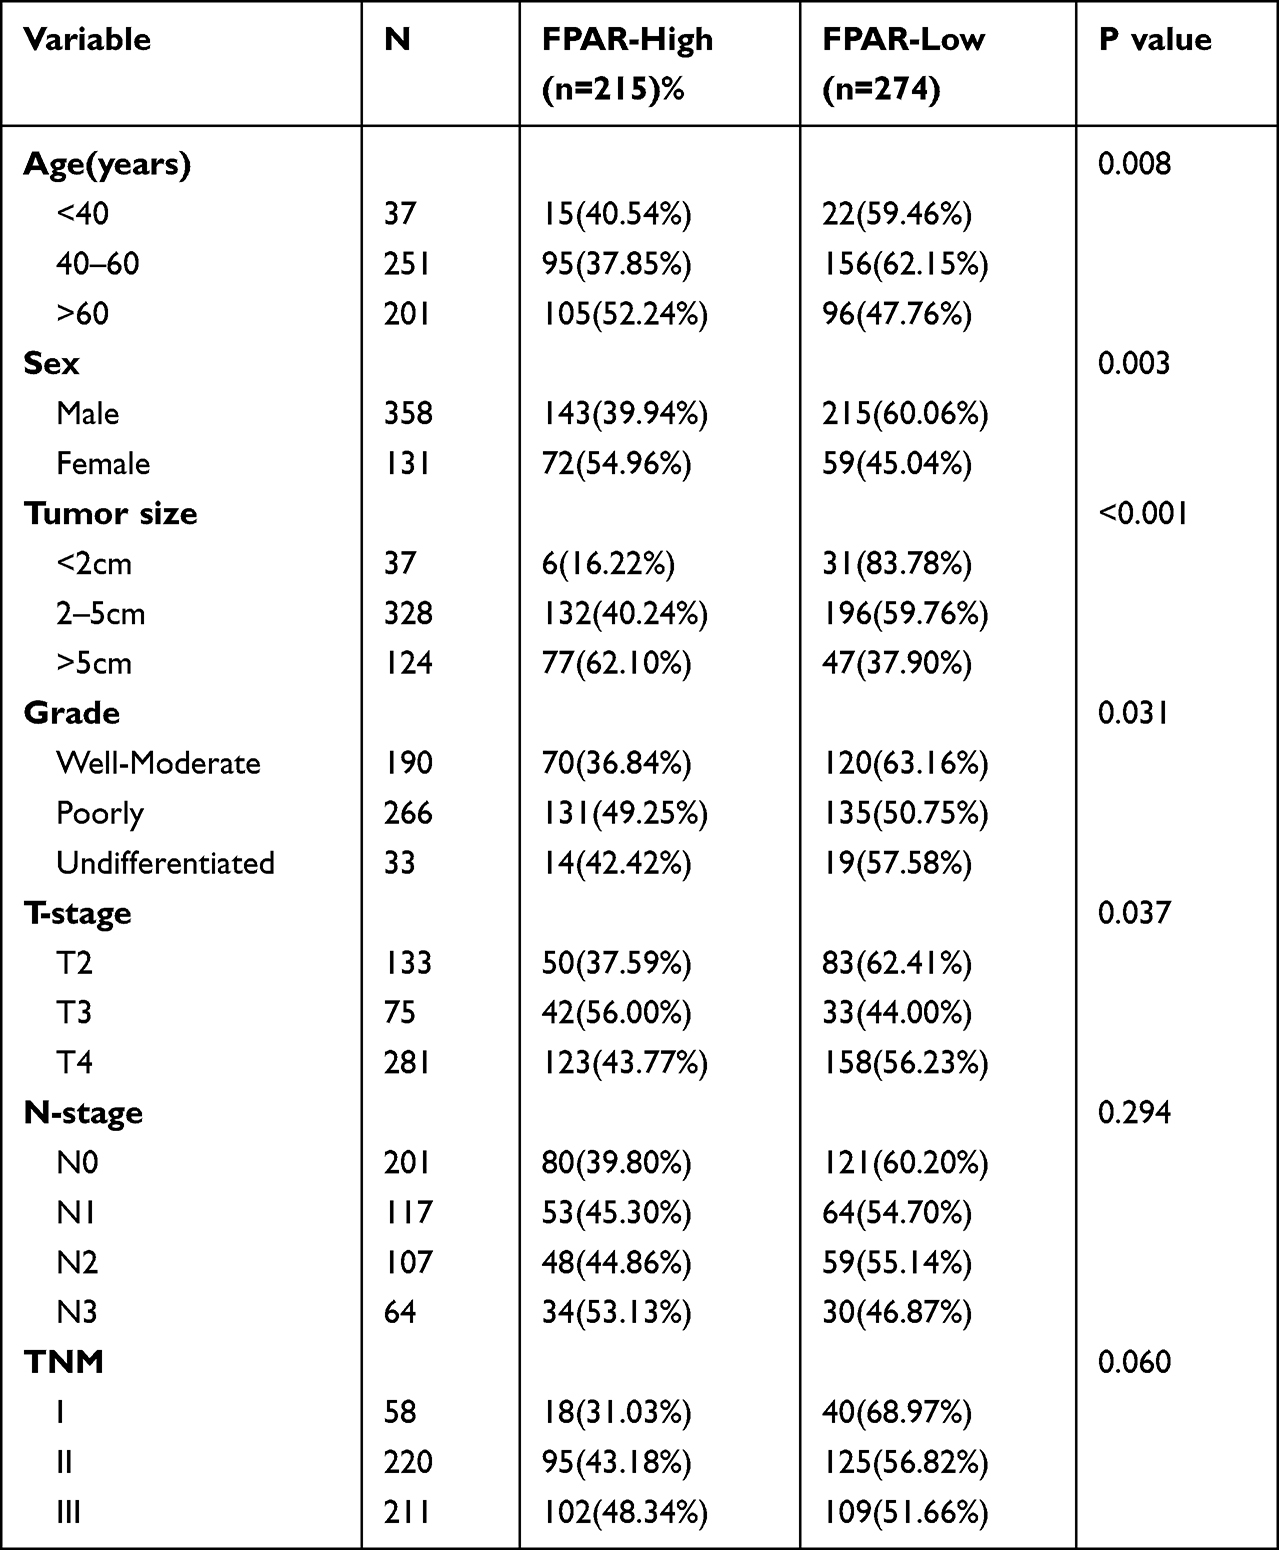 |
Table 2 Association of FPAR with Clinicopathological Features |
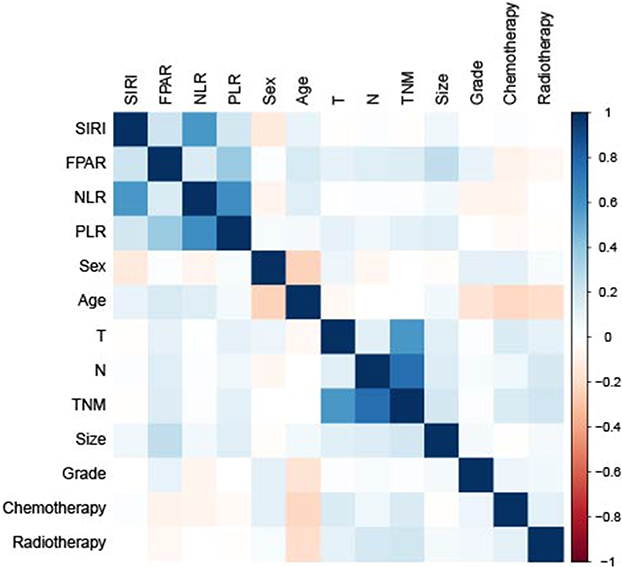 |
Figure 2 Heat map for correlation analysis between variables. |
Univariate and Multivariable Cox Analysis of Prognosis in AGC
Univariate analysis showed that age, tumour size, grade, T-stage, N-stage, TNM-stage, chemotherapy, SIRI, NLR, PLR and FPAR were risk factors for OS (P<0.05); tumour size, grade, T-stage, N-stage, TNM-stage, NLR, PLR and FPAR were risk factors for RFS (P<0.05). Multivariable Cox regression analysis of these risk factors showed that grade (P<0.001), TNM-stage (P<0.001), chemotherapy (P<0.001), and FPAR (OR=3.054,95% CI:2.088–4.467, P<0.001) were independent risk factors for OS(Table 3); grade (P=0.021), N-stage (P0.024), TNM-stage (P=0.033) and FPAR (OR=2.215,95% CI:1.634–3.003, P<0.001) were independent risk factors for RFS(Table 4).
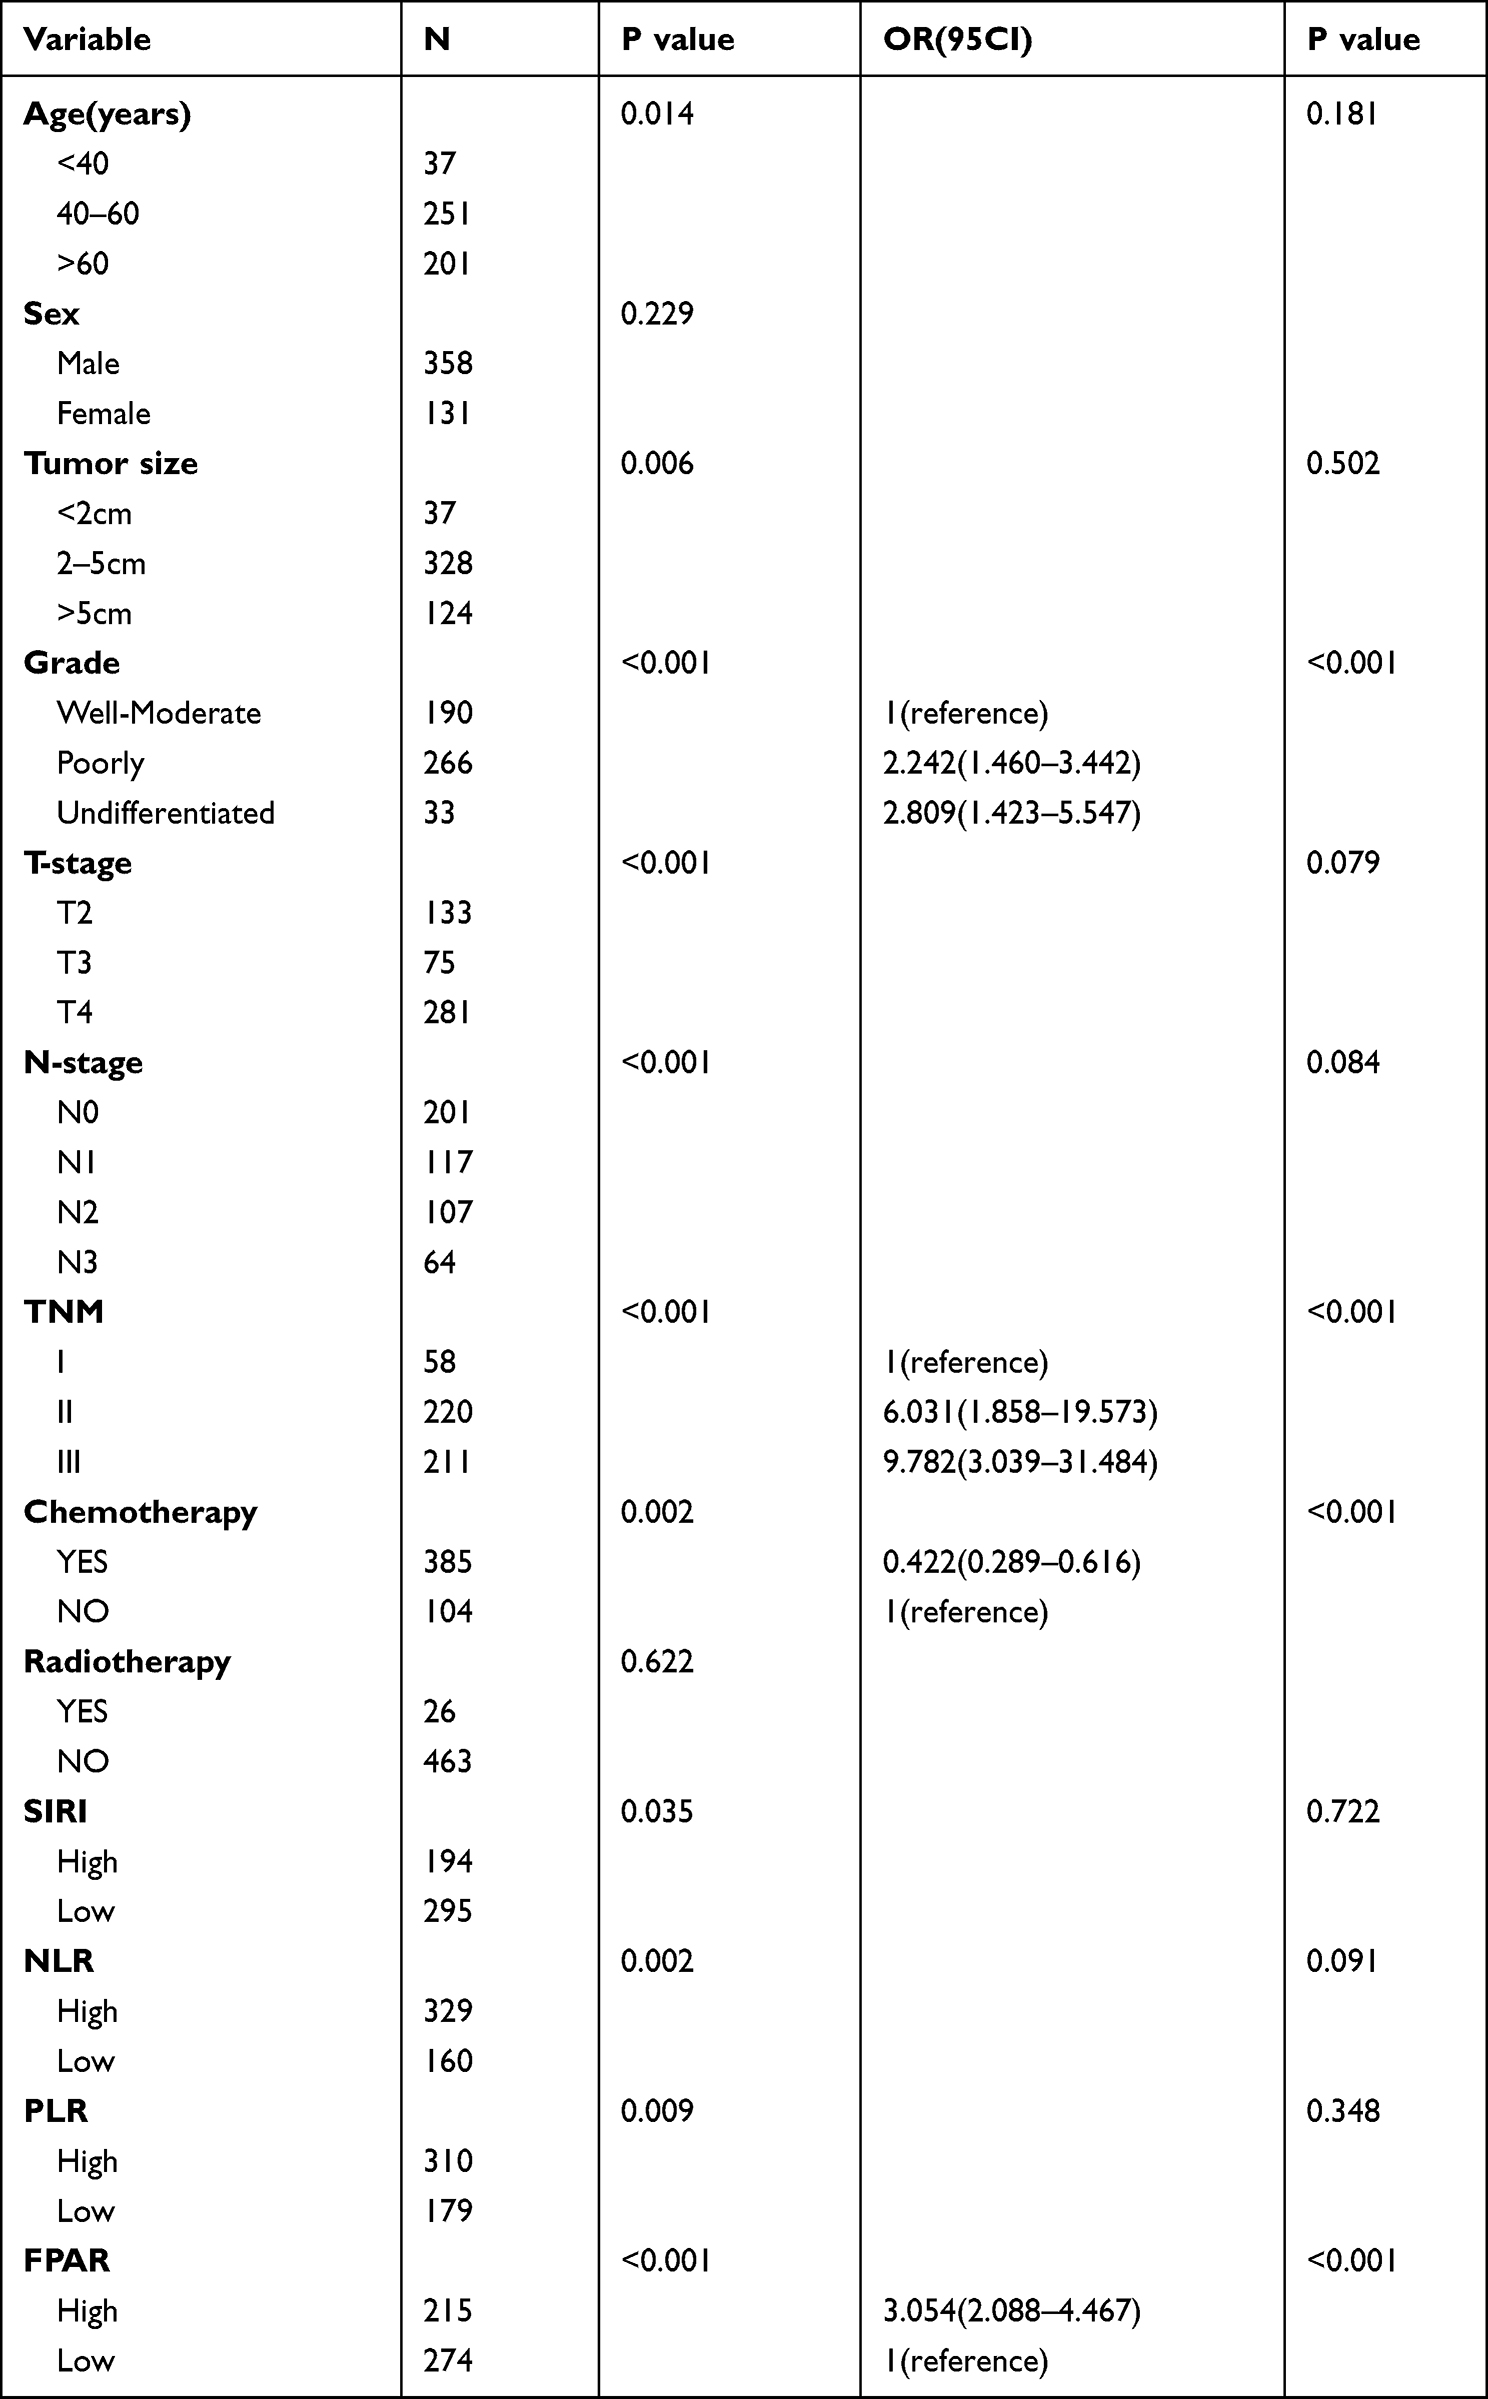 |
Table 3 Univariate and Multivariable Cox Analysis of OS in AGC |
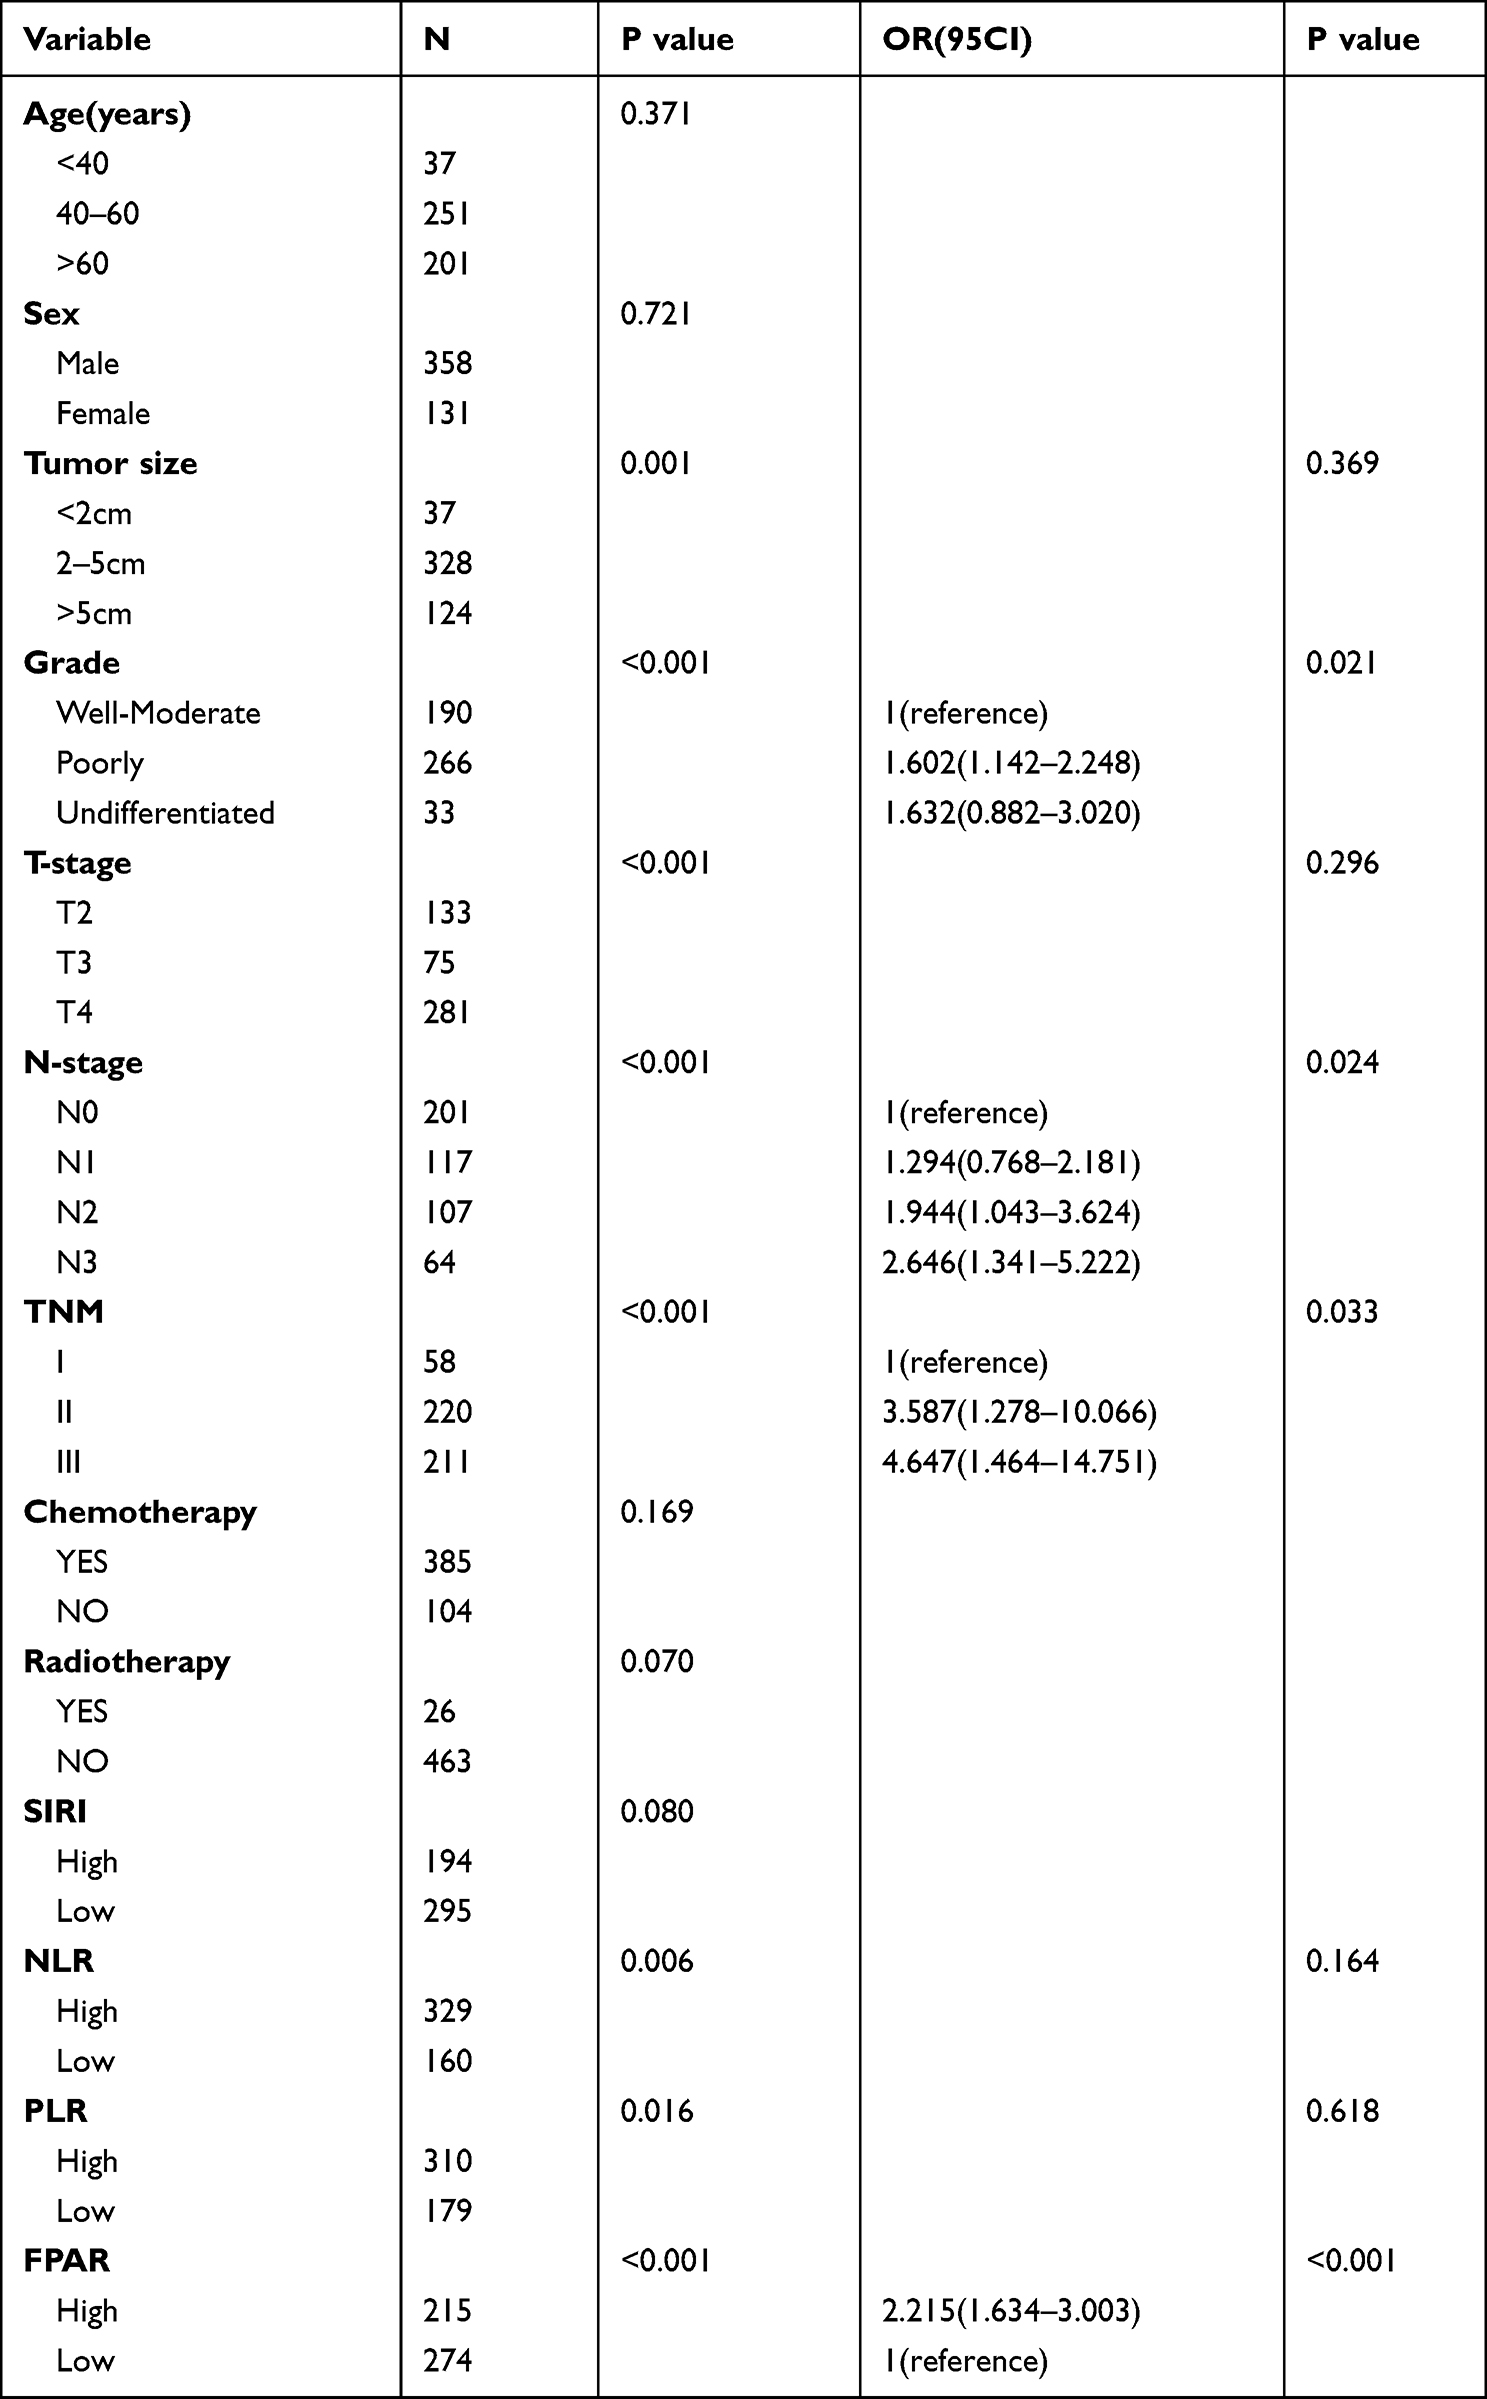 |
Table 4 Univariate and Multivariable Cox Analysis of RFS in AGC |
Impact of FPAR on the Prognosis of AGC
Kaplan-Meier analysis showed that well-moderate grade (P<0.001), stage I (P<0.001), chemotherapy (P=0.0021), N0 (P<0.001) and FPAR low-group (P<0.001) predicted high OS (Figure 3A–E); well-moderate grade (P<0.001), N0 (P<0.001), stage I (P<0.001), and FPAR low-group (P<0.001) predicted high RFS (Figure 3F–I), but chemotherapy was not statistically significant (P=0.17)(Figure 3J). To analyze the performance of FPAR in patients with different TNM stages, we performed a subgroup analysis. The results showed that the FPAR low-group had higher OS and RFS than the FPAR high-group, regardless of the patient’s TNM stage (p<0.05) (Figure 4A and B). Then the patients with stage II and III and FPAR were divided into four groups for further analysis, we found that the OS of the stage-III and FPAR low-group was higher than stage-II and FPAR high-group (Figure 4C), while there was no significant difference between the two groups in RFS (Figure 4D). This suggests that the heterogeneity of FPAR plays an important role in predicting the prognosis of AGC.
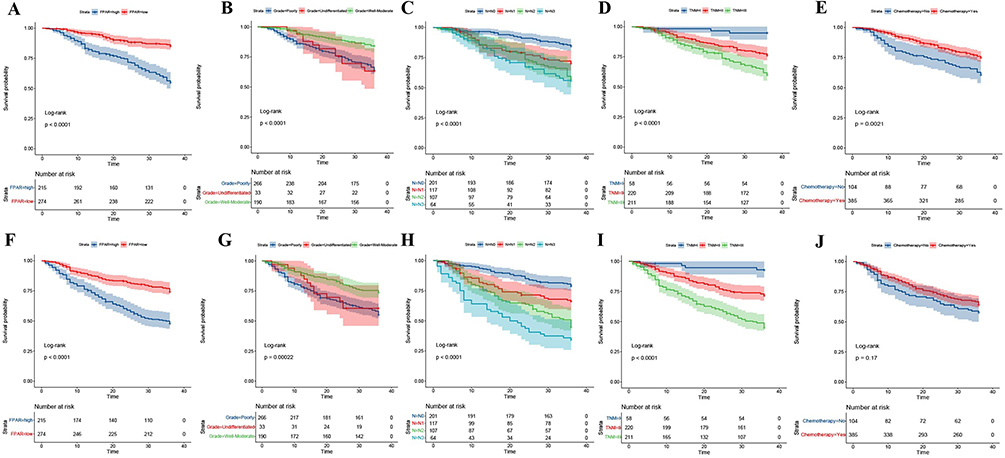 |
Figure 3 Kaplan–Meier curves of OS and RFS in each independent risk factor.(A). K-M curves of OS in FPAR; (B). K-M curves of OS in Grade; (C). K-M curves of OS in N-stage; (D). K-M curves of OS in TNM-stage; (E). K-M curves of OS in chemotherapy; (F). K-M curves of RFS in FPAR; (G). K-M curves of RFS in Grade; (H). K-M curves of RFS in N-stage;(I). K-M curves of RFS in TNM-stage; (J). K-M curves of RFS in chemotherapy). |
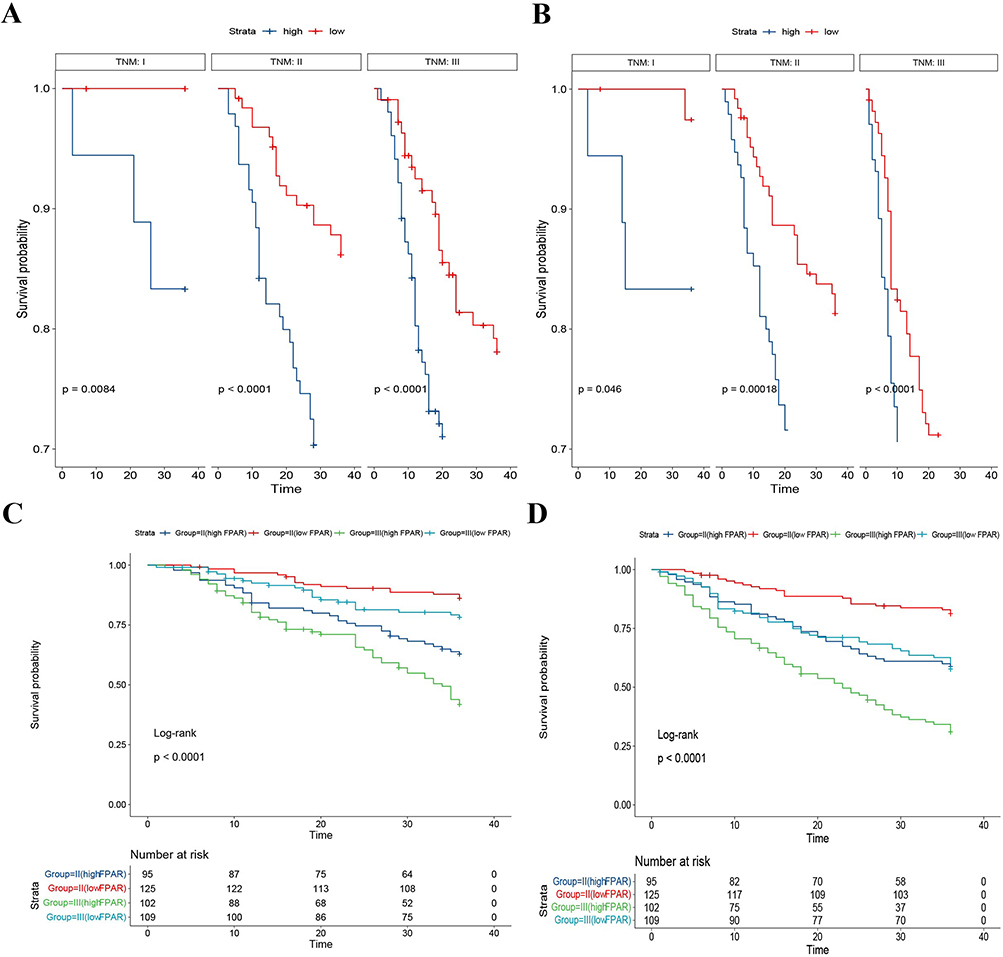 |
Figure 4 Kaplan–Meier curve of OS and RFS in each subgroup(A). FPAR for OS in TNM-stage; (B). FPAR for RFS in TNM-stage; (C). OS in stage II and III FPAR patients; (D). RFS in stage II and III FPAR patients). |
Establishment and Validation of OS and RFS Prediction Models
Based on the above results we constructed the OS and RFS prediction models. The OS prediction model included four independent risk factors: grade, TNM-stage, chemotherapy, and FPAR (Figure 5A). The RFS prediction model included four independent risk factors: grade, N-stage, TNM-stage, and FPAR (Figure 5B). The prediction model assigned a weighting to each risk factor, with the total score corresponding to 1-year, 2-year and 3-year OS and RFS. Each variable in the column line graph was assigned a weighted score, and the scores for each variable were summed to give the patient’s individualised total score. Higher total score corresponded to a lower probability of survival at 1, 2 and 3 years. It was easy to see that the weight of the FPAR variable in the OS was higher than that of chemotherapy and comparable to that of the grade; the weight of the FPAR variable in the RFS was even higher than that of the grade. The calibration curves showed good agreement between the prediction model’s predicted prognosis and the actual probability (Figure 6A–D). The 2-year and 3-year AUC of the OS model were 0.749 and 0.807(Figure 6C); The 2-year and 3-year AUC of the RFS model were 0.751 and 0.774(Figure 6F). We also plotted DCA curves and the results showed that the OS and RFS prediction models had good decision making ability (Figure 6B–E). To avoid overfitting the model, 100 ten-fold cross-validations were performed and the results were visualised (Figure 7). After correction, the 2-year AUC, 3-year AUC and C-index of the OS model were 0.737, 0.756, and 0.746; the 2-year AUC, 3-year AUC, and C-index of the RFS model were 0.738, 0.758, and 0.711(Table 5).
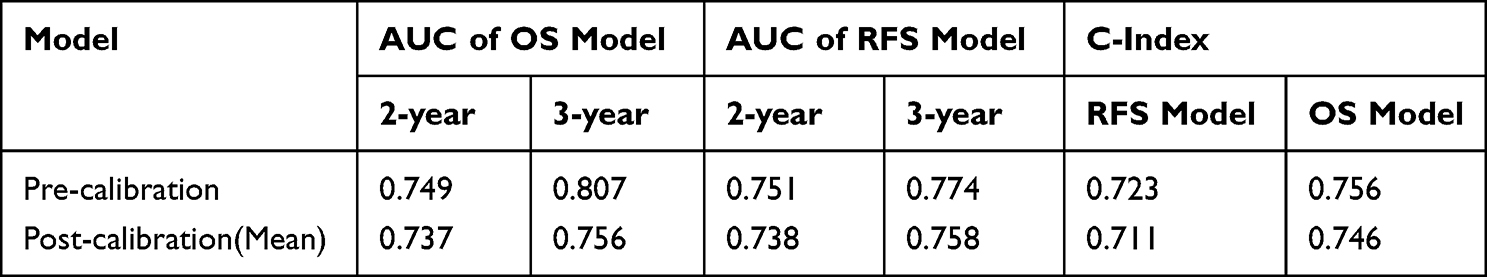 |
Table 5 Before and After Evaluation of 100 Cross-Validations of the Model |
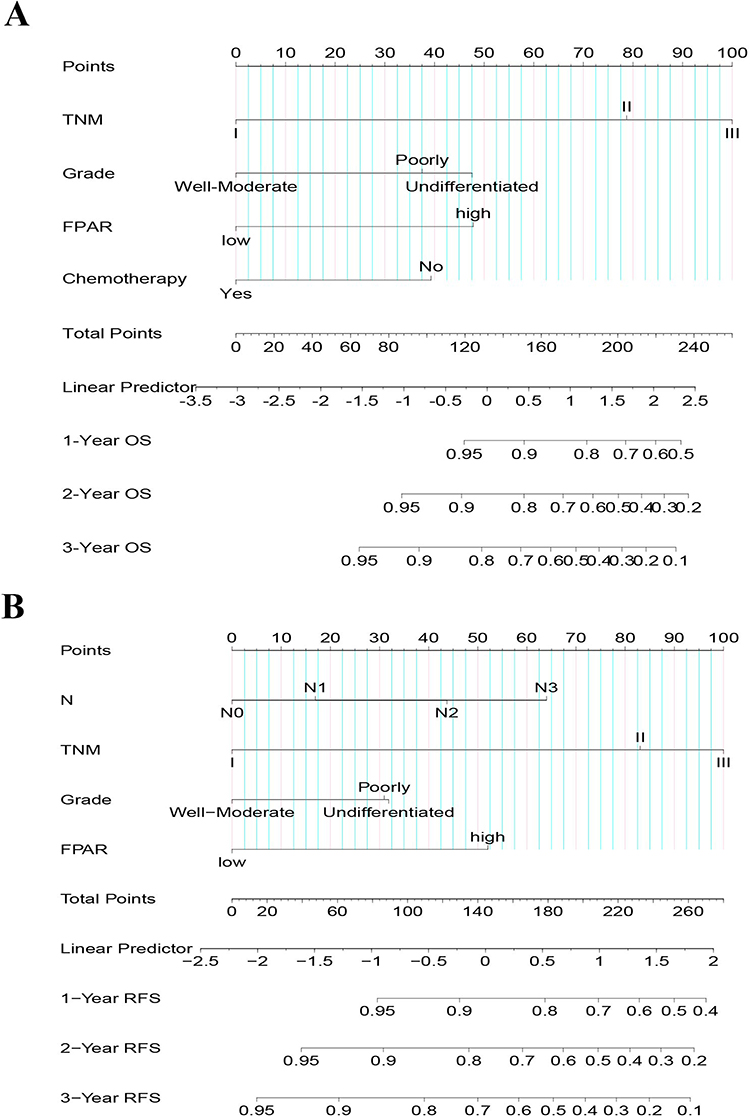 |
Figure 5 Prognostic nomograms with FPAR for predicting survival of AGC patient.(A). OS prediction model; (B). RFS prediction model). |
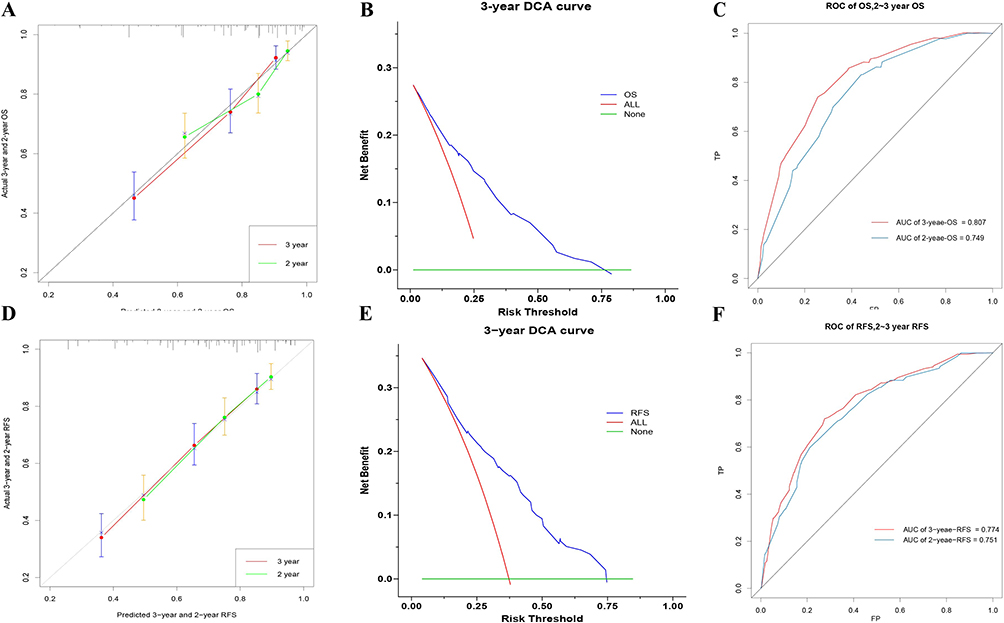 |
Figure 6 Evaluation of predictive models with calibration curves, DCA, ROC(A). Calibration curves for OS prediction models; (B). DCA for OS prediction models; (C). ROC for OS prediction models; (D). Calibration curves for RFS prediction models; (E). DCA for RFS prediction models; (F). ROC for RFS prediction models). |
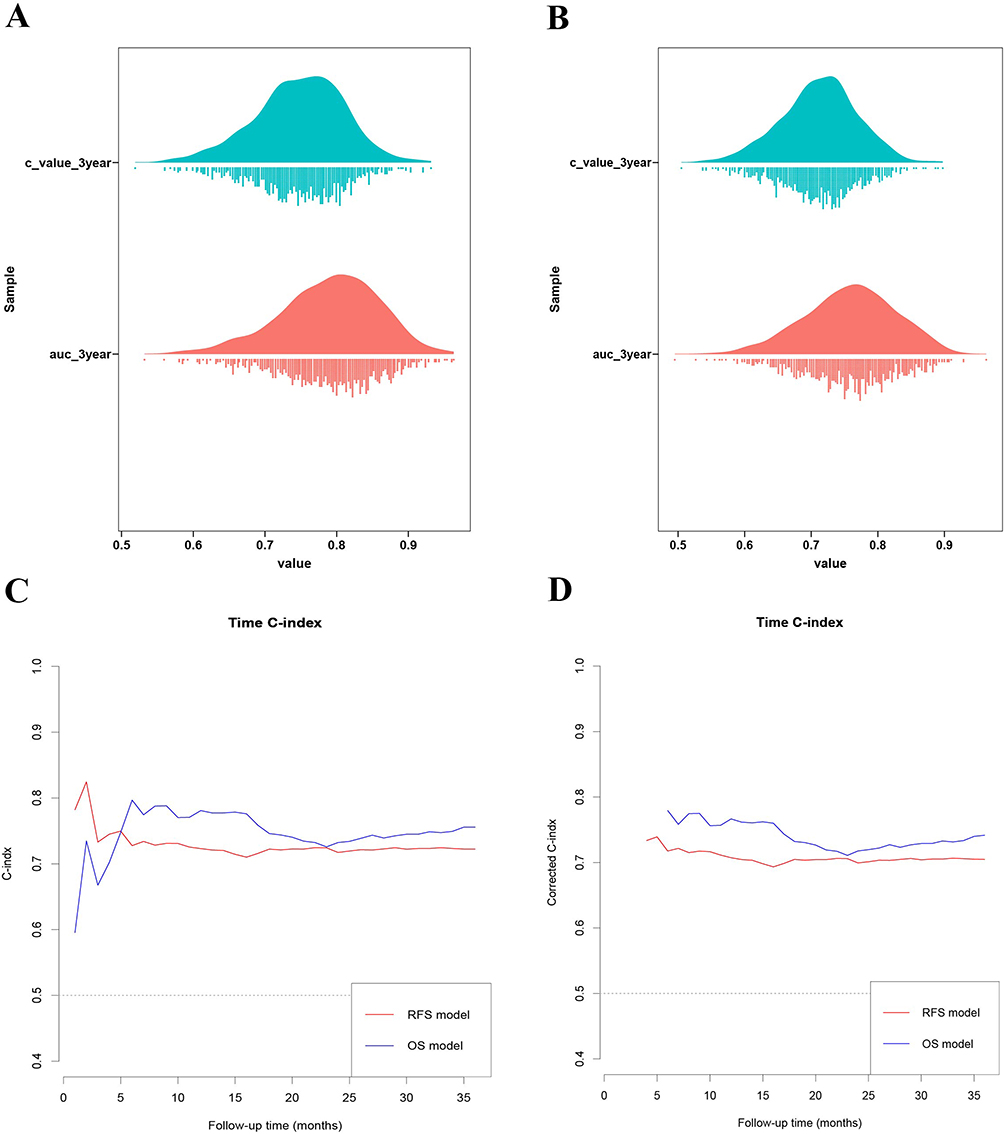 |
Figure 7 Visualisation of cross-validation results for predictive models,(A). OS predictive model cross-validation visualisation of cloud and rain plots; (B). RFS predictive model cross-validation visualisation of cloud and rain plots; (C). C-index before correction for OS and RFS prediction models; (D). C-index after correction for OS and RFS prediction models). |
In addition, we constructed prognostic models (OS-model2, RFS-model3) without FPAR and compared with the OS and RFS prediction models with FPAR. The results showed that the prediction model incorporating FPAR had better predictive efficacy (Figure 8).
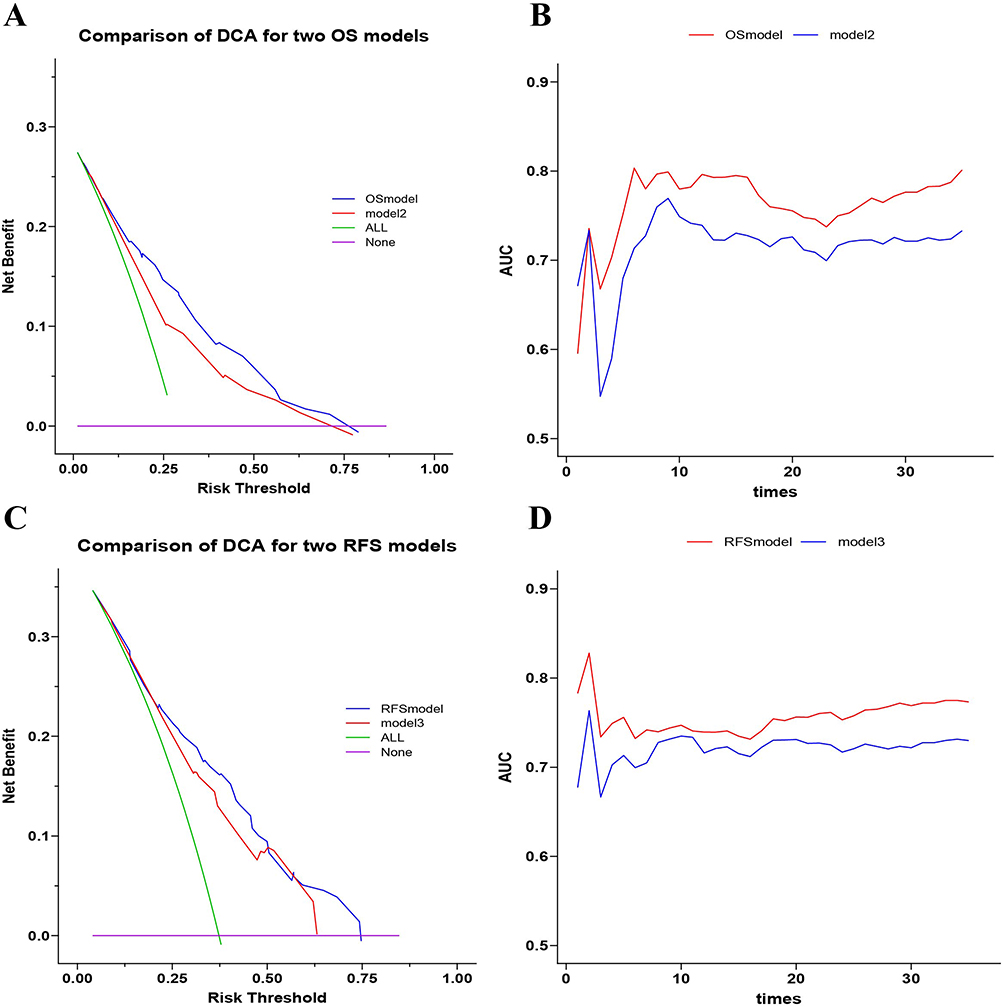 |
Figure 8 Evaluation of prognostic nomograms with or without FPAR for predicting survival of AGC patient.(A). Comparing DCA of OS model and model2; (B). Comparing ROC AUC of OS model and model2; (C). Comparing DCA of RFS model and model3; (D). Comparing ROC AUC of RFS model and model3). (model2-OS without FPAR;model3-RFS without FPAR). |
Discussion
Gastric cancer is one of the most common gastrointestinal malignancies and has a higher recurrence and mortality rate compared to bowel cancer. In recent years, the treatment of gastric cancer has become more standardised and individualised, with radical surgical resection combined with post-operative adjuvant therapy resulting in a significant increase in prognostic survival. However, the rate of recurrence and metastasis and mortality of gastric cancer is still high. Therefore, it is a valuable study to accurately predict the risk of recurrence and survival prognosis of patients undergoing radical surgical resection for gastric cancer.
In this study we have identified a new predictor--FPAR. In contrast to previous studies, SIRI, NLR and PLR were not independent risk factors for OS and RFS in patients with AGC, and FPAR became the only independent predictive marker in this study.22,23 It is possible, as stated in the introduction, that some of the existing indicators may be biased in predicting survival prognosis in gastric cancer and more clinical data are needed to support this. FIB is a coagulation factor synthesised by the liver and is mainly involved in the body’s blood clotting process. In recent years, it has been found that FIB also participates in the development and metastasis of tumours. During the development of malignant tumours, the infiltration and metastasis of tumour cells leads to damage and rupture of surrounding normal cells and blood vessels, releasing large amounts of pro-coagulant substances and cytokines, together with pro-adhesive molecules secreted by the tumour cells themselves, the coagulation activity of the body is significantly increased, prompting rapid growth of FIB.24 The significantly increased levels of FIB can bind to vascular endothelial growth factor and fibroblast growth factor, promoting proliferation, adhesion and metastasis of malignant tumour cells.25 In addition, patients with malignant tumours are often associated with malnutrition. On the one hand, due to the genetic mutation and malignant proliferation of tumour cells, they consume a lot of energy during the development process. On the other hand, tumour cells can stimulate the body to produce a large amount of inflammatory factors and tumour necrosis factors, which inhibit protein synthesis, resulting in hypoproteinemia in patients.26 Both albumin and prealbumin are indicators to assess nutritional status and immune status. However, due to its shorter half-life, pre-albumin is a more accurate reflection of the nutritional and immune status of the body. Malnutrition, post-operative complications, and hypoproteinemia have been shown to be associated with poor prognosis in gastric cancer.27 We know that the development of tumours is a complex process in which the systemic inflammatory response, immunity, coagulation system and nutritional status interact and influence each other. The FPAR discussed in this study is a new predictor, and it is reasonable to predict the prognosis of postoperative recurrence and survival of GC. Our findings suggest that the FPAR high-group predicts low OS and RFS. It is well known that with advancing age and tumor progression, patient prognosis worsens. In our study, we found that FPAR increased with increasing patient age, deeper tumour infiltration and larger tumour size. This trend is consistent with the findings of most studies. This finding may be able to guide intraoperative lymph node dissection based on the patient’s preoperative FPAR value. Meanwhile, the results of our subgroup analysis revealed that the OS of the stage-III and FPAR low-group was higher than stage-II and FPAR high-group, while there was no significant difference between the two groups in RFS. This suggests that the heterogeneity of FPAR plays a large role in predicting the prognosis of AGC.
In addition to FPAR, our predictive model included other clinicopathological factors. In this study, grade, TNM-stage, and chemotherapy were independent risk factors for OS in patients with AGC. However, tumor size, T-stage, and N-stage were not associated with OS, which seemed to be somewhat different from previous studies. The grade, N-stage and TNM-stage were independent risk factors affecting RFS in patients with progressive gastric cancer; tumour size, T-stage and chemotherapy were not associated with RFS. Tumor cells are mostly formed due to gene mutation of normal tissue cells. According to the degree of cell differentiation, tumor cells were divided into four grades: well, medium, low, and undifferentiated. And the lower the degree of differentiation, the more likely they were to proliferate and metastasize, giving the host a poor prognosis.28 The TNM-stage reflected the progression of the tumour. As the disease progresses, tumour cells continued to proliferate, infiltrate and metastasise, and the patient’s prognosis was poor.29 A large number of studies have shown that combined adjuvant therapy for patients with radical gastric cancer after surgery can significantly improve the prognosis of patients. After adjuvant chemotherapy, it can effectively remove residual tumor cells that may exist in the body.30 This is not quite the same as our findings, where chemotherapy improved patient OS but not RFS. Perhaps the heterogeneity of results is caused by the inconsistency of our chemotherapy regimens.31
In this study, a predictive model for OS and RFS in patients with AGC after surgery was constructed and internally validated using FPAR combined with clinicopathological factors. Meanwhile, in order to further study the effect of FPAR on the prediction model, we compared the performance with the prediction model that did not incorporate FPAR. The results showed that FPAR was able to greatly improve the predictive efficacy of the prediction model, exhibiting wide range of net benefit and AUC values. DCA is a new indicator of clinical predictive efficacy that focuses more on the net benefit of a statistical method than the specificity and accuracy that ROC focuses on. dCA is able to find a method with the greatest net benefit by avoiding to some extent the effects of false positives and false negatives on the results.32,33 This suggests that FPAR was a highly effective predictor of OS and RFS in AGC than single indicators or clinicopathological indicators.
Although this study discovered a novel predictive marker-FPAR and constructed a predictive model for postoperative OS and RFS in AGC, there were still some potential deficiencies in our study. First, our study was a single-center study, and there was an unavoidable selection bias in the selection of samples. Second, the inconsistency and diversity of chemotherapy regimens in our sample may have contributed to the heterogeneity of our results. Finally, although the prediction model we established had been internally verified and calibrated and had good predictive performance, it lacked external data validation and could not evaluate the generalization ability of the model. Therefore, we need to conduct a large sample and multi-centre study to further determine the accuracy and generalisation ability of our prediction model.
In conclusion, FPAR was an independent prognostic factor for patients with progressive gastric cancer. Moreover, the prognostic prediction models constructed on the basis of FPAR were more accurate and effective compared to single clinicopathological factors.
Abbreviations
FPAR, Fibrinogen and platelet to pre-albumin ratio, FPAR= (Fibrinogen*Platelet count)/pre-Albumin; SIRI, Systemic inflammation response index, SIRI= Neutrophil count * Monocyte count/Lymphocyte count; NLR, Neutrophil to lymphocyte ratio; PLR, Platelet count and the lymphocyte absolute value ratio; OS, Overall survival; RFS, Recurrence-free survival; AGC, Advanced gastric cancer; DCA, Decision curve analysis; C-index, Concordance index.
Funding
This research was financially supported by the National Natural Science Foundation of China (Grant Number: 82060453 and 82103645 and 82260596);Training Plan for Academic and Technical Young Leaders of Major Disciplines in Jiangxi Province(Grant Number: 20204BCJ23021);TCM scientific research project of Jiangxi Provincial Health and Family Planning Commission(Grant Number: 2018B038);Research subject of educational reform of Nanchang University(NCUJGLX-2022-160-96) and Science and Technology Program of Jiangxi Provincial Health and Wellness Commission (202310221).
Disclosure
The authors declare no competing interests in this work.
References
1. Bray F, Ferlay J, Soerjomataram I, et al. Global cancer statistics 2018: GLOBOCAN estimates of incidence and mortality worldwide for 36 cancers in 185 countries. CA Cancer J Clin. 2018;68(6):394–424. doi:10.3322/caac.21492
2. Balakrishnan M, George R, Sharma A, et al. Changing trends in stomach cancer throughout the world. Curr Gastroenterol Rep. 2017;19(8):36. doi:10.1007/s11894-017-0575-8
3. Spolverato G, Capelli G, Lorenzoni G, et al. Development of a prognostic nomogram and nomogram software application tool to predict overall survival and disease-free survival after curative-intent gastrectomy for gastric cancer. Ann Surg Oncol. 2022;29(2):1220–1229. doi:10.1245/s10434-021-10768-7
4. Chiang CY, Huang KH, Fang WL, et al. Factors associated with recurrence within 2 years after curative surgery for gastric adenocarcinoma. World J Surg. 2011;35(11):2472–2478. doi:10.1007/s00268-011-1247-8
5. Choi Y, Kim JW, Nam KH, et al. Systemic inflammation is associated with the density of immune cells in the tumor microenvironment of gastric cancer. Gastric Cancer. 2017;20(4):602–611. doi:10.1007/s10120-016-0642-0
6. Kim EY, Song KY. The preoperative and the postoperative neutrophil-to-lymphocyte ratios both predict prognosis in gastric cancer patients. World J Surg Oncol. 2020;18(1):293. doi:10.1186/s12957-020-02059-4
7. Miyamoto R, Inagawa S, Sano N, et al. The neutrophil-to-lymphocyte ratio (NLR) predicts short-term and long-term outcomes in gastric cancer patients. Eur J Surg Oncol. 2018;44(5):607–612. doi:10.1016/j.ejso.2018.02.003
8. Gu X, Gao XS, Cui M, et al. Clinicopathological and prognostic significance of platelet to lymphocyte ratio in patients with gastric cancer. Oncotarget. 2016;7(31):49878–49887. doi:10.18632/oncotarget.10490
9. Chen L, Chen Y, Zhang L, et al. In gastric cancer patients receiving neoadjuvant chemotherapy systemic inflammation response index is a useful prognostic indicator. Pathol Oncol Res. 2021;27:1609811. doi:10.3389/pore.2021.1609811
10. Xin Y, Zhang X, Li Y, et al. A Systemic Inflammation Response Index (SIRI)-based nomogram for predicting the recurrence of early stage hepatocellular carcinoma after radiofrequency ablation. Cardiovasc Intervent Radiol. 2022;45(1):43–53. doi:10.1007/s00270-021-02965-4
11. Pacheco-Barcia V, Mondejar SR, France T, et al. A systemic inflammation response index (SIRI) correlates with survival and predicts oncological outcome for mFOLFIRINOX therapy in metastatic pancreatic cancer. Pancreatology. 2020;20(2):254–264. doi:10.1016/j.pan.2019.12.010
12. Ding P, Zheng C, Cao G, et al. Combination of preoperative plasma fibrinogen and AJCC staging improves the accuracy of survival prediction for patients with stage I-II gastric cancer after curative gastrectomy. Cancer Med. 2019;8(6):2919–2929. doi:10.1002/cam4.2086
13. Zhang L, Qin S, Lu L, et al. Diagnostic value of combined prealbumin-to-fibrinogen and albumin-to-fibrinogen ratios in Hp-negative gastric cancer. Int J Biol Markers. 2022;37(1):66–73. doi:10.1177/17246008211072875
14. Wang J, Zhang M, Zhou T, et al. Role of platelet infiltration as independent prognostic marker for gastric adenocarcinomas. J Clin Lab Anal. 2020;34(8):e23320. doi:10.1002/jcla.23320
15. Kuroda D, Sawayama H, Kurashige J, et al. Controlling Nutritional Status (CONUT) score is a prognostic marker for gastric cancer patients after curative resection. Gastric Cancer. 2018;21(2):204–212. doi:10.1007/s10120-017-0744-3
16. Fu X, Yang Y, Zhang D. Molecular mechanism of albumin in suppressing invasion and metastasis of hepatocellular carcinoma. Liver Int. 2022;42(3):696–709. doi:10.1111/liv.15115
17. Palumbo JS, Kombrinck KW, Drew AF, et al. Fibrinogen is an important determinant of the metastatic potential of circulating tumor cells. Blood. 2000;96(10):3302–3309. doi:10.1182/blood.V96.10.3302
18. Yu W, Wang Y, Shen B. An elevated preoperative plasma fibrinogen level is associated with poor overall survival in Chinese gastric cancer patients. Cancer Epidemiol. 2016;42:39–45. doi:10.1016/j.canep.2016.03.004
19. Sun DW, An L, Lv GY. Albumin-fibrinogen ratio and fibrinogen-prealbumin ratio as promising prognostic markers for cancers: an updated meta-analysis. World J Surg Oncol. 2020;18(1):9. doi:10.1186/s12957-020-1786-2
20. Lin JX, Desiderio J, Lin JP, et al. Multicenter validation study of the American joint commission on cancer (8th Edition) for gastric cancer: proposal for a simplified and improved TNM staging system. J Cancer. 2020;11(12):3483–3491. doi:10.7150/jca.36891
21. Wang FH, Zhang XT, Li YF, et al. The Chinese Society of Clinical Oncology (CSCO): clinical guidelines for the diagnosis and treatment of gastric cancer, 2021. Cancer Commun. 2021;41(8):747–795. doi:10.1002/cac2.12193
22. Du S, Fang Z, Ye L, et al. Pretreatment neutrophil-to-lymphocyte ratio predicts the benefit of gastric cancer patients with systemic therapy. Aging. 2021;13(13):17638–17654. doi:10.18632/aging.203256
23. Zhu Z, Gao J, Liu Z, et al. Preoperative Platelet-to-Lymphocyte Ratio (PLR) for predicting the survival of stage I-III gastric cancer patients with a MGC component. Biomed Res Int. 2021;2021:9678363. doi:10.1155/2021/9678363
24. Sharma BK, Mureb D, Murab S, et al. Fibrinogen activates focal adhesion kinase (FAK) promoting colorectal adenocarcinoma growth. J Thromb Haemost. 2021;19(10):2480–2494. doi:10.1111/jth.15440
25. Kwaan HC, Lindholm PF. Fibrin and fibrinolysis in cancer. Semin Thromb Hemost. 2019;45(4):413–422. doi:10.1055/s-0039-1688495
26. Kovalski JR, Kuzuoglu-Ozturk D, Ruggero D. Protein synthesis control in cancer: selectivity and therapeutic targeting. EMBO J. 2022;41(8):e109823. doi:10.15252/embj.2021109823
27. Liu ZJ, Ge XL, Ai SC, et al. Postoperative decrease of serum albumin predicts short-term complications in patients undergoing gastric cancer resection. World J Gastroenterol. 2017;23(27):4978–4985. doi:10.3748/wjg.v23.i27.4978
28. Lu J, Xu BB, Zheng CH, et al. Development and external validation of a nomogram to predict recurrence-free survival after R0 resection for stage II/III gastric cancer: an international multicenter study. Front Oncol. 2020;10:574611. doi:10.3389/fonc.2020.574611
29. Bando E, Makuuchi R, Irino T, et al. Validation of the prognostic impact of the new tumor-node-metastasis clinical staging in patients with gastric cancer. Gastric Cancer. 2019;22(1):123–129. doi:10.1007/s10120-018-0799-9
30. Cheng X, Yu S, Wang Y, et al. The role of oxaliplatin in the adjuvant setting of different Lauren’s type of gastric adenocarcinoma after D2 gastrectomy: a real-world study. Gastric Cancer. 2019;22(3):587–597. doi:10.1007/s10120-018-0895-x
31. Kim JW, Cho SY, Chae J, et al. Adjuvant chemotherapy in microsatellite instability-high gastric cancer. Cancer Res Treat. 2020;52(4):1178–1187. doi:10.4143/crt.2020.313
32. Zhang Z, Rousson V, Lee WC, et al. Decision curve analysis: a technical note. Ann Transl Med. 2018;6(15):308. doi:10.21037/atm.2018.07.02
33. Vickers AJ, Holland F. Decision curve analysis to evaluate the clinical benefit of prediction models. Spine J. 2021;21(10):1643–1648. doi:10.1016/j.spinee.2021.02.024
 © 2023 The Author(s). This work is published and licensed by Dove Medical Press Limited. The full terms of this license are available at https://www.dovepress.com/terms.php and incorporate the Creative Commons Attribution - Non Commercial (unported, v3.0) License.
By accessing the work you hereby accept the Terms. Non-commercial uses of the work are permitted without any further permission from Dove Medical Press Limited, provided the work is properly attributed. For permission for commercial use of this work, please see paragraphs 4.2 and 5 of our Terms.
© 2023 The Author(s). This work is published and licensed by Dove Medical Press Limited. The full terms of this license are available at https://www.dovepress.com/terms.php and incorporate the Creative Commons Attribution - Non Commercial (unported, v3.0) License.
By accessing the work you hereby accept the Terms. Non-commercial uses of the work are permitted without any further permission from Dove Medical Press Limited, provided the work is properly attributed. For permission for commercial use of this work, please see paragraphs 4.2 and 5 of our Terms.