Back to Journals » Clinical Epidemiology » Volume 11
Clinical predictor score to identify patients at risk of poor viral load suppression at six months on antiretroviral therapy: results from a prospective cohort study in Johannesburg, South Africa
Authors Mbengue MAS, Chasela C, Onoya D ![]() , Mboup S
, Mboup S ![]() , Fox MP, Evans D
, Fox MP, Evans D ![]()
Received 11 December 2018
Accepted for publication 27 February 2019
Published 7 May 2019 Volume 2019:11 Pages 359—373
DOI https://doi.org/10.2147/CLEP.S197741
Checked for plagiarism Yes
Review by Single anonymous peer review
Peer reviewer comments 2
Editor who approved publication: Professor Vera Ehrenstein
Mouhamed Abdou Salam Mbengue,1,2 Charles Chasela,1,3 Dorina Onoya,4 Souleymane Mboup,2 Matthew P Fox,5,6 Denise Evans4
1Department of Epidemiology and Biostatistics, School of Public Health, Faculty of Health Sciences, University of the Witwatersrand, Johannesburg, South Africa; 2Department of Biostatistics and Health Economics, IRESSEF: Institute of Health Research, Epidemiologic Surveillance and Training, Dakar, Senegal; 3Epidemiology and Strategic Information, HIV/AIDS, STIs & TB, Human Sciences Research Council, Pretoria, South Africa; 4Health Economics and Epidemiology Research Office, Department of Internal Medicine, School of Clinical Medicine, Faculty of Health Sciences, University of the Witwatersrand, Johannesburg, South Africa; 5Department of Global Health, Boston University School of Public Health, Boston, MA, USA; 6Department of Epidemiology, Boston University School of Public Health, Boston, MA, USA
Purpose: As countries work toward 90:90:90 targets, early identification of patients with inadequate response to antiretroviral therapy (ART) is critical for achieving optimal HIV treatment outcomes. We developed and evaluated a clinical prediction score (CPS) to identify HIV-positive patients at risk of poor viral load suppression at 6 months on ART.
Patients and methods: We conducted a prospective cohort study of HIV-positive ART naïve adults (≥18 years) initiating standard first-line ART between February 2012 and April 2014 at Themba Lethu Clinic in Johannesburg, South Africa. We used Modified Poisson regression to estimate the association between patient characteristics and poor viral load suppression, defined as a viral load ≥400 copies/mL at 6 months on ART. We developed a CPS following the Spiegel Halter and Knill-Jones approach and determined the diagnostic accuracy compared to viral load as the “gold standard”. We identified the optimal cutoff at which the CPS would identify those at risk of poor viral load suppression.
Results: Among 353 patients, 67.7% had a viral load measurement at 6 months on ART and 30.1% of these were viremic (≥400 copies/mL). Male gender, platelet count <150 cells/mm3, ≥7 days late for ≥2 ARV visits, visual analog scale (VAS) <90% and <14.5 fL increase in mean cell volume from baseline to 6 months were included in the CPS. The optimal cutoff was 5 (≥5 vs <5; sensitivity [Se] 65.3%, specificity [Sp] 46.7%) and the CPS performed better than standard measures of adherence (eg, VAS Se 24.5%; Simplified Medication Adherence Questionnaire Se 26.5%).
Conclusion: Our findings suggest a 6-month CPS may have the potential to identify patients at risk of poor viral load suppression. The CPS may be used to target patients who need intensive adherence support, with the caveat that there may be a three- to four-fold increase in the pool of patients identified for adherence counseling.
Keywords: antiretroviral therapy, viral load, monitoring, risk score, algorithm, resource limited
Introduction
Eastern and southern Africa bears the highest burden of the HIV epidemic with 19.6 million people living with HIV, 800,000 newly infected with HIV, and 380,000 deaths due to AIDS in 2017.1 Efforts to expand access to antiretroviral therapy (ART) has resulted in over 17 million people living with HIV starting ART,1 thus significantly reducing HIV-associated morbidity and mortality and, increasing life expectancy in affected countries.2 However, there remain significant obstacles to both access to ART for those who need it and to sustaining those already on treatment. Non-adherence to ART has the potential to undermine the dramatic improvements in survival seen in resource-limited settings.3
South Africa has the highest burden of HIV infection worldwide, with approximately 7.3 million people living with HIV. The prevalence of HIV among adults aged 15–49 years old is 18.9% and the prevalence sex ratio is 0.56.4 South Africa has the largest ART programme in the world, with over 3.3 million people on treatment in 2016.5,6 The adoption of the Universal Test and Treat (UTT) policy in South Africa, as of September 2016, is expected to increase ART uptake and result in approximately 164,000 new patients on ART per annum representing a 5.2% increase to the program at an additional cost of $42 million per year.6,7 The elimination of CD4 count thresholds for ART eligibility is likely to have an impact on national treatment program budget and the capacity of the national ART program to achieve the United Nations Programme on HIV (UNAIDS) 90–90-90 target by 2020.7
Routine viral load monitoring is the preferred method for assessing treatment failure and one of the most important parameters to monitor ART.8 Without drug resistance, HIV-positive patients should achieve viral suppression within 8–24 weeks after ART initiation.8,9 Accurate and early identification of virologic failure is crucial as HIV-positive patients may benefit from interventions to improve ART adherence such as intensive adherence counseling.10
Numerous studies have shown that individual markers such as hemoglobin, mean corpuscular volume (MCV), total lymphocyte count, serum lactate, platelet count, and bilirubin could potentially be used as alternatives to monitoring viral load and ART outcomes.11–18 These laboratory markers are routinely performed in many settings and are inexpensive when compared to viral load which is costly and technically difficult to implement. Results of work on predictive markers have been conflicting, with many reporting a poor sensitivity and specificity when compared with the standard adherence measures.19 To overcome this, methods combining routine biomarkers with a patient’s clinical information and non-clinical data have been proposed to improve the sensitivity and usefulness of these methods. The use of predictive markers has mainly been evaluated in retrospective studies with conflicting results and poor sensitivity and specificity when applied to routine clinical data.13,19 Additionally, the cutoff levels at which these combined biomarkers should be used to monitor and assess viral load control remains unclear.
We previously published results of a clinical predictor score (CPS) to identify patients at risk of virologic failure using retrospective data from the Themba Lethu Clinic (TLC) in Johannesburg, South Africa.13 Based on our previous findings, we designed a study at the same clinic to prospectively collect data on clinical markers and self-reported adherence to improve the applicability and accuracy of the CPS. We hypothesized that a composite biomarker including patient’s clinical and non-clinical data together with adherence measures would improve the sensitivity of the CPS. The prospective design allowed us to collect data on certain markers/variables that were missing (eg, serum lactate, serum albumin, MCV and adherence measures) and could therefore not be included in the retrospective analysis. This study aimed to develop a CPS to identify those at risk of poor viral load suppression at 6 months on ART and those most likely to benefit from interventions to improve ART adherence.
Material and methods
Study site and population
This study was a secondary analysis of data collected from a prospective observational study. The study enrolled 357 HIV-positive adult (≥18 years of age) patients who initiated standard first-line ART at TLC from February 2012 to April 2014 and followed patients for 24 months post-ART initiation. The sample size of the primary study (n=387) was calculated for a single proportion (α=0.05; power=80%), assuming that the proportion of patient failing first-line ART at TLC was 25%,13 while estimates from sub-Saharan Africa and more specifically South Africa suggest that number is much lower, between 6% and 10%.20,21 By the end of the study period only 357 patients or 92% of the target sample had been enrolled.
Themba Lethu Clinic (TLC) follows the South African National Department of Health (NDOH) ART treatment guidelines, and since 2004, more than 36,000 patients with HIV have been initiated on ART.22,23 During the period of this study, HIV-positive patients initiated ART with a CD4 count below 350 cells/mm3 irrespective of World Health Organization (WHO) clinical stage. Individuals with WHO stage III or IV conditions (regardless of CD4 count), those with tuberculosis, pregnant women or breastfeeding women were also eligible for ART initiation.24
Standard first-line therapy included tenofovir with lamivudine (3TC) and efavirenz, and in April 2013 TLC introduced a single pill or fixed-dose combination which replaced the multi-pill ART regimen.25 Medical follow-up visits are scheduled at 1, 3, 6 and 12 months thereafter depending on the regimen. Patients collect medication every month for the first 6–12 months and then later every 2 months once stable. Where clinical visits and medication pickups overlap (ie, 1, 3 or 6 months etc.) patients see the doctor and fill their prescription during the visit. For the other months, ARVs prescriptions are filled outside of clinical visits. According to the 2013 South African NDOH ART treatment guidelines, CD4 and viral load were measured at 6 and 12 months during the first year of treatment and then yearly thereafter.24 In accordance with national treatment guidelines, viral load testing was used for patient monitoring and, in particular, to assist in switching to second-line treatment regimens.
Eligible patients were identified and enrolled at ART initiation. Patients provided informed consent to participate and agreed to attend study visits at 6, 12 and 24 months post-ART initiation, in addition to their routine medical visits. During study visits patients saw a nurse who collected vitals (eg, weight, height, blood pressure and body temperature) and performed a clinical assessment, met with a counselor to complete an adherence questionnaire and provided blood for additional laboratory testing (eg, serum lactate, full blood count and serum albumin) (Table 1). Data were collected by clinic staff (eg, nurses and counselors) using paper-based forms and captured electronically by study staff. We excluded patients who transferred in on ART. While pregnant women were eligible to initiate ART, they were not included in the prospective study mainly because they are initiated using different criteria and were managed differently (eg, transferred out to other facilities for antenatal care).24
 | Table 1 Summary of data sources and study variables |
Individual demographic and clinical characteristics were captured in a study database (hereafter referred to as the LCM cohort) and linked to TherapyEdge-HIVTM, the routine electronic patient management system used at TLC.22,23 Clinical data, including CD4 counts and viral load results, are automatically integrated into TherapyEdge-HIVTM from National Health Laboratory Services on a daily basis. The data sources were combined, and patient identifiers removed to create a de-identified analytical database with 357 observations. The analysis was further restricted to patients who had at least one viral load recorded and more than 6 months on ART (Figure 1).
 | Figure 1 Flowchart of the study participant in the LCM cohort study. |
Study variables
The outcome of interest was poor virologic suppression, defined as a viral load ≥400 copies/mL at 6 months on ART. Viral load tests dated between 4 and 9 months after ART initiation were considered as the 6-month viral load result.
We divided candidate predictors into baseline (collected at enrolment study visit) and 6-month follow-up variables. Twenty-four variables (clinical and laboratory markers) were selected as potential factors associated with poor viral load suppression at 6 months on ART. We included variables at ART initiation such as WHO stage, ART regimen, current tuberculosis diagnosis , CD4 count (cells/mm3), body mass index (BMI; kg/m2), hemoglobin (g/dL), mean cell volume (MCV; fL), platelet count (cells/mm3), total lymphocyte count (10^3/mm3), serum lactate (mmol/L), albumin (g/L) and mean corpuscular hemoglobin (pg.). For the follow-up variables, we considered both the absolute value at 6 months on ART (eg, BMI <18.5 kg/m2, platelet count <150 10^2/mm3, serum lactate below 2 mmol/L) and also a change between ART initiation and 6 months on ART (eg, failing to increase CD4 count by ≥50 cells/mm3, haemoglobin drop >1 g/dL, MCV change <14.5 fL, serum albumin decreased or unchanged, total lymphocyte count below baseline value and number of missed ARV drug collections or medical visits ≥7 days). We used the cutoff values reported in previous studies and the diagnostic prediction models found in the literature.11–13,15,18,26–31 We determined the percentage change after 6 months as the amount of change during the past 6 months relative to the initial value of that variable at the start of the period.
For adherence to medication at 6 months on ART, we used standardized adherence assessment tools. The first included sections for self-report, visual analog scale (VAS)31,32 and pill identification test (PIT) (ie, questions about the name of the medication, number of pills per dose, time the medication is taken and if the patient knows any additional instructions such as storage in a refrigerator, take with food or avoid other medications).32 The second tool was derived from the Simplified Medication Adherence Questionnaire (SMAQ) tool.33
For the analysis, a patient was categorized as adherent if he/she answered “no” to all the self-report questions (eg, “Do you sometimes find it difficult to remember to take your medication?”, “When you feel better, do you sometimes take a break from your medication?”, “Thinking back over the past four days, have you missed any doses?”, “Sometimes if you feel worse when you take the medication, do you stop taking it?”), reported ≥90% adherence on the VAS and knew the dose, time and instructions about ART medication (as assessed by the counselor/social worker). When responses to self-report, VAS or pill identification were less than optimal (eg, answered “yes” to some of the self-report questions, reported <90% on the VAS, and/or did not know the dose, time and instructions on ART medication), overall adherence was categorized as non-adherent. For the SMAQ questionnaire, which asks patients about the past 3 months, a patient was considered non-adherent when a positive response to any of the qualitative questions was given, more than two doses over the past week were missed or had missed taking medicine for more than 2 days over the past 3 months. We considered a multi-method approach, by combining the methods mentioned above (eg, self-report, VAS, PIT and SMAQ), and further categorizing overall adherence. The diagnostic accuracy of the individual and combined adherence measure adherence measures at 6 months on ART were compared to viral load as the “gold standard”.
Statistical analysis
Patient demographic and clinical characteristics at baseline were summarized using frequencies for categorical variables and means with standard deviation for normally distributed or the median and interquartile range (IQR) for not normally distributed data. We present patient demographics and clinical characteristics at ART initiation, stratified by 6-month viral load result. We compared demographic and clinical characteristics at baseline between patients who had a viral load at 6 months versus those who did not (and were therefore excluded from the analysis).
Modified Poisson regression models were used to test the association between different baseline and follow-up variables and poor viral load suppression at 6 months on ART.34,35 Baseline and follow-up variables associated with the outcome in univariate analysis at a p-value <0.25 along with variables known to be associated with the outcome of interest (eg, gender, age, CD4 count)13 were entered into the multivariate regression model. In this study, we used an approach of complete case analysis whereby individuals with missing values in the outcomes or other variables were excluded from the analysis. Additionally, we implemented a multiple imputation technique to fill in the missing values in the predictors and the outcome. We assumed that data are missing at random with a pattern closed to monotone. Finally, we conducted a sensitivity analysis to compare the robustness of the estimations between the case complete analyses where subjects with missing values are excluded from the analysis with the cases where missing data were filled. Specifically, we assessed whether the complete case analysis with the multiple regressions from the imputed dataset were different.
We then developed a scoring system following the Spiegel Halter and Knill-Jones approach.36 The score was calculated as the adjusted relative risk rounded to the nearest integer and combined to provide a total score for baseline variables and a total score for follow-up variables. This was applied to the individual patient-level data, and a total score was calculated for each patient, based on the presence or absence of the individual variables identified. Summing the scores gave a total risk score for each patient at 6 months. Variables with a protective effect were assigned a zero score, as the CPS is intended to identify those at risk of poor viral load suppression.
The total risk score was dichotomized using different cutoffs ranging from 2 (≥2 vs <2) to 5 (≥5 vs <5). We calculated the diagnostic accuracy of each cutoff by calculating the proportion with the outcome and the observed sensitivity (Se), specificity (Sp), positive predictive values (PPV) and negative predictive values (NPV) compared to viral load as the “gold standard”. We assessed the overall diagnostic performance of the total risk score by computing the area under the curve (AUC) value of the receiver operating characteristic (ROC) curve using viral load as the “gold standard”. The optimal cutoff (as guided by the ROC curves), sensitivity and specificity were identified and used to outline an algorithm to identify those at risk of poor viral load suppression at 6 months on ART. Subsequently, the diagnostic accuracy (eg, Se, Sp, NPV, PPV) of the individual and combined adherence measure were compared to viral load as “gold standard”. Finally, we present an example of how the CPS and algorithm could be used in clinical practice.
All analyses were performed in STATA version 13 (StataCorp, TX, USA).37
Results
Baseline characteristics of the cohort
We recruited 357 HIV-positive patients starting first-line ART at TLC between February 2012 and April 2014. Of a total of 357 patients recruited, 353 met the inclusion criteria. Among the patients who were not eligible, two were pregnant, and two others were not on a first-line regimen (Figure 1). We assessed if patients in the prospective study were representative of the population of patients on ART, as described in an open cohort of data from ten clinics in two provinces within South Africa.22 Patients from the prospective cohort were similar in terms of male gender (33.8% vs 36.1%), employment (60.1% vs 53.3%), South African nationality (85.5% vs 88.0%), but differed in terms of education (ie, secondary school and beyond 76.0% vs 52.8%) and CD4 count (>200 cells/mm3 50.3% vs 22.3%) when compared to the Right to Care Clinical HIV Cohort.22
Viral load suppression at 6 months on ART
Of the 353 patients who met the inclusion criteria, 296 were in care at the 6-month follow-up, and 239 (80.7%) had their viral load assessed. Of the 239 patients, 72 (30.1%) had poor viral load suppression (viral load ≥400 copies/mL) at 6 months on ART. At ART initiation, baseline demographic and clinical characteristics were similar between patients with a poor viral load suppression, those with viral load suppression (<400 copies/mL) and those without a viral load test at six months on ART (Table 2).
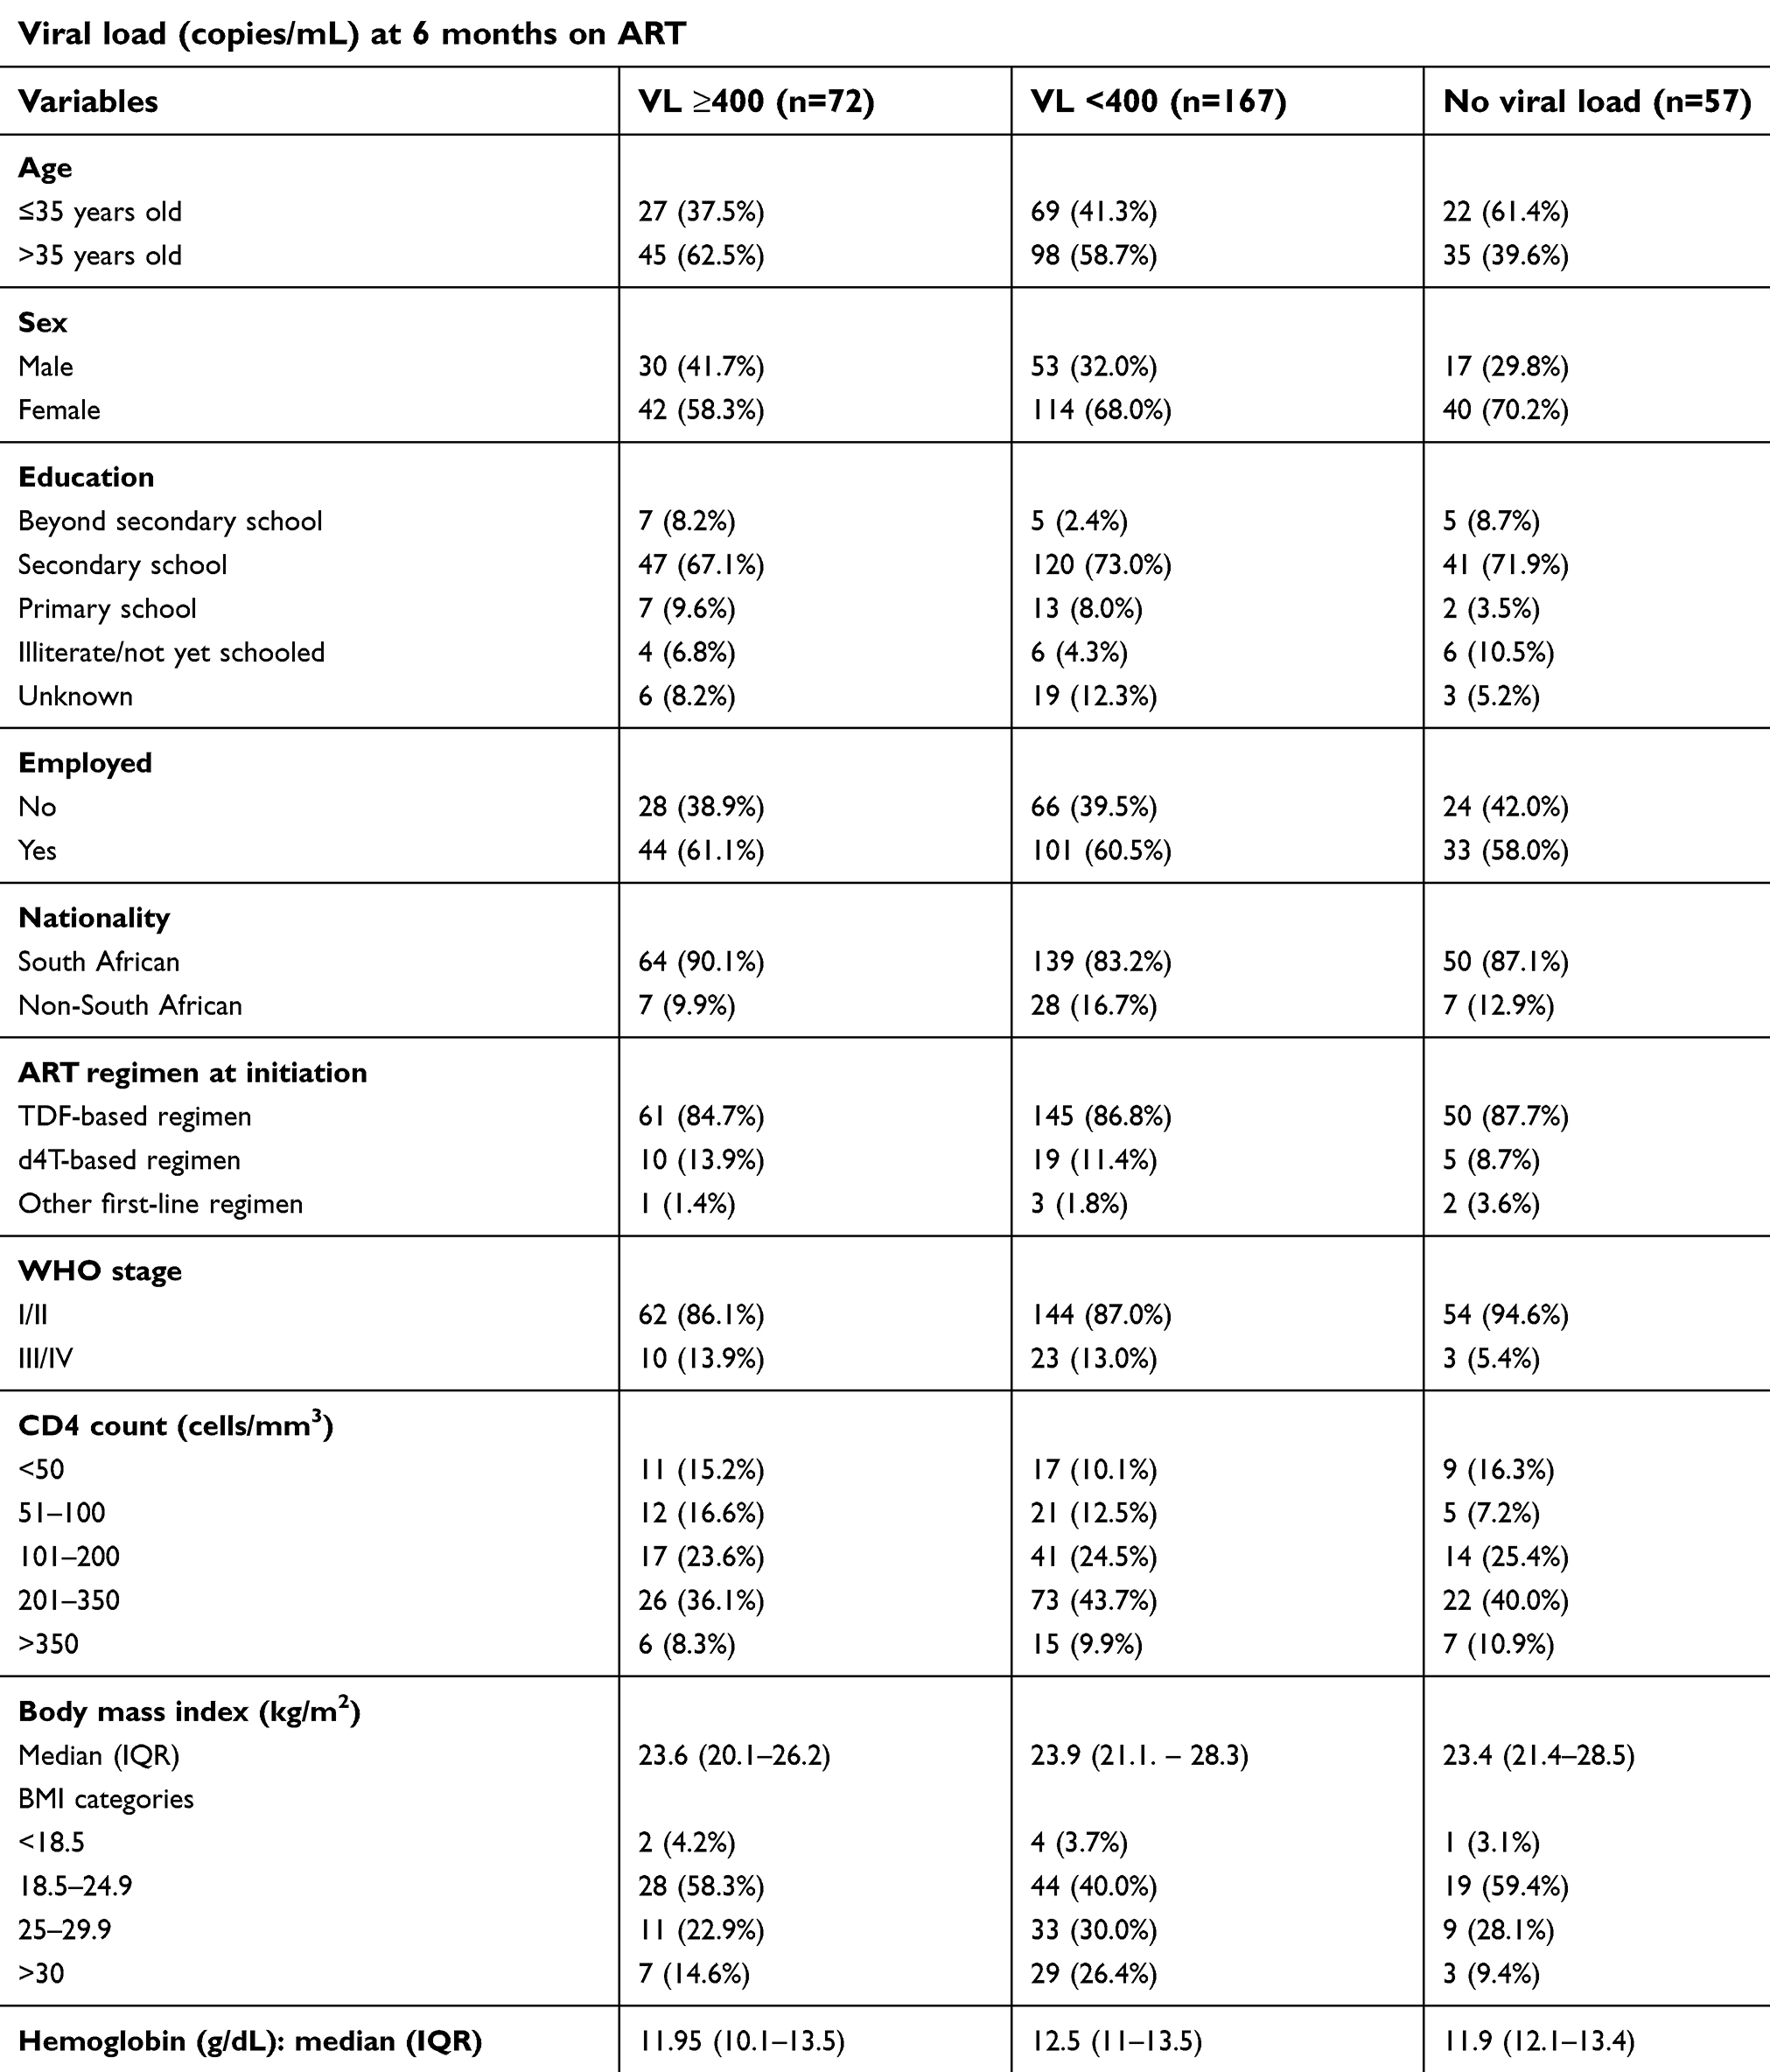 | Table 2 Baseline demographic and clinical characteristics of 296 ART-naive patients, stratified by a viral load at 6 months on ART |
There were minimal missing values at baseline, the highest proportion missing was obtained with the variable education (3.1%). At 6 months of ART, missing values were present for all clinical markers as well as the self-reported adherence variables and the plasma viral load. Regarding the viral load, 239 (80.7%) observations were recorded and 57 values (19.3%) were missing at 6 months whereas for clinical markers and self-reported adherence measures nearly 35% of values were missing. Less than 5% of patients had missing values for some of the key candidate predictors for the CPS (eg, MCV, CD4 count, serum albumin, serum lactate, platelet count, hematocrit, etc.).
Sensitivity and specificity of standard measures of adherence
We assessed the diagnostic accuracy of the different measures of adherence to correctly identify poor viral load suppression at 6 months on ART. At 6 months, when compared to viral load, the VAS had a sensitivity of 24.5% while this was 26.5% and 18.4% for the SMAQ and the multi-method approach, respectively. In contrast, the VAS gave a specificity of 87.7%. This was almost the same with the multi-method approach (Sp 86.8%) but decreased to 78.9% for the SMAQ tool (Table 3). The ROC curve C-statistic ranged between 0.525 and 0.555 for the standard measures of adherence.
 | Table 3 Sensitivity and specificity of self-reported adherence at 6 months on ART compared to viral load as “gold standard” |
Sensitivity and specificity of the scoring algorithm
We tested the association between baseline and follow-up variables and poor viral load suppression at 6 months on ART. At 6 months on ART, seven variables were identified in the Poisson Regression Model, after adjusting for gender and age. The score was calculated as the adjusted relative risk rounded to the nearest integer. The risk score included characteristics at ART initiation (eg, age, gender, WHO stage) and each was assigned a score of +1 so that the total score that could be assigned at ART initiation was +3. Clinical follow-up variables included platelet count <150 cells/mm3 (+3), absolute MCV change between ART initiation and 6 months on ART <14.5 fL (+1) and missing at least two ARV visits ≥7 days (+2). Self-reported adherence measure such as VAS <90% was also included in the risk score (+2). The total score that could be assigned at the 6-month follow-up visit was +8. Therefore, the total risk score for each patient at 6 months ranged from zero to eleven (Table 4).
 |  |  | Table 4 Crude and adjusted predictors of poor virologic suppression at 6 months after ART initiation, using Modified Poisson regression (n=163) |
The optimal diagnostic accuracy was obtained at the cutoff point of 5 followed by the cutoff point of 4. When the cutoff point of 5 (≥5 vs <5) was used the sensitivity of the diagnostic risk score was 65.3% (95% CI 53.8–75.2) while the specificity was 46.7% (95% CI 39.3–54.3). The ROC curve for the diagnostic risk score, using a cutoff of 5, was 0.63 (95% CI: 0.53–0.72) while for the different measures of adherence (self-reported), the ROC curves were uninformative as the AUC was nearly 0.5 (Table 3). A risk score of ≥5 gave the best specificity of 46.7%, but this was worse than the specificity for the different measures of adherence (87.7% VAS; 86.8% multi-method approach; 78.9% SMAQ).
Table 5 indicates that more than half (56.9%; 136/239) of patients had a risk score ≥5 while almost two-thirds (72.4%; 173/239) had a risk score ≥4. Our results indicate that compared to those with a risk score <5 (25/103; 24.3%), those with a total risk score ≥5 were more likely to have poor viral load suppression (47/136; 34.6%) at 6 months (RR 1.42 95% CI 0.94–2.15).
 | Table 5 Diagnostic accuracy of the clinical prediction pcore (CPS) at different cutoff points at 6 months after ART initiation |
To demonstrate the clinical utility of the algorithm, which outperformed standard measures of adherence, we present an example of how the algorithm could be used in clinical practice to identify those at risk of poor viral load suppression at 6 months on ART and those most likely to benefit from an adherence intervention (eg, targeted intensive adherence counseling) (Figure 2).
 | Figure 2 Diagnostic accuracy of the algorithm compared to viral load as “the gold standard”. |
Discussion
HIV viral load is the most important parameter in monitoring ART.6 In the context of UTT and with more people initiating ART, a clinical algorithm may be useful to identify those at risk of poor virologic suppression and for prioritizing intensified efforts around adherence support.38 In this study, we report the development for a CPS to identify those at risk of poor viral load suppression at 6 months on ART.
Our study showed that, a predictor score including age, gender, WHO stage III/IV, platelet count <150 cells/mm3, VAS score <90%, MCV change <14.5 fL and missing at least two ARV visits by ≥7 days performed better than self-reported adherence (eg, VAS or SMAQ or multiple methods combined) in correctly identifying patients with poor viral load suppression on ART. Similar studies among HIV-positive patients in developed countries have developed risk scores derived from combining self-reported adherence measures and laboratory and clinical markers for HIV-positive patients that undergo targeted viral load testing.26–28,38,39 A CPS to target viral load testing in adults was developed in Cambodia and showed that VAS score ≤95% was predictive of viral load failure after adjusting with other variables.26 Similarly, an algorithm developed in Uganda used a scoring system which included CD4 count, MCV ≤95 fL, percentage adherence ≤90% and clinical information to predict virologic failure when applied to identify patients with risk of poor outcome in the clinical field.26 A cutoff score of 3 was chosen and resulted in a sensitivity of 40% and a PPV of 100% in the derivation population. However, in these two studies26,40 the authors did not mention the follow-up period during which the diagnostic risk score may be applicable or discriminative. In our study, we defined and evaluated the CPS at the 6 months’ follow-up period. This period allowed us to identify patients more likely to experience early virologic failure on ART and those most likely to benefit from interventions to improve ART adherence.
Another strength of the study was the prospective design and the fact that we used clinical markers that are routinely collected to develop the CPS. This means that the risk score could potentially be used by the nurses during the 6-month follow-up visit to identify high-risk patients that could be targeted for interventions to improve ART adherence. We tested this and asked nurses to complete the score prospectively for patients enrolled in the study (data not presented). Nurses demonstrated their ability to incorporate the clinical assessment of patients in their daily routine, obtain the information needed to generate a total risk score and calculate a risk score for each patient. The CPS, based on routine and accessible information collected during patient visits can be calculated in real-time by clinic staff, can be used to target patients who need intensive adherence counseling with the caveat that there may be more a three- to four-fold increase in the pool of patients requiring adherence counseling. Since the CPS relies on routinely collected data, there are no additional laboratory costs, however additional resources and staff time required to complete the score and offer an adherence intervention (ie, intensive adherence counseling) to all those identified and targeted could be substantial in the context of a heavily burdened health care system.
The prospective design also meant that we could verify patient’s information regarding inclusion and exclusion criteria which may have strengthened the discriminative value of our algorithm compared to previous research. Our results support other findings that report the poor performance of CD4 count to identify virologic failure.38,41 We previously reported that the inclusion of CD4 in a clinical algorithm to improve the sensitivity of the algorithm to correctly identify a virologic failure in HIV-positive patients on ART.13 We reported that a CPS inclusive of age, CD4 count <100 cells/mm3, WHO stage III/IV, albumin <25 g/dL and laboratory and clinical follow-up data had a sensitivity of 57.1% to correctly identify a virologic failure in HIV-positive patients on ART.13 Using the same approach, we now show that a CPS derived from prospective data collected in a routine clinic setting had an improved sensitivity of 65.3% to correctly identify patients with an elevated viral load.
We considered two cutoff values for providing optimal diagnostic accuracy: a cutoff of ≥4 and cutoff of ≥5, these two thresholds provided the optimal true positive rate while decreasing the proportion of false negatives compared to viral load as “gold standard”. If we used a cutoff of ≥4, we had a sensitivity of 76.4% to correctly identify poor viral load suppression at 6 months on ART. Using a cutoff of ≥5, at 6 months, 136 (53.1%) patients would be targeted for an adherence intervention. Of these, 47 (47/72; 65%) of patients with poor viral load suppression would be correctly identified (true positives), while 89 (89/167; 53%) would be targeted but would not require an adherence intervention as they were virologically suppressed (false positives). A total of 120 (46.9%) patients would not be targeted, 25 (25/72; 33%) of these patients with poor viral suppression would be missed and would not receive an intervention, although they would later be managed according to their routine viral load monitoring results according to the South African national ART guidelines. Since most patients fail treatment after the first 12 months on ART and are switched to second-line 6 months after that,42 an approach of relying on nurses to identify those at risk of poor virologic suppression and target those most likely to benefit from an adherence intervention such as intensive adherence counselling, may be a reasonable strategy to improve rates of viral load suppression.
Limitations
The results from this study should be interpreted with several limitations. First, some patents did not have a viral load result available and were therefore excluded from the analysis. Additionally, we used the window period of 4-9 months to capture the 6-month viral load. The fact that not all patients had an HIV viral load result may have reduced the power of our clinical prediction model and could have introduced selection bias. Thus, we conducted further analysis. Our results showed that the baseline and clinical characteristics of HIV-positive patients without a viral load at 6 months were similar to those with a viral load and included in the analysis and believe the risk of selection bias to be minimal. Patients without viral load results at 6 months may also represent patients not actively engaging in care, those lost to follow-up or who have died during the early months of ART initiation. This may have introduced survival bias, meaning only those well enough and actively engaging in care at 6 months on ART were included in the analysis.
The clinical utility of the score needs to be tested in practice especially since one in five patients (20%) in care may not have a viral load result at 6 months on ART. In the absence of a viral load result, some patients (score ≥5) would be targeted and may benefit from an adherence intervention because they need it, while others may be targeted but did not need it (ie, already virally suppressed). More concerning is the group of patients that would be missed either because they did not have a viral load result or because they were not targeted (score <5). Second, our study included only patients who initiated at TLC and those referred from other facilities were excluded. TLC is a single large HIV specialized urban clinic with highly specialized and skilled staff and with clinical practices that may differ significantly from other public health centers in South Africa.22,25 Therefore, our result may not be generalizable and the CPS requires additional validation studies in other resources constrained settings. Third, apart from a few laboratory tests (eg, serum lactate, full blood count and serum albumin), we relied on routine clinical and laboratory data. The limitations of routine data, including data completeness and accuracy, have been well described in the literature. Our study relied on a single HIV RNA measurement at a one-time point. This limited the ability to access the impact of viral load blips (eg, temporary increases in viral load) or pre-treatment HIV drug resistance (PDR). PDR prevalence is estimated to be between 9% to 11% in high HIV prevalence settings in South Africa.43 In the absence of viral load and resistance testing at baseline, it is unclear in what manner the CPS would benefit this group of patients. Last, the study was a secondary analysis of data collected from a prospective observational cohort study and therefore relied on the data fields and eligibility criteria implemented by the primary study (ie, pregnant women were excluded).
Conclusion
We showed that a CPS tool developed using prospectively collected data in a routine clinic setting performs better with improved sensitivity over standard adherence measures to correctly identify poor adherence at 6 months on ART. However, while the CPS performed better, the overall sensitivity (65.3%) is still low and so more work is needed to improve the sensitivity of the CPS to correctly identify those at risk of poor viral load suppression and target those most likely to benefit from an adherence intervention. Examples of future work may include applying machine learning techniques which look for patterns within the observed data and construct models or algorithms to make data-driven predictions or decisions. In its current form, the CPS would most likely result in a three- to four-fold increase in the pool of patients targeted for adherence counseling which could contribute to additional costs, clinic time for patients and impact on an already heavily burdened health care system. These consequences are likely to undermine the benefits of implementing the CPS in routine clinical practice.
Acknowledgments
We sincerely thank the patients attending the Themba Lethu Clinic for their continued trust in the treatment and care provided at the clinic. The authors would like to thank and extend their sincere gratitude to the directors and staff at Themba Lethu Clinic and the Health Economics and Epidemiology Research Office.
This study has been made possible by the generous support of the American People and the President’s Emergency Plan for AIDS Relief (PEPFAR) through US Agency for International Development (USAID) under the terms of Cooperative Agreements AID-674-A-12-00029 and 72067419CA00004 to HE2RO. The contents are the responsibility of the authors and do not necessarily reflect the views of PEPFAR, USAID or the United States Government. DE was supported by funding from NIH/CFAR/IAS Creative and Novel Ideas in HIV Research (CNIHR) program (Sub-award with UAB Center for AIDS Research: P30AI027767) and National Research Foundation (NRF) of South Africa Thuthuka program (post-PhD track 500 TTK1206261680 Grant number 84331). Any opinion, finding, conclusion or recommendation expressed in this material is that of the author(s) and the NRF does not accept any liability in this regard. Right to Care provided some funding for technical and logistic support and for the provision of treatment for patients in this study.
Ethics statement/clearance
The authors confirm that this study was conducted in accordance with the Declaration of Helsinki. The primary study was approved by the Human Research Ethics Committee of the University of the Witwatersrand and informed consent for participation in the primary study was obtained from all participants. The original ethical approval was obtained in June 2010 (Clearance Certificate M10418) and was renewed in May 2016 (Clearance Certificate M160574). For the secondary data analysis, approval was obtained from the Human Research Ethics Committee of the University of the Witwatersrand (Clearance certificate M140918) for the analysis of anonymized data. There were no patient identifiers in the dataset, and the patients were identified and linked using the unique study ID number (ie, TE number) included in both the “Low Cost Monitoring (LCM)” database and TherapyEdge-HIV™ datasets.
Author contributions
DE conceived and designed the study and supervised the research. CC provided input into the design and implementation of the study and supervised the research. MASM implemented the research, performed data management, undertook the data analysis and wrote the first draft of the manuscript. DE and CC supervised the statistical analysis, interpretation of data and revised the first draft of the manuscript. SM supervised the research, participated in the interpretation of data and revised the manuscript. MPF and DO participated in the interpretation of data, revised the first draft of the manuscript and critically reviewed scientific content. All authors contributed toward data analysis, drafting and critically revising the paper, gave final approval of the version to be published, and agree to be accountable for all aspects of the work.
Disclosure
DE reports grants from Health Economics and Epidemiology Research Office during the conduct of the study. The authors report no other conflicts of interest in this work.
References
1. United Nations Against AIDS (UNAIDS) data 2018. Available from: http://www.unaids.org/sites/default/files/media_asset/unaids-data-2018_en.pdf. Assessed April 11, 2019.
2.
3. Machtinger EL, Bangsberg DR. Seven steps to better adherence: a practical approach to promoting adherence to antiretroviral therapy. AIDS Read. 2007;17(1):43–51. Available from:
4.
5.
6.
7. Bor J, Ahmed S, Fox MP, et al. Effect of eliminating CD4-count thresholds on HIV treatment initiation in South Africa: an empirical modeling study. PLoS One. 2017;12(6):e0178249. doi:10.1371/journal.pone.0178249
8. Stevens WS, Marshall TM. Challenges in implementing HIV load testing in South Africa. J Infect Dis. 2010;201(Suppl1):S78–S84. doi:10.1086/650383
9. McMahon JH, Elliott JH, Bertagnolio S, Kubiak R, Jordan MR. Viral suppression after 12 months of antiretroviral therapy in low- and middle-income countries: a systematic review. Bull World Health Organ. 2013;91(5):377–385E. Available from:
10. Cosby CD. Hematologic disorders associated with human immunodeficiency virus and AIDS. J Infusion Nurs. 2007;30(1):22–32. doi:10.1097/00129804-200701000-00005
11. Denue BA, Yusuf I, Bello HS, Abja AU, Bukar A. Changes in blood profile of human immunodeficiency virus (HIV)-infected patients on highly active antiretroviral therapy (HAART) in North Eastern Nigeria. Journal AIDS HIV Res. 2013;5(8):284–291.
12. Schreibman T, Friedland G. Use of total lymphocyte count for monitoring response to antiretroviral therapy. Clin Infect Dis. 2004;38(2):257–262. doi:10.1086/cid.2004.38.issue-2
13. Evans D, Maskew M, Fox M, et al. CD4 criteria improves the sensitivity of a clinical algorithm developed to identify viral failure in HIV-positive patients on first-line antiretroviral therapy. J Int AIDS Soc. 2014;17(1):122–123. doi:10.7448/IAS.17.1.19139
14. Meriki HD, Tufon KA, Afegenwi MH, et al. Immuno-haematologic and virologic responses and predictors of virologic failure in HIV-1 infected adults on first-line antiretroviral therapy in Cameroon. Infect Dis Poverty. 2014;3(1):1–11. doi:10.1186/2049-9957-3-5
15. Romanelli F, Empey K, Pomeroy C. Macrocytosis as an indicator of medication (zidovudine) adherence in patients with HIV infection. AIDS Patient Care STDS. 2002;16(9):405–411. doi:10.1089/108729102760330245
16. Chalker JC, Andualem T, Gitau LN, et al. Measuring adherence to antiretroviral treatment in resource-poor settings: the feasibility of collecting routine data for key indicators. BMC Health Serv Res. 2010;19(10):43. doi:10.1186/1472-6963-10-43
17. Zetterberg E, Neuhaus J, Baker VJ, et al. Group the ISS. Platelet count kinetics following interruption of antiretroviral treatment. AIDS. 2013;29(6):997–1003.
18. Nnambalirwa M, Govathson C, Evans D, McNamara L, Maskew M, Nyasulu P. Markers of poor adherence among adults with HIV attending Themba Lethu HIV Clinic, Helen Joseph Hospital, Johannesburg, South Africa. Trans R Soc Trop Med Hyg. 2016;10(12):696–704. Available from:
19. Evans D, Fox M. When and how should we be measuring adherence to antiretroviral therapy in resource-limited settings? J Clin Res HIV AIDS Prev. 2013;1(2):24–30. Available from:
20.
21. Fox MP, Van Cutsem G, Giddy J, et al. Rates and predictors of failure of first-line antiretroviral therapy and switch to second-line ART in South Africa. J Acquir Immune Defc Syndr (1999). 2012;60(4):428. doi:10.1097/QAI.0b013e3182557785
22. Fox MP, Maskew M, Patrick MacPhail A, et al. Cohort profile: the Themba Lethu Clinical Cohort, Johannesburg, South Africa. Int J Epidemiol. 2013;42(2):430–439. doi:10.1093/ije/dys167
23. Fox MP, Maskew M, Brennan AT, et al. Cohort profile: the Right to Care Clinical HIV Cohort, South Africa. BMJ Open. 2017;7(6):
24.
25. Hirasen K, Evans D, Maskew M, et al. The right combination - Treatment outcomes among HIV-positive patients initiating first-line fixed-dose antiretroviral therapy in a public sector HIV clinic in Johannesburg, South Africa. Clin Epidemiol. 2017;10:17–29. Available from:
26. Lynen L, An S, Koole O, et al. An algorithm to optimize viral load testing in HIV-positive patients with suspected first-line antiretroviral therapy failure in Cambodia. J Acquir Immune Defic Syndr. 2009;52(1):40–48. doi:10.1097/QAI.0b013e3181af6705
27. Van Griensven J, Phan V, Thai S, Koole O, Lynen L. Simplified clinical prediction scores to target viral load testing in adults with suspected first line treatment failure in Phnom Penh, Cambodia. PLoS One. 2014;9(2):878–879. Available from:
28. Robbins GK, Johnson KL, Chang Y, et al. Predicting Virologic Failure in an HIV Clinic. Clin Infect Dis. 2010;50;779–786. Available from:
29. Messou E, Gabillard D, Moh R, et al. Anthropometric and immunological success of antiretroviral therapy and prediction of virological success in west African adults. Bull World Health Organ. 2008;86(6):435–442.
30. Steel G, Joshi MP, Paige S Antiretroviral therapy adherence measurement and support in South Africa: initial activities from July 4 to 26, 2005. Document Number: 303431 Popline by K4Health. 2005 Available from:
31. Amico KR, Fisher WA, Cornman DH, et al. Visual analog scale of ART adherence: association with 3-day self-report and adherence barriers. J Acquir Immune Defic Syndr. 2006;42(4):455–459. doi:10.1097/01.qai.0000225020.73760.c2
32. Berg KM, Arnsten JH. Practical and conceptual challenges in measuring antiretroviral adherence. J Acquir Immune Defic Syndr. 2006;43(SUPPL. 1):1–16. doi:10.1097/01.qai.0000248337.97814.66
33. Knobel H, Alonso J, Casado JL, et al. Validation of a simplified medication adherence questionnaire in a large cohort of HIV-infected patients: the GEEMA Study. Aids. 2002;16(4):605–613. doi:10.1097/00002030-200203080-00012
34. Famoye F, Rothe DE. Variable selection for poisson regression model. J Mod Appl Stat Methods. 2003; 2(2):380–388. Available from:
35. Hardin JW, Hilbe J. Generalized Linear Models and Extensions.
36. Seymour DG, Green M, Vaz FG. Making better decisions: construction of clinical scoring systems by the Spiegelhalter-Knill-Jones approach. BMJ. 1990;300(6719):223–226. doi:10.1136/bmj.300.6719.223
37.
38. Badri M, Cleary S, Maartens G, et al. When to initiate highly active antiretroviral therapy in sub-Saharan Africa? A South African cost-effectiveness study. Antivir Ther. 2006;11(1):63–72.
39. Segeral O, Madec Y, Ban B, et al. Simplified assessment of antiretroviral adherence and prediction of virological efficacy in HIV-infected patients in Cambodia. AIDS Res Treat. 2010;2010:142076. doi:10.1155/2010/142076
40. Colebunders R, Moses KR, Laurence J, et al. A new model to monitor the virological efficacy of antiretroviral treatment in resource poor countries. Lancet Infect Dis. 2006;6(1):53–59. Available from. doi:10.1016/S1473-3099(05)70327-3
41. Abouyannis M, Menten J, Kiragga A, et al. Development and validation of systems for rational use of viral load testing in adults receiving first-line ART in sub-Saharan Africa. AIDS. 2011;25(13):1627–1635. Available from:
42. Narainsamy D, Mahomed S. Delays in switching patients onto second-line antiretroviral treatment at a public hospital in eThekwini, KwaZulu-Natal. South Afr J HIV Med. 2017;18(1):696. Available from::
43. Chimukangara B, Kharsany ABM, Lessells RJ, et al. Moderate-to-high levels of pretreatment HIV drug resistance in KwaZulu-Natal Province, South Africa. AIDS Res Hum Retroviruses. 2019;35(2):129–138. doi:10.1089/AID.2018.0202
 © 2019 The Author(s). This work is published and licensed by Dove Medical Press Limited. The
full terms of this license are available at https://www.dovepress.com/terms
and incorporate the Creative Commons Attribution
- Non Commercial (unported, 3.0) License.
By accessing the work you hereby accept the Terms. Non-commercial uses of the work are permitted
without any further permission from Dove Medical Press Limited, provided the work is properly
attributed. For permission for commercial use of this work, please see paragraphs 4.2 and 5 of our Terms.
© 2019 The Author(s). This work is published and licensed by Dove Medical Press Limited. The
full terms of this license are available at https://www.dovepress.com/terms
and incorporate the Creative Commons Attribution
- Non Commercial (unported, 3.0) License.
By accessing the work you hereby accept the Terms. Non-commercial uses of the work are permitted
without any further permission from Dove Medical Press Limited, provided the work is properly
attributed. For permission for commercial use of this work, please see paragraphs 4.2 and 5 of our Terms.