Back to Journals » Nature and Science of Sleep » Volume 15
Clinical Characteristics Combined with Craniofacial Photographic Analysis in Children with Obstructive Sleep Apnea
Authors Wang H, Xu W, Zhao A, Sun D, Li Y ![]() , Han D
, Han D ![]()
Received 8 December 2022
Accepted for publication 20 February 2023
Published 15 March 2023 Volume 2023:15 Pages 115—125
DOI https://doi.org/10.2147/NSS.S400745
Checked for plagiarism Yes
Review by Single anonymous peer review
Peer reviewer comments 2
Editor who approved publication: Prof. Dr. Ahmed BaHammam
Huijun Wang,1,2 Wen Xu,1,2 Anqi Zhao,1,2 Dance Sun,1,2 Yanru Li,1,2 Demin Han1,2
1Department of Otorhinolaryngology Head and Neck Surgery, Beijing Tongren Hospital, Capital Medical University, Beijing, People’s Republic of China; 2Key Laboratory of Otolaryngology-Head and Neck Surgery, Ministry of Education, Capital Medical University, Beijing, People’s Republic of China
Correspondence: Demin Han; Yanru Li, Beijing Tongren Hospital, Capital Medical University, 1 Dongjiaominxiang, Dongcheng District, Beijing, People’s Republic of China, Email [email protected]; [email protected]
Purpose: Distinguishing obstructive sleep apnea (OSA) in a high-risk population remains challenging. This study aimed to investigate clinical features to identify children with OSA combined with craniofacial photographic analysis.
Methods: One hundred and forty-five children (30 controls, 62 with primary snoring, and 53 with OSA) were included. Differences in general demographic characteristics and surface facial morphology among the groups were compared. Risk factors and prediction models for determining the presence of OSA (obstructive sleep apnea-hypopnea index> 1) were developed using logistic regression analysis.
Results: The BMI (z-score), tonsil hypertrophy, and lower face width (adjusted age, gender, and BMI z-score) were showed significantly different in children with OSA compared with primary snoring and controls (adjusted p< 0.05). The screening model based on clinical features and photography measurements correctly classified 79.3% of the children with 64.2% sensitivity and 89.1% specificity. The area under the curve of the model was 81.0 (95% CI, 73.5– 98.4%).
Conclusion: A screening model based on clinical features and photography measurements would be helpful in clinical decision-making for children with highly suspected OSA if polysomnography remains inaccessible in resource-stretched healthcare systems.
Keywords: obstructive sleep apnea, clinical features, photographic measurements, children
Introduction
Sleep-disordered breathing (SDB) describes a range of breathing problems during sleep, from primary snoring (PS) to obstructive sleep apnea (OSA).1 The morbidity rate of OSA in children is 1–5%.2 It is a frequent condition characterized by repeated events of partial or complete upper airway obstruction during sleep, and is linked to a series of consequences, including neurodevelopmental disorders, cardiopulmonary dysfunction, behavioral problems, and a reduction in learning ability.3,4 The early diagnosis of OSA is essential for disease management in patients with SDB.
In children, lymphoid tissue hyperplasia is the most common anatomical abnormality associated with OSA, and adenotonsillectomy is an effective treatment for reducing upper airway collapse.5 Some patients show incomplete or worsening resolution after surgical intervention.6,7 Upper airway volume in children undergoes dynamic changes due to the inter-reactions of maxillofacial growth, fat deposition, lymphoid tissue hyperplasia, and respiratory patterns. It is therefore critical to understand the complexity and individual differences in the etiology of OSA in children.
Craniofacial morphology is explained by genetic and environmental factors that change during periods of active growth. Compared to Caucasians, OSA in Chinese adults appear to be driven much more by the contribution of anatomical predisposition.8,9 Studies have suggested that the craniofacial features of increased face height, higher mandible angle, mandibular retrognathia, and malocclusion present with higher incidence rates in children with OSA, which may correlate with airway volume.10,11 However, due to the heterogeneity of methodology, evidence has not confirmed an association between OSA and craniofacial features.12
Lateral cephalometry, computed tomography (CT), and magnetic resonance imaging (MRI) are used for craniofacial evaluations. These methods have rarely been applied to community or pediatric sleep clinics because of their expense, time-consuming nature, and/or radiation exposure. Photographic measurements, with the advantages of non-invasiveness and easy acceptance, have been applied in adults for craniofacial assessments to predict OSA.13,14 Sutherland also confirmed that clinical photography is feasible for evaluating facial features in children with OSA.15
This study aimed to investigate facial photography and clinical features associated with SDB using craniofacial photographic analysis, and to select risk factors for OSA prevalence in children to establish a predictive model for children.
Methods
The study protocol was conducted according to the principles of the Declaration of Helsinki and was approved by the appropriate Institutional Review Board of Beijing Tongren Hospital, Capital Medical University (TRECKY2019-057). The participants’ parents signed written informed consent forms before the study for the inclusion of their children in the study and the use of photos and medical records.
Participants
All participants were 5–12 years of age and consulted at the Department of Otolaryngology, Head and Neck Surgery from 2019 to 2021. They had the clinical symptoms reported by guardians (such as snoring, witnessed apneas, mouth breathing, nasal congestion, or hearing loss) and were suspected of combined sleep-disordered breathing. Children’s guardians voluntarily participated in the study and signed informed consent forms.
The exclusion criteria were as follows: (1) failure to cooperate with clinical evaluation, facial photography, and overnight polysomnography; (2) suffering craniofacial trauma and deformity, central sleep apnea, or other severe medical or psychiatric diseases; (3) a history of maxillofacial surgery, adenotonsillectomy, and orthodontic treatment.
The participants were divided into three groups as follows:
- Controls, children with no snoring throughout the night and an obstructive apnea-hypopnea index (OAHI) ≤ 1/h;
- The PS group, children with a snoring complaint and an OAHI ≤ 1/h;
- The OSA group, children with an OAHI > 1/h.
Physical Examination
Height (in cm) and weight (kg) were measured after participants removed their shoes and outerwear. The BMI was calculated as the body weight divided by the squared height (kg/m2), and z-scores were calculated using the WHO Anthroplus™ software. Neck circumference was measured at the level of the lower edge of the cricoid cartilage. The Neck-to-height ratio was calculated as the neck circumference divided by the height (%). Otolaryngologists evaluated the scale of adenoid, tonsils, tongue, and oropharynx (see Supplemental Material).16–18
Obstructive Sleep Apnea Questionnaire-18 (OSA-18)
OSA-18 questionnaire was accomplished by the parents who fully understand their children’s condition. The Chinese version questionnaire was verified with satisfactory test-retest reliability and internal consistency.19 The OSA-18 questionnaire consisted of 18 items classified into five domains: sleep disturbance, physical suffering, emotional distress, daytime problems, and caregiver concerns. Each item was scored on a 7-point ordinal scale (all scores range from 18 to 126).20 OSA-18 questionnaire was used to assess the impact of sleep-related symptoms on quality of life in children.
Polysomnography (PSG)
All subjects completed PSG monitoring in the sleep medicine center. We used the data collection system of the Compumedics S series (Compumedics Inc, Australia) and Alice 6 (Phillips Inc, America). The following parameters were measured: electroencephalography (C3/A2, C4/A1), electrooculography, electromyography, electrocardiography, snoring, nasal and oral cannula pressure, thoracoabdominal movement, and pulse oximetry. In addition, we simultaneously captured video and audio throughout the night. Sleep stages and respiratory events were marked by the highly trained, experienced technicians following the AASM guidelines (2016).21
Craniofacial Photogrammetry
Craniofacial Photogrammetry has been widely used to evaluate maxillofacial structures in adults with OSA.9,13 We applied an accessible smartphone to photograph the front and right sides of the subjects. Subjects were required to look straight and place objects of interest in front if necessary to keep the natural head posture, and their ears were symmetrically visible in the front photo. Subjects were asked to close their mouth with lips slightly touching. The photographer placed a scale plate (3cm nylon washer) on his face. Profile photos were taken after the child turned 90 degrees left.
Quantitative measurements were performed using image analysis software (Image J version 1.8.0, NIH, Bethesda, Maryland, United States). The craniofacial marker points of interest were captured (Figure 1). The pixel coordinates (x, y) were pasted to a custom spreadsheet to calculate the distance, angle, and ratio.
 |
Figure 1 Facial landmarks in frontal and profile views. Abbreviations: Cl, calibration point (L); Cr, calibration point (R); Ns, nasion; Enl, endocanthion (L); Enr, endocanthion (R); Exl, exocanthion (L); Exr, exocanthion (R); T, tragion; Tl, tragion (L); Tr, tragion (R); Prn, prenasale, Sn, subnasion; Anl, ala nasi (L); Anr, ala nasi (R); Las, labrale superior; Lai, labrale inferior; Lal, labrale (L); Lar, labrale (R); Sto, stomion; Ul, upper lip protrusion; Ll, upper lip protrusion; Sl, sublabiale; Pog, pogonion; Me, mentum; Go, gonion; Stl, face point on stomion plane (L); Str, face point on stomion plane (R). Note: (L) = left side of the participants, (R) = right side of the participants. |
Front and right side photographs of 20 subjects were selected and measured again after a 2-week interval. The landmark digitization accuracy and test-retest reliability were indicated by intra-class correlation coefficients (ICCs). The ICCs in this study ranged between 0.872 and 0.945.
Statistical Analysis
Statistical analyses were performed using SPSS 27.0 (IBM SPSS Statistics for Windows, Version 27.0. Armonk, NY: IBM Corp). Continuous variables were analyzed using analysis of variance or the Kruskal–Wallis test. The chi-squared test or Fisher’s exact test was used for categorical variables. We compared the craniofacial parameters in the three groups using analysis of covariance, adjusted for age, sex, and BMI (z-score). Statistical significance was set at P < 0.05. The Bonferroni-corrected significance level was set at P < 0.0167 (0.05/3). Significant variables tested in the case-control analysis were fitted into a univariate logistic regression model, and the factors were pooled into multivariate regressions to further identify significant factors using forward selection (conditional). The performance of the models was evaluated using the sensitivity, specificity, and area under the curve (AUC) of the receiver operating characteristics (ROC).
Results
Participant Characteristics
One hundred and seventy-one children were enrolled in the study and 26 were excluded, as shown in Figure S1. There were no significant differences in sex, age, and BMI between the included and excluded participants (Table S1). The selected children were classified into three groups: control (n=30), PS (n=62), and OSA (n=53). In a high-risk population suspected of having adenoid hypertrophy and/or tonsillar hypertrophy, the prevalence of OSA was 36.55%. No significant differences were observed between the controls and children with PS in terms of demographic and respiratory parameters, as shown in Table 1. When compared with the control and PS groups, individuals with OSA had a higher BMI (z-score), apnea-hypopnea index, and oxygen desaturation index, and lower oxygen saturation (p<0.05).
 |
Table 1 Demographic and Respiratory Parameters Between the Participants |
Sleep-Related Symptoms and Upper Airway Structure
There were significant differences in the quality of life (QOL) as evaluated by the OSA-18 questionnaire between the controls and children with SDB (PS and OSA) (52.43±12.27, 65.63±14.25, and 65.63±14.25, respectively (p<0.001)). Children in the PS and OSA groups showed similar sleep-related symptoms and reduced quality of life (Table 2). The symptoms of loud Snoring, breath holding/pauses, choking or gasping, fragmented sleep and Caregiver concerned not enough air occurred more frequently in children with OSA compared to controls (adjusted p<0.05) (Table S2).
 |
Table 2 Comparison of the Score of OSA-18 and Pharyngeal Examination Between Groups |
The pharyngeal structures of the three groups are listed in Table 2. The pharyngeal grade, proportion of tonsil hypertrophy, and adenoid hypertrophy were significantly different among the three groups (p<0.05). Compared with the controls, there were narrow-oropharynx and nasopharyngeal regions in the OSA group due to tonsillar and adenoid enlargements (p<0.001 and p=0.001, respectively). Only a difference in oropharynx narrowing was observed between the PS and OSA groups, including the proportion of tonsil hypertrophy and pharyngeal grade (p=0.002 and p=0.005, respectively). The Friedman tongue position grading was similar in all groups (p=0.924).
Surface Facial Measurements
Based on the facial landmark measurements, the 30 craniofacial features were compared among the three groups, as shown in Table 3. The results were summarized as follows according to the different craniofacial regions.
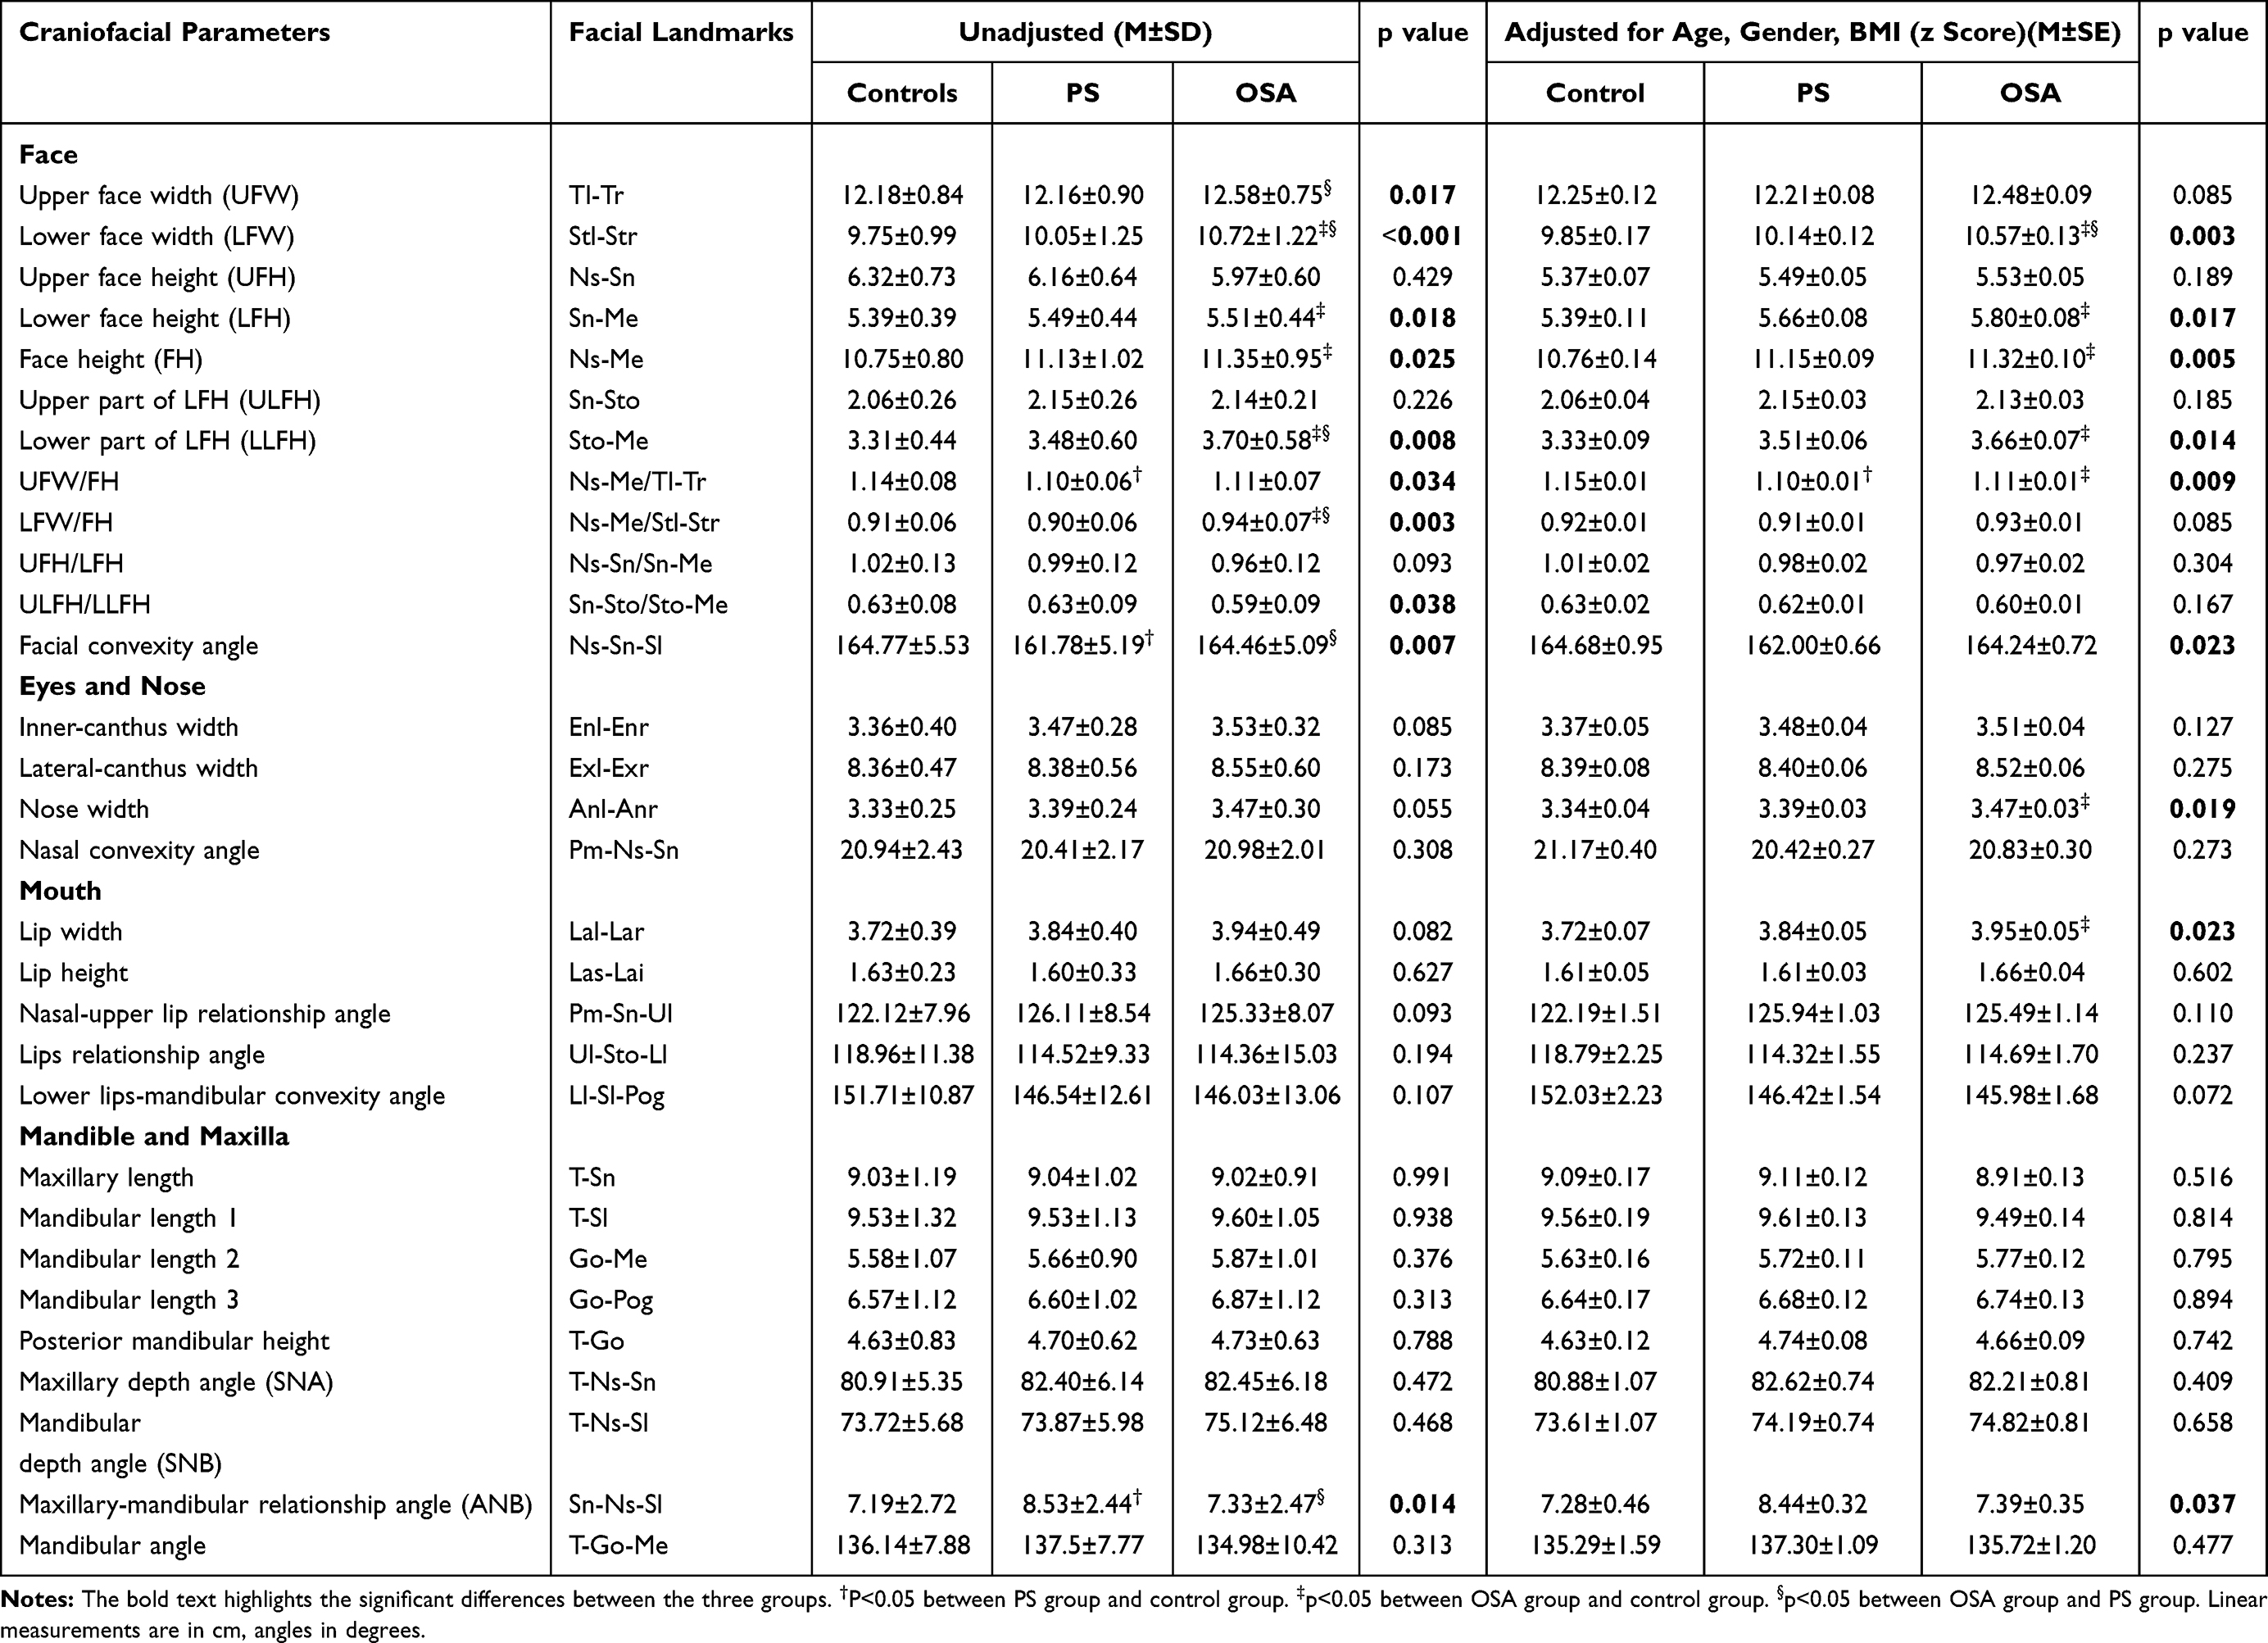 |
Table 3 Craniofacial Photogrammetry - Primary Analysis |
Face
Compared with the control group, children in the OSA group had increased face width (lower face width, LFW) and face height (face height, FH; lower face height, LFH), especially the lower part of LFH (LLFH) below the orofacial cleft (adjusted p<0.05). LFH/FH was larger in the OSA group, while UFH/FH was smaller, suggesting a more significant increase in lower facial width in children with OSA. Except for the upper facial width, the facial width and height measurements in the PS group were between those in the OSA group and the control group. In the sagittal plane, the facial convexity angle increased in children in the PS group (p=0.007). Compared to the PS group, the OSA children still had larger facial width and LLHF. Adjusted for age, sex, and BMI (z-score), the LFW is the only craniofacial parameter that effectively differentiates children with OSA from those without OSA (p=0.003).
Eyes and Nose
In the OSA group, the inner-canthus width, lateral-canthus width, and nose width tended to increase, which was not statistically significant. After controlling for sex, age, and BMI (z-score), the nasal width of children in the OSA group was significantly higher than that of the control group (adjusted p<0.05). There was no significant difference in nasal convexity angle among the groups.
Mouth
The lip morphology of children in the OSA group was similar to that of non-OSA children, including lip width, lip height, and upper and lower lip angle relationship. After controlling for sex, age, and BMI (z-score), the lip width of children in the OSA group was significantly higher than that of the control group (adjusted p<0.05).
Mandible and Maxilla
No significant differences were found in maxillary length, mandibular length, and posterior mandibular height in the groups (p>0.05). Compared with the control group, there was a trend of increasing maxillary depth angle (SNA) in the PS group, and SNA and mandibular depth angle (SNB) in the OSA group. Maxillary-mandibular relationship angle (ANB) was significantly increased in the PS group (PS 8.53±2.44 vs controls 7.19±2.72 vs OSA 7.33±2.47, p=0.014). After matching sex, age, and BMI (z-score), the above differences remained statistically significant (p=0.037).
Risk Factors for OSA in Children
The potential risk factors for OSA are presented in Table S3. The BMI (z-score), neck-to-height ratio(%), sleep disturbance scores, pharyngeal grade, tonsil hypertrophy, and adenoid hypertrophy are risk factors for OSA in children (p<0.05). Significant craniofacial risk factors for children with OSA were nose width, UFW, LFW, and LLFH. The higher the above structural measurements, the higher the risk of OSA in children.
We developed predictive models for OSA in children based on clinical symptoms, physical examination, and craniofacial measurement parameters. Multivariate stepwise logistic regression and ROC curve analyses are shown in Table 4 and Figure 2, respectively. Lower face width was the only included craniofacial parameter for OSA predicting (OR 1.703, 95% CI 1.255–2.310), which can significantly improve the model’s specificity to 73.9%. Based on the score of the OSA-18 questionnaire (Item 1–4), adenoid hypertrophy, pharyngeal grade, and lower face width, the model achieved the best performance, with 64.2% sensitivity and 89.1% specificity at the best cutoff point (0.479), classifying 79.3% of the children correctly. The AUC of the model was 81.0 (95% CI, 73.5–98.4%), the positive predictive value (PPV) was 76.0%, and the negative predictive value (NPV) was 81.4%.
 |
Table 4 The Logistic Regression Model for Predicting Children with Obstructive Sleep Apnea |
 |
Figure 2 ROC curves for predictive model. Notes: Model 1: OSA-18 questionnaire (Item 1–4); Model 2: BMI (z score), tonsil hypertrophy, adenoid hypertrophy; Model 3: Lower face width; Model 4: OSA-18 questionnaire (Item 1–4), pharyngeal grade, adenoid hypertrophy, lower face width. |
Discussion
This prospective study comprehensively compared the symptoms, signs, and facial morphology in a population at high risk of SDB aged 5–12 years, summarized the clinical characteristics of children with OSA and developed a prediction model combining craniofacial parameters for children with OSA. The lower face width was a valid indicator for identifying children with OSA. In addition, the prediction model incorporating the score of the OSA-18 questionnaire (Item 1–4), adenoid hypertrophy, pharyngeal grade, and lower facial width correctly classified 79.3% of children at high risk for the disease.
Clinical Characteristics of Children with OSA
Pediatric OSA is a heterogeneous diseases, in which the risk factors and clinical characteristics vary with subjects included. In children with 5–12 years, we analyzed the different clinical impressions in the control, PS, and OSA groups using an available questionnaire as well as physical examinations. The OSA-18 questionnaire scores could distinguish children with and without SDB, but it was not an effective tool for recognizing OSA and PS. Parents’ poor awareness of disease severity and excessive concerns about their children’s sleep problems are possible causes.22 The BMI (z-score), neck-to-height ratio(%), sleep disturbance scores, pharyngeal grade, tonsil hypertrophy, and adenoid hypertrophy are risk factors for OSA in children (p<0.05). As in previous studies, obesity, pharyngeal lymphoid hyperplasia and arrowing of the pharyngeal space were important etiological components of OSA prevalence in Chinese children. Unlike some studies,23,24 our study did not find an effect of mouth breathing on OSA. The reason for this is considered to be that the frequency, intensity and duration of mouth breathing in children have not been assessed in detail, which need to be further explored. Friedman et al showed OSA severity in adult were significantly association with Friedman tongue position (FTP), with a a correlation of 0.351 (0.094–0.564, P<0.01).25 However, FTP is not commonly used as a method of airway assessment in children, which may be related to poor cooperation in children and low inter-examiner agreement.26 Our study also confirmed that there was no significant difference in FTP scores between the groups of children.
Facial Features of Children with OSA Obtained by Craniofacial Photography
In most studies, the maxillofacial assessment method used was cephalometry, and the collected parameters mainly included the angles and distance in the sagittal plane. The contribution of maxillofacial factors to OSA onset in children remains controversial.12 Deng and Gao showed that children in the OSA group presented with a retrusive mandible, deficient chin, and a long lower face.27 Furthermore, Di Francesco et al found that dolichocephalic facial pattern (r=−0.33), mandibular plane (r=0.48), and facial depth (r=−0.33) were correlated with OSA among boys.28 However, other studies did not report significant differences in craniofacial morphology.29–31 OSA with risk factors and clinical features that vary with age among pediatric patients,32 which may explain the heterogeneous reported results.
Surface facial parameters containing skeletal and soft tissues reflect phenotypic information regarding upper airway structures.19 We comprehensively analyzed the distances, ratios, and angles of both the frontal and profile views, observing a trend towards increased coronal and vertical plane distances in children in the OSA group, which was similarly observed in adults.13 Lee et al discovered that the strongest correlations were demonstrated between tongue volume and face width when compared with BMI in adults.19 Our study identified LFW as a marker that can distinguish OSA from other children. The results still remained significant after adjusting for BMI, age, and sex. LFW may better reflect airway structure and fat distribution.
In the profile view, there were controversial viewpoints on cephalometric angles of children (maxillary depth angle, mandibular depth angle, ANB), which was explained by the heterogeneity between the studies and could be regarded as having marginal clinical significance.11,12 A study of 382 children aged 6–8 years reported an association between a more convex facial profile and higher SDB risk.33 We found that a greater ANB and convex facial profiles were observed only in the PS group after adjusting for BMI (z-score), and profile angles were insufficient to distinguish between the controls and patients with OSA. Whether the increased angular of ANB and convex facial profiles are compensatory changes in children with snoring who do not develop OSA needs further study. Our study also found an increase in nasal width and mouth width in children with OSA, and we speculate that this morphological change may be an adaptive change to the increased airway resistance in children.
Based on craniofacial photography, studies in adults suggest that Asian and Caucasian patients with OSA have similar craniofacial morphology compared to controls, including larger face width, mandibular width, and cervicomental angle.13,34 The craniofacial characteristics of Chinese children were similar to those of children in the Sutherland et al study (including 73.1% Caucasian), with OSA children tending larger facial convexity angle, longer lower facial height, and smaller maxillary-mandibular relationship angle relative to children with primary snoring.15 However, Sutherland’s study did not include frontal measurement variables to compare face width in the two groups of children, and fewer subjects were included. Our approach allows for more extensive validation. Asian adults appear to have more severe OSA at lower levels of obesity, suggesting that skeletal restriction may be more important for OSA risk in Asians,8,9 which have inferior positioning of the hyoid bone and retropositioning of the mandible examined by the CT scans. No studies have yet revealed the contribution of craniofacial restriction and increased soft tissue to OSA in children of different races. Moreover, large-scale phenotype studies of children need fully consider the confounding factors, such as the degree of obesity, adenotonsillar hypertrophy, mouth breathing, and growth status affecting the maxillofacial structure.
Applicability of Craniofacial Feature-Based Models for Predicting OSA
Overnight polysomnography remains the gold standard for diagnosing OSA, but this method is limited by its availability and accessibility. Questionnaires and physical examinations are often essential for OSA screening. The OSA-18 questionnaire was used for QOL assessment in children, which hardly predicted OSA due to its poor sensitivity (0.53).35 In our study, the total and five domain scores of the OSA-18 were used in the logistic regression analysis; items of sleep disturbance achieved higher accuracy (70.3%) and sensitivity (66.0%). In adults, craniofacial photographic measurements (face width, eye width, cervicomental angle, and mandibular length) correctly classified 76.1% of individuals with or without OSA.36 In children, only the LFW could be used for OSA prediction in high-risk children, with a sensitivity of 60.4% and a specificity of 73.9%. Based on symptom questionnaires, pharyngeal structures, and facial measurements, the model could effectively distinguish between children without the disease. Continuous follow-up or sleep breathing monitoring assisted in clinical decision-making for children with highly suspected OSA. Although we fully considered the effects of obesity, anatomy, and lymphoproliferation in children, non-anatomical factors remain an essential part of the phenotyping analyses and for improving the prediction ability in future studies, such as loop gain.37,38
Limitations
The present study had some limitations. First, the proportion of children with moderate-to-severe OSA in the study sample was small, and a subgroup analysis was not performed according to disease severity. Second, two-dimensional photographs might still be unable to provide nonlinear information, such as shape and contour; further studies are still needed to demonstrate the relationship between surface facial structures and the soft tissue and skeletal structures of the upper airway. Third, the external validity of predictive models requires further validation, and the cost and benefit of medical care using this predictive model in children require further cost-benefit or cost-utility analyses.
Conclusion
This study demonstrated the different clinical manifestations and facial morphologies of children with OSA. Obesity, narrowing of the pharynx, and lower face imbalance can distinguish children with OSA from primary snorers. The addition of surface craniofacial structures improves the performance of prediction models in children, which will help with the early identification of OSA in children if PSG remains inaccessible in resource-stretched healthcare systems.
Abbreviations
AHI, Apnea-hypopnea Index; BMI, Body Mass Index; ICCs, Intra-class Correlation Coefficients; LSaO2, the Lowest Oxygen Saturation; OAHI, Obstructive Sleep Apnea-hypopnea Index; ODI, Oxygen Desaturation Index; OSA, Obstructive Sleep Apnea; SDB, Sleep-disordered Breathing; PS, Primary Snoring; PSG, Polysomnography.
Acknowledgments
The authors would like to thank the study participants, technologists, and physicians at the Department of Otolaryngology-Head and Neck Surgery, Beijing Tongren Hospital.
Author Contributions
All authors contributed to data analysis, drafting or revising the article, have agreed on the journal to which the article will be submitted, gave final approval of the version to be published, and agree to be accountable for all aspects of the work.
Funding
This study was funded by National Natural Science Foundation of China (81970866), the Consulting research project of Chinese Academy of Engineering (2019-XZ-29).
Disclosure
The authors report no conflicts of interest in this work.
References
1. Sheldon SH, Ferber R, Kryger MH, et al. Principles and Practice of Pediatric Sleep Medicine. Elsevier Inc; 2014.
2. Marcus CL, Brooks LJ, Draper KA, et al; American academy of pediatrics. Diagnosis and management of childhood obstructive sleep apnea syndrome. Pediatrics. 2012;130(3):576–584. doi:10.1542/peds.2012-1671
3. Nosetti L, Zaffanello M, Katz ES, et al. Twenty-year follow-up of children with obstructive sleep apnea. J Clin Sleep Med. 2022;18(6):1573–1581. doi:10.5664/jcsm.9922
4. Capdevila OS, Kheirandish-Gozal L, Dayyat E, et al. Pediatric obstructive sleep apnea: complications, management, and long-term outcomes. Proc Am Thorac Soc. 2008;5(2):274–282. doi:10.1513/pats.200708-138MG
5. Liu CN, Kang KT, Yao CJ, et al. Changes in cone-beam computed tomography pediatric airway measurements after adenotonsillectomy in patients with OSA. JAMA Otolaryngol Head Neck Surg. 2022;148(7):621–629. doi:10.1001/jamaoto.2022.0925
6. Huang YS, Guilleminault C, Lee LA, et al. Treatment outcomes of adenotonsillectomy for children with obstructive sleep apnea: a prospective longitudinal study. Sleep. 2014;37(1):71–76. doi:10.5665/sleep.3310
7. Maeda K, Tsuiki S, Nakata S, et al. Craniofacial contribution to residual obstructive sleep apnea after adenotonsillectomy in children: a preliminary study. J Clin Sleep Med. 2014;10(9):540–547. doi:10.5664/jcsm.4028
8. O’Driscoll DM, Landry SA, Pham J, et al. The physiological phenotype of obstructive sleep apnea differs between caucasian and Chinese patients. Sleep. 2019;42(11):zsz186. doi:10.1093/sleep/zsz186
9. Sutherland K, Lee RWW, Chan TO, et al. Craniofacial phenotyping in Chinese and caucasian patients with sleep apnea: influence of ethnicity and sex. J Clin Sleep Med. 2018;14(7):1143–1151. doi:10.5664/jcsm.7212
10. de Oliveira I, Pinheiro R, Freitas B, et al. Relationship between craniofacial and dental arch morphology with pharyngeal airway space in adolescents. J Orofac Orthop. 2022. English. doi:10.1007/s00056-022-00403-9
11. Flores-Mir C, Korayem M, Heo G, et al. Craniofacial morphological characteristics in children with obstructive sleep apnea syndrome: a systematic review and meta-analysis. J Am Dent Assoc. 2013;144(3):269–277. doi:10.14219/jada.archive.2013.0113
12. Fagundes NCF, Gianoni-Capenakas S, Heo G, et al. Craniofacial features in children with obstructive sleep apnea: a systematic review and meta-analysis. J Clin Sleep Med. 2022;18(7):1865–1875. doi:10.5664/jcsm.9904
13. Lee RW, Chan AS, Grunstein RR, et al. Craniofacial phenotyping in obstructive sleep apnea--a novel quantitative photographic approach. Sleep. 2009;32(1):37–45.
14. He S, Li Y, Xu W, et al. The predictive value of photogrammetry for obstructive sleep apnea. J Clin Sleep Med. 2021;17(2):193–202. doi:10.5664/jcsm.8836
15. Sutherland K, Weichard AJ, Davey MJ, et al. Craniofacial photography and association with sleep-disordered breathing severity in children. Sleep Breath. 2020;24(3):1173–1179. doi:10.1007/s11325-019-01928-x
16. Friedman M, Tanyeri H, La Rosa M, et al. Clinical predictors of obstructive sleep apnea. Laryngoscope. 1999;109(12):1901–1907. doi:10.1097/00005537-199912000-00002
17. Brodsky L. Modern assessment of tonsils and adenoids. Pediatr Clin North Am. 1989;36(6):1551–1569. doi:10.1016/S0031-3955(16)36806-7
18. Schwab RJ, Leinwand SE, Bearn CB, et al. Digital morphometrics: a new upper airway phenotyping paradigm in OSA. Chest. 2017;152(2):330–342. doi:10.1016/j.chest.2017.05.005
19. Huang Y-S, Hwang F-M, Lin C-H, et al. Clinical manifestations of pediatric obstructive sleep apnea syndrome: clinical utility of the Chinese-version obstructive sleep apnea questionaire-18. Psychiatry Clin Neurosci. 2015;69(12):752–762. doi:10.1111/pcn.12331
20. Franco RA Jr, Rosenfeld RM, Rao M. First place--resident clinical science award 1999. Quality of life for children with obstructive sleep apnea. Otolaryngol Head Neck Surg. 2000;123(1 Pt 1):9–16. doi:10.1067/mhn.2000.105254
21. Malhotra RK, Kirsch DB, Kristo DA, et al; American Academy of Sleep Medicine Board of Directors. Polysomnography for obstructive sleep apnea should include arousal-based scoring: an American academy of sleep medicine position statement. J Clin Sleep Med. 2018;14(7):1245–1247. doi:10.5664/jcsm.7234
22. Carroll JL, McColley SA, Marcus CL, et al. Inability of clinical history to distinguish primary snoring from obstructive sleep apnea syndrome in children. Chest. 1995;108(3):610–618. doi:10.1378/chest.108.3.610
23. Markkanen S, Rautiainen M, Himanen SL, et al. Snoring toddlers with and without obstructive sleep apnoea differed with regard to snoring time, adenoid size and mouth breathing. Acta Paediatr. 2021;110(3):977–984. doi:10.1111/apa.15496
24. Soh HJ, Rowe K, Davey MJ, et al. The OSA-5: development and validation of a brief questionnaire screening tool for obstructive sleep apnea in children. Int J Pediatr Otorhinolaryngol. 2018;113:62–66. doi:10.1016/j.ijporl.2018.07.029
25. Friedman M, Hamilton C, Samuelson CG, et al. Diagnostic value of the Friedman tongue position and Mallampati classification for obstructive sleep apnea: a meta-analysis. Otolaryngol Head Neck Surg. 2013;148(4):540–547. doi:10.1177/0194599812473413
26. Sundman J, Fehrm J, Friberg D. Low inter-examiner agreement of the Friedman staging system indicating limited value in patient selection. Eur Arch Otorhinolaryngol. 2018;275(6):1541–1545. doi:10.1007/s00405-018-4970-z
27. Deng J, Gao X. A case--control study of craniofacial features of children with obstructed sleep apnea. Sleep Breath. 2012;16(4):1219–1227. doi:10.1007/s11325-011-0636-4
28. Di Francesco R, Monteiro R, Paulo MLDM, et al. Craniofacial morphology and sleep apnea in children with obstructed upper airways: differences between genders. Sleep Med. 2012;13(6):616–620. doi:10.1016/j.sleep.2011.12.011
29. Au CT, Chan KCC, Liu KH, et al. Potential anatomic markers of obstructive sleep apnea in prepubertal children. J Clin Sleep Med. 2018;14(12):1979–1986. doi:10.5664/jcsm.7518
30. Pirilä-Parkkinen K, Löppönen H, Nieminen P, et al. Cephalometric evaluation of children with nocturnal sleep-disordered breathing. Eur J Orthod. 2010;32(6):662–671. doi:10.1093/ejo/cjp162
31. Wang W, Wang Y, Wang X. [Cephalometry study of craniofacial growth in mixed dentition with OSAHS children]. Lin Chung Er Bi Yan Hou Tou Jing Wai Ke Za Zhi. 2012;26(24):1127–1129. Chinese.
32. Chuang HH, Hsu JF, Chuang LP, et al. Differences in anthropometric and clinical features among preschoolers, school-age children, and adolescents with obstructive sleep apnea-a hospital-based study in Taiwan. Int J Environ Res Public Health. 2020;17(13):4663. doi:10.3390/ijerph17134663
33. Ikävalko T, Närhi M, Lakka T, et al. Lateral facial profile may reveal the risk for sleep disordered breathing in children--the PANIC-study. Acta Odontol Scand. 2015;73(7):550–555. doi:10.3109/00016357.2014.997795
34. Sutherland K, Lee RW, Petocz P, et al. Craniofacial phenotyping for prediction of obstructive sleep apnoea in a Chinese population. Respirology. 2016;21(6):1118–1125. doi:10.1111/resp.12792
35. Incerti Parenti S, Fiordelli A, Bartolucci ML, et al. Diagnostic accuracy of screening questionnaires for obstructive sleep apnea in children: a systematic review and meta-analysis. Sleep Med Rev. 2021;57:101464. doi:10.1016/j.smrv.2021.101464
36. Lee RWW, Petocz P, Prvan T, et al. Prediction of obstructive sleep apnea with craniofacial photographic analysis. Sleep. 2009;32(1):46–52.
37. Amin R, Khoo M. Loop gain in paediatric sleep-disordered breathing: a different story from adults. Respirology. 2020;25(11):1119–1120. doi:10.1111/resp.13897
38. Bokov P, Matrot B, Medjahdi N, et al. Crosssectional study of loop gain abnormalities in childhood obstructive sleep apnea syndrome. Sleep Med. 2020;69:172–178. doi:10.1016/j.sleep.2020.01.023
 © 2023 The Author(s). This work is published and licensed by Dove Medical Press Limited. The
full terms of this license are available at https://www.dovepress.com/terms
and incorporate the Creative Commons Attribution
- Non Commercial (unported, 3.0) License.
By accessing the work you hereby accept the Terms. Non-commercial uses of the work are permitted
without any further permission from Dove Medical Press Limited, provided the work is properly
attributed. For permission for commercial use of this work, please see paragraphs 4.2 and 5 of our Terms.
© 2023 The Author(s). This work is published and licensed by Dove Medical Press Limited. The
full terms of this license are available at https://www.dovepress.com/terms
and incorporate the Creative Commons Attribution
- Non Commercial (unported, 3.0) License.
By accessing the work you hereby accept the Terms. Non-commercial uses of the work are permitted
without any further permission from Dove Medical Press Limited, provided the work is properly
attributed. For permission for commercial use of this work, please see paragraphs 4.2 and 5 of our Terms.