Back to Journals » Infection and Drug Resistance » Volume 16
Clinical and Computed Tomography Features Associated with Multidrug-Resistant Pulmonary Tuberculosis: A Retrospective Study in China
Authors Li CH, Fan X ![]() , Lv SX, Liu XY, Wang JN, Li YM
, Lv SX, Liu XY, Wang JN, Li YM ![]() , Li Q
, Li Q
Received 19 October 2022
Accepted for publication 6 January 2023
Published 30 January 2023 Volume 2023:16 Pages 651—659
DOI https://doi.org/10.2147/IDR.S394071
Checked for plagiarism Yes
Review by Single anonymous peer review
Peer reviewer comments 2
Editor who approved publication: Prof. Dr. Héctor Mora-Montes
Chun-Hua Li,1,2,* Xiao Fan,3,* Sheng-Xiu Lv,2 Xue-Yan Liu,1,2 Jia-Nan Wang,2 Yong-Mei Li,1 Qi Li1
1Department of Radiology, The First Affiliated Hospital of Chongqing Medical University, Chongqing, People’s Republic of China; 2Department of Radiology, Chongqing Public Health Medical Center, Chongqing, People’s Republic of China; 3Department of Radiology, Children’s Hospital of Chongqing Medical University, National Clinical Research Center for Child Health and Disorders, Ministry of Education Key Laboratory of Child Development and Disorders, Chongqing, People’s Republic of China
*These authors contributed equally to this work
Correspondence: Qi Li; Yong-Mei Li, Department of Radiology, The First Affiliated Hospital of Chongqing Medical University, No. 1 Youyi Road, Yuzhong District, Chongqing, 400016, People’s Republic of China, Tel +0086 15823408652, Fax +0086 23 68811487, Email [email protected]; [email protected]
Purpose: To explore the value of integrating clinical and computed tomography (CT) features to predict multidrug-resistant pulmonary tuberculosis (MDR-PTB).
Patients and Methods: The study included 212 patients with MDR-PTB and 180 patients with drug-sensitive pulmonary tuberculosis (DS-PTB) who referred to our institute in China between January 2016 and March 2021. The clinical and CT characteristics were analyzed and compared between both groups. Multivariable logistic regression analysis was performed to identify independent factors that can be used to predict MDR-PTB. Furthermore, 115 patients admitted to another center from January 2019 to January 2022 were included as external validation cohort.
Results: For clinical characteristics, five parameters were significantly different between the two groups (all P < 0.05). With regard to CT features, nine parameters were significantly different between the two groups (all P < 0.05). Multivariable logistic regression analysis using the aforementioned differential features showed that male sex, retreated history, longer duration of previous anti-TB treatment, lower CD4+ T lymphocyte count, thick-walled cavity, centrilobular micronodules and tree-in-bud sign, bronchial stenosis, pleural and pericardial thickening were the most effective variations associated with MDR-PTB with an area under the curve (AUC) of 0.849 and accuracy of 78.6%. Furthermore, the external validation cohort that contains 115 patients obtained an AUC of 0.933 and accuracy of 81.7%.
Conclusion: MDR-PTB and DS-PTB have different clinical and imaging characteristics. A combined model incorporating these differential features can promptly diagnose MDR-PTB and develop subsequent therapeutic strategies.
Keywords: tuberculosis, multidrug-resistant tuberculosis, computed tomography
Introduction
Pulmonary tuberculosis (PTB) is one of the epidemics that highly threaten global public health. The World Health Organization (WHO) defines multidrug-resistant pulmonary tuberculosis (MDR-PTB) as resistant to both isoniazid and rifampicin.1 MDR-PTB requires longer and more complex treatment in addition to higher financial costs compared with drug-sensitive pulmonary tuberculosis (DS-PTB).2 Furthermore, the treatment success rate for MDR/rifampicin-resistant pulmonary tuberculosis was 60%, according to the WHO Global tuberculosis report 2022.1 Early MDR-PTB diagnosis is crucial in choosing an appropriate and personalized treatment strategy and thus improving the treatment efficacy.
The most common method to diagnose MDR-PTB is a sputum smear and drug sensitivity test. However, drug sensitivity test results have been revealed to often lack high sensitivity and sufficient stability, which might be attributed to low bacterial load within samples or technical issues, and usually take a long time, often weeks.1 Recently, molecular biological testing has played an increasingly important role in the repertoire of infectious disease diagnostics. However, this method is time consuming and not feasible for all hospitals because of limited equipment and technology. Therefore, a fast and convenient approach to identifying MDR-PTB is highly desirable. Computed tomography (CT) is of great value for early PTB diagnosis and therapeutic effect assessments. Previous studies have revealed that CT imaging is a promising noninvasive alternative for predicting MDR-PTB.3,4 To our best knowledge, the combination of clinical and radiological features of MDR-PTB in producing a better predictive performance has not been fully clarified.
Therefore, this study aimed to investigate the value of integrating clinical and CT features to predict MDR-PTB, thereby providing more clues for its early diagnosis.
Materials and Methods
Patients
The study protocol was approved by the ethics committee of the First Affiliated Hospital of Chongqing Medical University. Additionally, because of the retrospective nature of this research, the need for informed consent was waived. A total of 463 consecutive patients with PTB who were confirmed through sputum smear and sensitive molecular and microbial tests via flow cytometer according to the WHO criteria underwent chest CT examinations from January 2016 to March 2021. Considering that PTB patients with different immune status may exhibit distinct chest CT findings, 71 patients who have diabetes, pneumoconiosis, and lung cancer; are positive for human immunodeficiency virus, or are taking immunosuppressive drugs were excluded. Finally, 392 patients were included in this study. All patients were divided into the MDR-PTB group (n = 212) and DS-PTB group (n = 180) according to drug sensitivity test results. A drug susceptibility test was conducted using the proportion method before treatment. Furthermore, the external validation cohort included 115 patients who are admitted to another center from January 2019 to January 2022.
Clinical Data Collection
This study recorded and analyzed the following clinical characteristics of patients: 1) age; 2) gender (male and female); 3) anti-TB treatment history (initial treatment [patients who have never received anti-TB treatment or those with a therapeutic duration of <1 month] and retreatment [patients who received anti-TB treatment for >1 month]); 4) previous anti-TB treatment duration; and 5) laboratory results (CD3+ T lymphocyte count, CD4+ T lymphocyte count, CD8+ T lymphocyte count, and CD4/CD8+ T lymphocyte count ratio).
CT Protocols
Chest CT examinations were conducted using Optima CT 680 Expert (GE Healthcare), Toshiba Aquilion 16 (Toshiba Medical Systems), or Discovery CT 750HD (GE Healthcare) scanner. All patients underwent non-contrast-enhanced scanning from the thoracic inlet to the lung base in the supine position. The following imaging parameters were used: tube voltage of 120 kVp, tube current of 50–250 mAs (automatic tube current modulation technology), slice thickness of 5 mm, and interval of 5 mm on axial images. Subsequently, all CT images were reconstructed with a slice thickness and slice interval of 1 or 1.25 mm and 1 or 1.25 mm, respectively, for imaging analysis.
CT Image Analysis
CT images were independently interpreted by two radiologists with >10 years of experience in chest imaging on a picture archiving and communication system (PACS) workstation (Vue PACS, Carestream). Any disagreements were resolved by discussion until a consensus was reached. The CT features of the lesions were carefully analyzed as follows: 1) distribution: single lobe (upper, middle, or lower lobe) and multiple lobes (right multiple lobes, left multiple lobes, and bilateral multiple lobes); 2) cavity: the presence of a cavity, a cavity number of ≥3, and cavity shape (free-walled cavity, thin-walled cavity [wall thickness of ≤3 mm], and thick-walled cavity [wall thickness of >3 mm]); 3) centrilobular micronodules and tree-in-bud (TIB) pattern; 4) consolidation; 5) ground-glass opacity (GGO); 6) fibrous tracts; 7) calcification; 8) destroyed lung; 9) bronchial changes: bronchiectasis and bronchial stenosis; 10) pleural changes: pleural effusion, thickening, and calcification; 11) intrathoracic lymph node changes: lymphadenopathy (hilar or mediastinal lymph nodes with a short-axis diameter of >1 cm) and lymph node calcification; 12) pericardial changes: pericardial effusion and pericardial thickening (thickness of >4 mm).
Statistics Analysis
The Statistical Package for the Social Sciences statistical software package was used for statistical analyses (SPSS, version 19.0 for Windows; IBM; NY, USA). First, the Kolmogorov–Smirnov analysis was used for testing the normality of continuous variables. Normally distributed quantitative data were expressed as mean ± standard deviation and analyzed using two-independent samples Student’s t-test, whereas nonnormally distributed data were presented as median ± interquartile range and assessed using the Mann–Whitney U-test. Categorical variables were expressed as numbers and percentages and evaluated using the Chi-squared test. A two-sided p-value of <0.05 was considered significantly different. Moreover, the diagnostic consistency of the CT features of the lesions was assessed using an intraclass correlation coefficient (ICC), and an ICC of >0.75 was considered indicative of a good agreement between the two observers. Multivariable logistic regression analysis was then applied using clinical and CT features that differed significantly between the two groups to select independent predictors of MDR-PTB. The forward condition method was used to select the final regression model, and the area under the receiver operating characteristic curve (AUC), accuracy, sensitivity, and specificity were used to evaluate the diagnostic performance.
Results
Observer Reproducibility
The agreement between the two observers was fairly good for all CT features. The ICC values for the distribution, presence of cavity, cavity number, free-walled cavity, thin-walled cavity, thick-walled cavity, centrilobular micronodules and TIB pattern, consolidation, GGO, fibrous tracts, calcification, destroyed lung, bronchiectasis, bronchial stenosis, pleural effusion, pleural thickening, pleural calcification, lymphadenopathy, lymph node calcification, pericardial effusion, and pericardial thickening were 0.972, 0.961, 0.923, 0.917, 0.928, 0.930, 0.921, 0.898, 0.925, 0.929, 0.971, 0.892, 0.927, 0.876, 0.915, 0.951, 0.968, 0.923, 0.967, 0.910, and 0.875, respectively (all P < 0.001).
Comparison of Clinical Characteristics Between the MDR-PTB and DS-PTB Groups
Table 1 shows the clinical characteristics of patients in both groups. Patients with MDR-PTB were more frequently observed in males and retreated patients, as well as in those with a longer period of previous anti-TB treatment, a lower CD4+ T lymphocyte count, and a lower CD4+/CD8+ T lymphocyte count ratio, compared with those with DS-PTB (all P < 0.05). However, no significant differences were observed in age and CD3+ and CD8+ T lymphocyte count between the two groups (P > 0.05).
 |
Table 1 Comparison of Clinical Characteristics Between Multidrug-Resistant and Drug-Sensitive Pulmonary Tuberculosis |
Comparison of CT Features Between the MDR-PTB and DS-PTB Groups
Table 2 illustrates CT features of lesions in both groups. The presence of a cavity, a cavity number of ≥3, free-walled and thick-walled cavities, centrilobular micronodules and TIB sign, destroyed lung, bronchial stenosis, pleural and pericardial thickening were more common in the MDR-PTB group compared with the DS-PTB group (all P < 0.05) (Figures 1–3). However, no significant differences were observed in the distribution of lesions, thin-walled cavity, consolidation, GGO, fibrous tracts, calcification, bronchiectasis, pleural effusion and calcification, lymphadenopathy, lymph node calcification, and pericardial effusion between both groups (all P > 0.05).
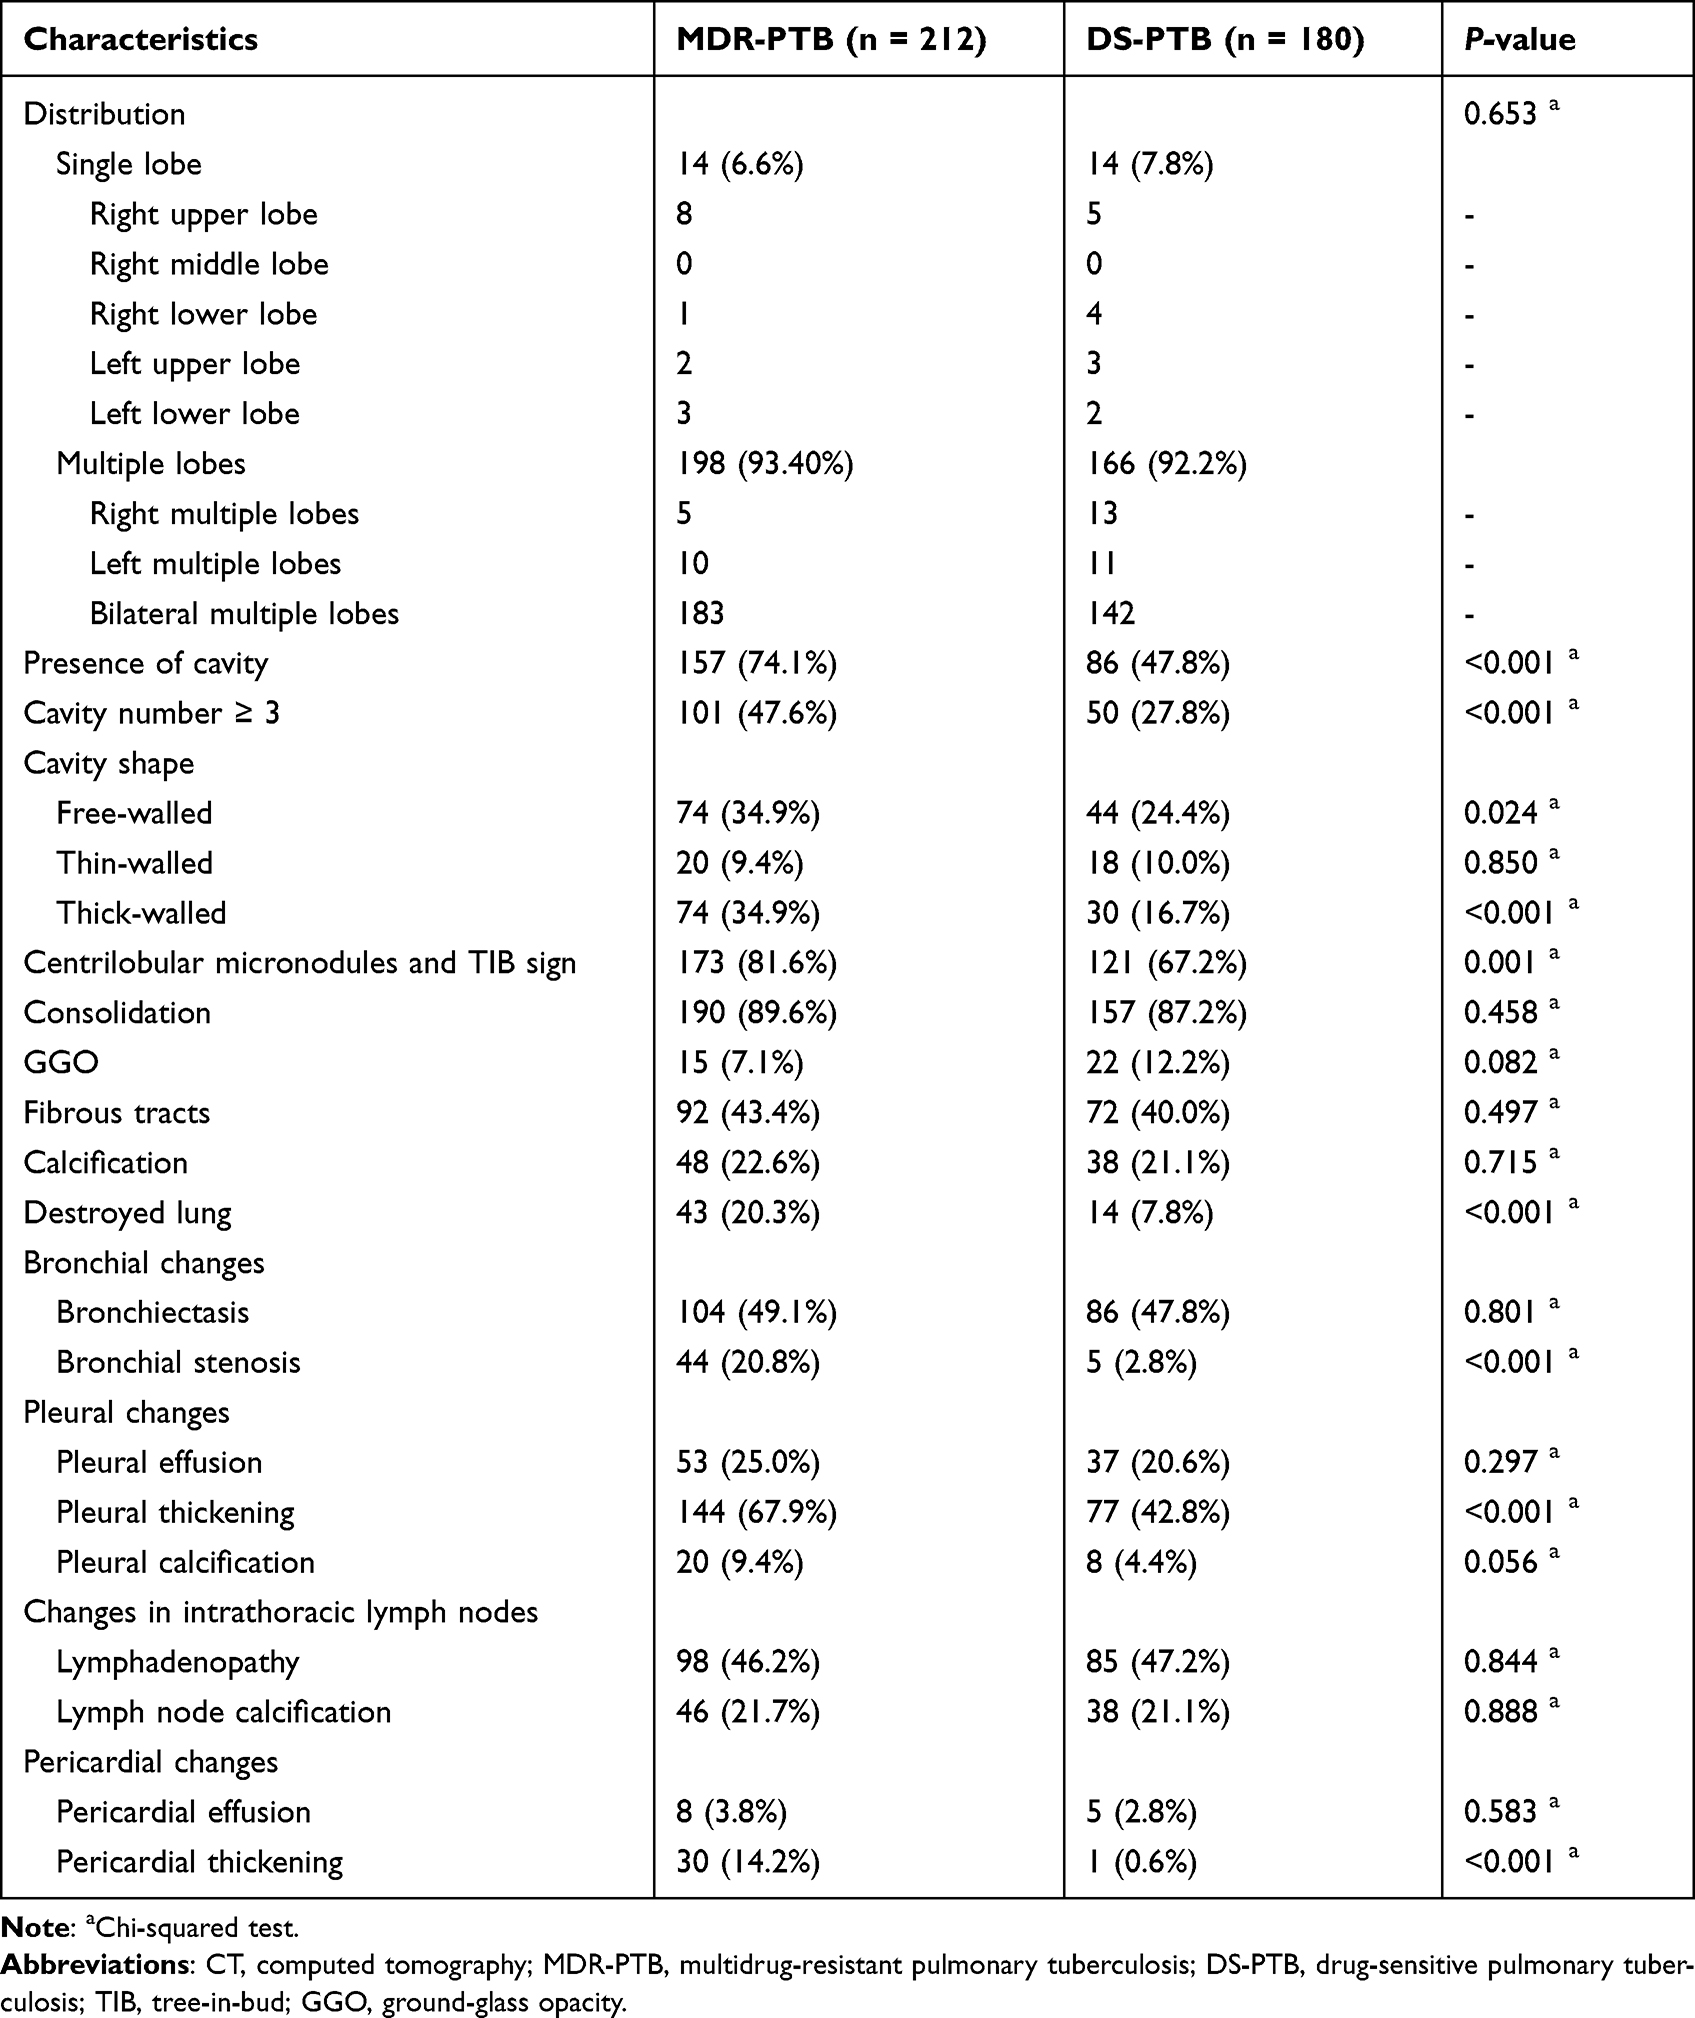 |
Table 2 Comparison of CT Features Between Multidrug-Resistant and Drug-Sensitive Pulmonary Tuberculosis |
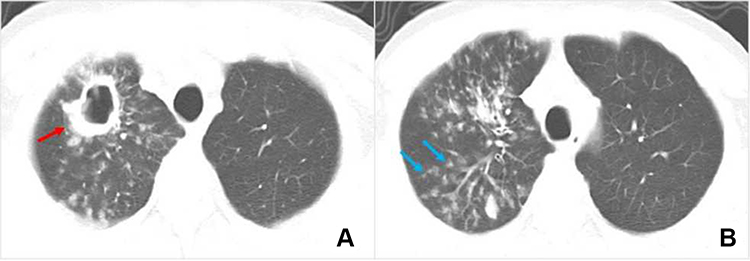 |
Figure 1 Multidrug-resistant pulmonary tuberculosis in a 32-year-old male patient. (A and B) Axial computed tomography images of the lung window indicate a thick-walled cavity (red arrow), patchy consolidation, and centrilobular micronodules and tree-in-bud sign (blue arrow) in the right upper lobe. |
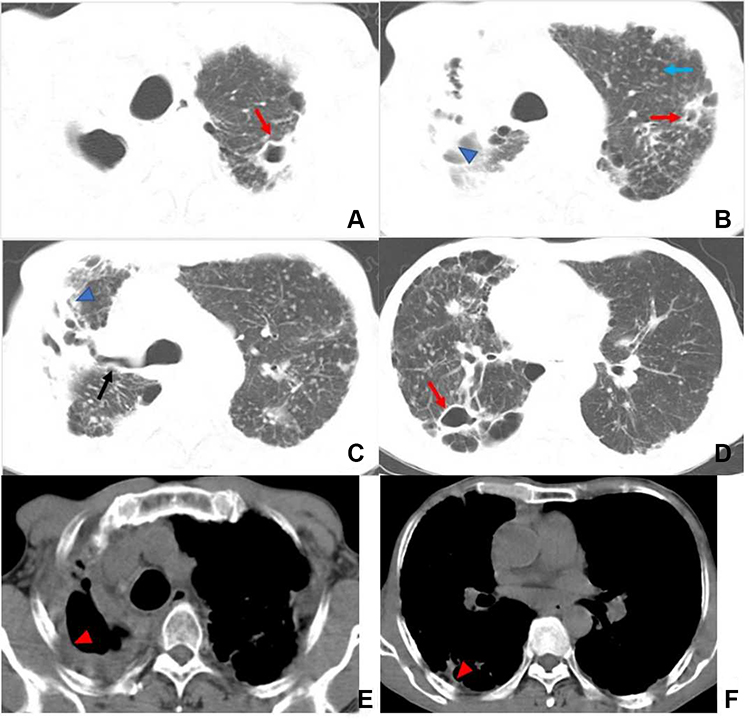 |
Figure 2 Multidrug-resistant pulmonary tuberculosis in a 48-year-old male patient. (A–D) Axial computed tomography images of the lung window indicate multiple cavities (red arrow), centrilobular micronodules and tree-in-bud sign (blue arrow), right main bronchus stenosis (black arrow), and right upper lobe destruction with bronchiectasis and distortion (blue arrowhead). (E and F) Axial computed tomography images of the mediastinal window indicate right pleural thickening (red arrowhead). |
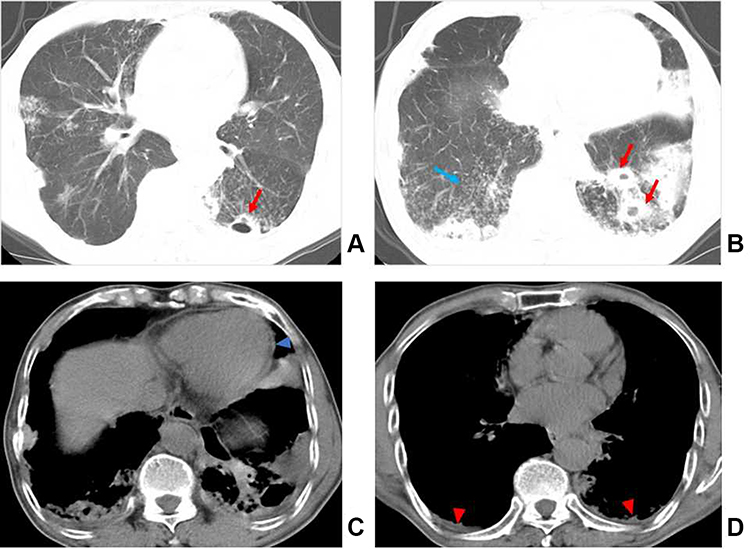 |
Figure 3 Multidrug-resistant pulmonary tuberculosis in a 77-year-old male patient. (A and B) Axial computed tomography images of the lung window indicate multiple thick-walled cavities (red arrow), consolidation, and centrilobular micronodules and tree-in-bud sign (blue arrow) in both lungs. (C and D) Axial computed tomography images of the mediastinal window indicate pericardial thickening (blue arrowhead) and bilateral pleural thickening (red arrowhead). |
Multivariable Logistic Regression Analysis
Gender (adjusted odds ratio [hereinafter referred to as OR]: 1.898, 95% confidence interval [CI]:1.131–3.185; P = 0.015); history of anti-TB treatment (OR: 2.359, 95% CI:1.289–4.318; P = 0.005); duration of previous anti-TB treatment (OR: 1.079, 95% CI:1.032–1.129; P = 0.001); CD4+ T lymphocyte count (OR: 0.999, 95% CI:0.998–1.000; P = 0.024); thick-walled cavity (OR: 2.168, 95% CI:1.193–3.939; P = 0.011); centrilobular micronodules and TIB sign (OR: 3.099, 95% CI:1.682–5.710; P < 0.001); bronchial stenosis (OR: 7.187, 95% CI:2.153–23.996; P = 0.001); pleural thickening (OR: 1.812, 95% CI:1.095–2.999; P = 0.021); and pericardial thickening (OR: 26.809, 95% CI:3.084–233.032; P = 0.003) were the independent predictors of MDR-PTB via multivariate logistic regression analysis for the model with clinical and CT characteristics that significantly differed between the two groups. The AUC, sensitivity, specificity, and accuracy for the logistic regression function (P = 1/ (1 + e (2.276 − 0.641 * male sex − 0.858 * retreatment − 0.076 * duration of previous anti-TB treatment + 0.001 * CD4+ T lymphocyte count − 0.774 * thick-walled cavities − 1.131 * centrilobular micronodules and TIB sign − 1.972 * bronchial stenosis – 0.595 * pleural thickening − 3.289 * pericardial thickening))) was 0.849, 75.9%, 81.7%, and 78.6%, respectively. Furthermore, an external validation cohort that contains 115 patients obtained an AUC, sensitivity, specificity, and accuracy of 0.933, 88.9%, 75.4%, and 81.7%, respectively.
Discussion
The present study first compared the clinical and CT features of 212 patients with MDR-PTB and 180 patients with DS-PTB and then developed and validated a multivariable logistic regression model for predicting MDR-PTB. This retrospective analysis produced a key finding that the combined model incorporating clinical and CT features is valuable to the early diagnosis of MDR-PTB, especially in some cases where diagnosing determined by laboratory testing is difficult.
In terms of clinical characteristics, we found that patients with MDR-PTB were more frequently observed in males, which is consistent with previous studies in Western Asia (Iran and Israel).5–7 However, some scholars suggested that male sex was not a risk factor for MDR-PTB.8,9 These conflicting results among studies may be attributed to differences in sample sizes. Additionally, this study revealed that a retreated history and a longer period of previous anti-TB treatment were more common in patients with MDR-PTB than in those with DS-PTB, which corroborates some previous studies.8–12 Anti-TB treatment times, adverse reactions, and interrupted or failed treatment have been reported many times as risk factors of MDR-PTB, which inevitably prolong the treatment period. Moreover, our results showed that CD4+ T and CD4/CD8+ T lymphocyte count ratio was lower in patients with MDR-PTB than in those with DS-PTB. CD4+ T cells have great importance in the memory response to Mycobacterium tuberculosis infection and contribute to pathology.13 CD8+ T cell immunity offers evidence of their clear synergy of action and complementarities in association with CD4+ T cell immunity.14 Recently, a few studies have reported correlations between CD4+ cell level and MDR-PTB. Some scholars indicated that patients with MDR-PTB had a lower CD4+ T cell level than those with DS-PTB,15,16 which is in accord with our results, whereas others held the opposite view.17–19 Different literature outcomes between CD4+ cell count and MDR-PTB may be related to heterogeneity in patients’ basic data, including disease severity, disease course, association with diabetes mellitus, and different TB strains among studies.17,20,21
Regarding CT features, 21 morphological features of TB lesions were compared between both groups, and 9 CT features significantly differed. This study revealed that the presence of a cavity, a cavity number of ≥3, free-walled and thick-walled cavities, centrilobular micronodules and TIB sign, destroyed lung, bronchial stenosis, pleural and pericardial thickening were suggestive of MDR-PTB. Previous studies have shown that cavity was more frequently observed in MDR-PTB than in DS-PTB.9,22 Furthermore, some scholars indicated that multiple cavities (≥3 in number) with thick-walled status were the most promising imaging sign for identifying MDR-PTB.23,24 These findings are in agreement with our results. Cavity walls, particularly thick walls with remodeling of the fibrotic wall, serve as favorable barriers; consequently, attaining an effective drug concentration in the cavities is difficult, thereby resulting in repeated and continuous bacterial excretion and a high baseline load of TB bacteria, which may increase the possibility of spontaneous gene mutation of drug-resistant bacterial groups.3,25 Therefore, cavities are considered not only an important way of TB transmission but also the biological basis of drug resistance.26,27 Free-walled cavities, also named mouth-eaten cavities, were closely related to caseous pneumonia. A recent study28 showed that MDR-PTB had a higher free-walled cavity occurrence than DS-PTB, which was similar to our findings. However, Li et al3 and Song et al4 found no significant association between free-walled cavity and MDR-PTB. These inconsistent results may be because of sampling bias. Centrilobular micronodules and TIB patterns are the most common CT findings of active PTB.29 Pathologically, these CT features reflect the bronchogenic spread of caseation necrosis materials and the filling of granulomatous inflammation into terminal respiratory bronchioles and alveolar ducts.30,31 The present study revealed that the high TIB pattern frequency in MDR-PTB may be explained by the increased risk of bronchogenic spread because of cavities, especially multiple cavities, which are predominantly present in MDR-PTB. This finding can be supported by some previous study results.23,32–34 Additionally, our results showed that destroyed lung, bronchial stenosis, pleural and pericardial thickening were frequently observed in MDR-PTB, which were less commonly mentioned in the previous studies. The aforementioned CT features are closely associated with extensive fibrous tissue hyperplasia and bronchopulmonary structure destruction and are highly suggestive of a chronic TB course, which are consistent with some clinical features (eg, retreated history or longer previous anti-TB treatment) of patients with MDR-PTB presented herein.
Multivariable logistic regression analysis indicated that male sex, retreated history, longer previous anti-TB treatment, lower CD4+ T lymphocyte count, thick-walled cavities, centrilobular micronodules and TIB sign, bronchial stenosis, pleural and pericardial thickening were independent MDR-PTB predictors. This model obtained an AUC of 0.849 and accuracy of 78.6% for MDR-PTB prediction. Furthermore, an external validation cohort that contains 115 patients showed a good performance with an AUC of 0.933 and accuracy of 81.7%. Familiarity with these differential features may contribute to an early MDR-PTB diagnosis.
This study had several limitations. First, this study might have some selection bias because most of the patients were from a specialized hospital for TB. Therefore, further multicenter studies with larger sample sizes are needed to strengthen the reliability of the present findings. Second, the observation of CT signs is subjective, which might be insufficient for some subtle signs. Machine learning can be achieved to improve the diagnostic accuracy of MDR-PTB soon.
Collectively, our findings demonstrate that MDR-PTB and DS-PTB have different clinical and imaging characteristics. A combined model incorporating these differential features can help make an early MDR-PTB diagnosis and develop subsequent therapeutic strategies.
Abbreviations
AUC, area under the curve; CT, computed tomography; DS-PTB, drug-sensitive pulmonary tuberculosis; GGO, ground-glass opacity; ICC, intraclass correlation coefficient; MDR-PTB, multidrug-resistant pulmonary tuberculosis; PACS, picture archiving and communication system;
PTB, pulmonary tuberculosis; TIB, tree-in-bud; WHO, World Health Organization.
Data Sharing Statement
Data supporting the results reported in the manuscript can be found by contacting the correspondence author with email ([email protected]).
Ethics Approval and Informed Consent
The First Affiliated Hospital of Chongqing Medical University’s institutional review board approved this study, and the need for informed consent was waived due to its retrospective nature. Direct contact with the patient is not required, so it will not adversely affect the rights and health of the patient. This retrospective study complies with the Declaration of Helsinki, abides by the principle of confidentiality, will not release patient information.
Consent for Publication
The details of any images, recordings, and figures can be published, and the persons providing consent have been shown the article contents to be published.
Author Contributions
All authors made a significant contribution to the work reported, whether that is in the conception, study design, execution, acquisition of data, analysis and interpretation, or in all these areas; took part in drafting, revising or critically reviewing the article; gave final approval of the version to be published; have agreed on the journal to which the article has been submitted; and agree to be accountable for all aspects of the work.
Funding
This study was supported by Chongqing medical scientific research project (Joint project of Chongqing Health Commission and Science and Technology Bureau) (2022MSXM147, 2022MSXM142) and Chongqing Health Commission Foundation (2020jstg027) of China.
Disclosure
Chun-Hua Li and Xiao Fan shared the first authorship for this study. Yong-Mei Li and Qi Li are co-correspondence authors for this study. The authors report no conflicts of interest in this work.
References
1. World Health Organization (WHO), Global tuberculosis report 2022. Geneva, Switzerland; 2022. Available from: https://www.who.int/publications/i/item/9789240061729.
2. Karki M, Kantipudi K, Yang F, et al. Generalization challenges in drug-resistant tuberculosis detection from chest X-rays. Diagnostics. 2022;12:1889. doi:10.3390/diagnostics12010188
3. Li D, He W, Chen B, Lv P. Primary multidrug-resistant tuberculosis versus drug-sensitive tuberculosis in non-HIV infected patients: comparisons of CT findings. PLoS One. 2017;12:e0176354. doi:10.1371/journal.pone.0176354
4. Song Q, Guo X, Zhang L, Yang L, Lu X. New approaches in the classification and prognosis of sign clusters on pulmonary CT images in patients with multidrug-resistant tuberculosis. Front Microbiol. 2021;12:714617. doi:10.3389/fmicb.2021.714617
5. Fox L, Kramer MR, Haim I, Priess R, Metvachuk A, Shitrit D. Comparison of isoniazid monoresistant tuberculosis with drug-susceptible tuberculosis and multidrug-resistant tuberculosis. Eur J Clin Microbiol Infect Dis. 2011;30:863–867. doi:10.1007/s10096-011-1167-4
6. Parvaneh B, Payam T, Ehsan C, et al. Risk factors associated with multidrug-resistant tuberculosis. Tanaffos. 2009;8:17–21.
7. Mor Z, Goldblatt D, Kaidar-Shwartz H, Cedar N, Rorman E, Chemtob D. Drug-resistant tuberculosis in Israel: risk factors and treatment outcomes. Int J Tuberc Lung Dis. 2014;18:1195–1201. doi:10.5588/ijtld.14.0192
8. Du L, Zhang Y, Lv X, et al. Prevalence of multidrug-resistant tuberculosis in dalian, china: a retrospective study. Infect Drug Resist. 2021;14:1037–1047. doi:10.2147/IDR.S294611
9. Feng M, Xu Y, Zhang X, et al. Risk factors of multidrug-resistant tuberculosis in China: a meta-analysis. Public Health Nurs. 2019;36:257–269. doi:10.1111/phn.12582
10. Yang F, Yu H, Kantipudi K, et al. Differentiating between drug-sensitive and drug-resistant tuberculosis with machine learning for clinical and radiological features. Quant Imaging Med Surg. 2022;12:675–687. doi:10.21037/qims-21-290
11. Khawbung JL, Nath D, Chakraborty S. Drug resistant Tuberculosis: a review. Comp Immunol Microbiol Infect Dis. 2021;74:101574. doi:10.1016/j.cimid.2020.101574
12. Harding E. WHO global progress report on tuberculosis elimination. Lancet Respir Med. 2020;8:19. doi:10.1016/S2213-2600(19)30418-7
13. Agustin H, Massi MN, Djaharuddin I, et al. Analysis of CD4 and CD8 expression in multidrug-resistant tuberculosis infection with diabetes mellitus: an experimental study in mice. Ann Med Surg. 2021;68:102596. doi:10.1016/j.amsu.2021.102596
14. Prezzemolo T, Guggino G, La Manna MP, et al. Functional signatures of human CD4 and CD8 T Cell Responses to Mycobacterium tuberculosis. Front Immunol. 2014;5:180. doi:10.3389/fimmu.2014.00180
15. Yildiz P, Kadakal F, Tütüncü Y, et al. Natural killer cell activity in multidrug-resistant pulmonary tuberculosis. Respiration. 2001;68:590–594. doi:10.1159/000050577
16. Li N, Xie WP, Kong H, et al. Enrichment of regulatory T-cells in blood of patients with multidrug-resistant tuberculosis. Int J Tuberc Lung Dis. 2015;19:1230–1238. doi:10.5588/ijtld.15.0148
17. Geffner L, Yokobori N, Basile J, et al. Patients with multidrug-resistant tuberculosis display impaired Th1 responses and enhanced regulatory T-cell levels in response to an outbreak of multidrug-resistant Mycobacterium tuberculosis M and Ra strains. Infect Immun. 2009;77:5025–5034. doi:10.1128/IAI.00224-09
18. Sun ET, Xia D, Li BH, et al. Association of immune factors with drug-resistant tuberculosis: a case-control study. Med Sci Monit. 2017;23:5330–5336. doi:10.12659/msm.904309
19. Song T, Li LJ, Liu JL, Geng SJ. Study on the relationship between changes of immune cells and TNF-α in peripheral blood of patients with multidrug-resistant and extensively drug-resistant tuberculosis. Eur Rev Med Pharmacol Sci. 2018;22:1061–1065. doi:10.26355/eurrev_201802_14389
20. Zahran WA, Ghonaim MM, Koura BA, El-Banna H, Ali SM, El-Sheikh N. Human natural killer T cells (NKT), NK and T cells in pulmonary tuberculosis: potential indicators for disease activity and prognosis. Egypt J Immunol. 2006;13:67–78.
21. Bose M, Gupta A, Banavalikar JN, Saha K. Dysregulation of homeostasis of blood T-lymphocyte subpopulations persists in chronic multibacillary pulmonary tuberculosis patients refractory to treatment. Tuber Lung Dis. 1995;76:59–64. doi:10.1016/0962-8479(95)90581-2
22. Yeom JA, Jeong YJ, Jeon D, et al. Imaging findings of primary multidrug-resistant tuberculosis: a comparison with findings of drug-sensitive tuberculosis. J Comput Assist Tomogr. 2009;33:956–960. doi:10.1097/RCT.0b013e31819877ab
23. Wáng YXJ, Chung MJ, Skrahin A, Rosenthal A, Gabrielian A, Tartakovsky M. Radiological signs associated with pulmonary multi-drug resistant tuberculosis: an analysis of published evidences. Quant Imaging Med Surg. 2018;8:161–173. doi:10.21037/qims.2018.03.06
24. Mehrian P, Farnia P, Jalalvand D, et al. Computerised tomography scan in multi-drug-resistant versus extensively drug-resistant tuberculosis. Pol J Radiol. 2020;85:e39–e44. doi:10.5114/pjr.2020.93123
25. Shin HS, Choi DS, Na JB, et al. Low pectoralis muscle index, cavitary nodule or mass and segmental to lobar consolidation as predictors of primary multidrug-resistant tuberculosis: a comparison with primary drug sensitive tuberculosis. PLoS One. 2020;15:e0239431. doi:10.1371/journal.pone.0239431
26. Koo HK, Min J, Kim HW, et al. Prediction of treatment failure and compliance in patients with tuberculosis. BMC Infect Dis. 2020;20:622. doi:10.1186/s12879-020-05350-7
27. Hms EA, Urbanowski ME, Bishai WR, Diverse cavity types and evidence that mechanical action on the necrotic granuloma drives tuberculous cavitation, Am J Pathol. 188(2018)1666–1675.
28. Sakhelashvili M, Kostyk O, Sakhelashvili-Bil O, Piskur Z. Features of the resistant forms of a specific process among children and teenagers from the multidrug-resistant tuberculous infection foci: clinical picture and diagnostics. Georgian Med News. 2021;2021:70–76.
29. Zeng Y, Zhai XL, Wáng YX, et al. Illustration of a number of atypical computed tomography manifestations of active pulmonary tuberculosis. Quant Imaging Med Surg. 1651-1667;11(2021). doi:10.21037/qims-20-1323
30. Lee JY, Lee KS, Jung KJ, et al. Pulmonary tuberculosis: CT and pathologic correlation. J Comput Assist Tomogr. 2000;24:691–698. doi:10.1097/00004728-200009000-00005
31. Im JG, Itoh H, Lee KS, Han MC. CT-pathology correlation of pulmonary tuberculosis. Crit Rev Diagn Imaging. 1995;36:227–285.
32. Cheng N, Wu S, Luo X, et al. A comparative study of chest computed tomography findings: 1030 cases of drug-sensitive tuberculosis versus 516 cases of drug-resistant tuberculosis. Infect Drug Resist. 2021;14:1115–1128. doi:10.2147/IDR.S300754
33. Jeong YJ, Lee KS. Pulmonary tuberculosis: up-to-date imaging and management. AJR Am J Roentgenol. 2008;191:834–844. doi:10.2214/AJR.07.3896
34. Cha J, Lee HY, Lee KS, et al. Radiological findings of extensively drug-resistant pulmonary tuberculosis in non-AIDS adults: comparisons with findings of multidrug-resistant and drug-sensitive tuberculosis. Korean J Radiol. 2009;10:207–216. doi:10.3348/kjr.2009.10.3.207
 © 2023 The Author(s). This work is published and licensed by Dove Medical Press Limited. The
full terms of this license are available at https://www.dovepress.com/terms
and incorporate the Creative Commons Attribution
- Non Commercial (unported, 3.0) License.
By accessing the work you hereby accept the Terms. Non-commercial uses of the work are permitted
without any further permission from Dove Medical Press Limited, provided the work is properly
attributed. For permission for commercial use of this work, please see paragraphs 4.2 and 5 of our Terms.
© 2023 The Author(s). This work is published and licensed by Dove Medical Press Limited. The
full terms of this license are available at https://www.dovepress.com/terms
and incorporate the Creative Commons Attribution
- Non Commercial (unported, 3.0) License.
By accessing the work you hereby accept the Terms. Non-commercial uses of the work are permitted
without any further permission from Dove Medical Press Limited, provided the work is properly
attributed. For permission for commercial use of this work, please see paragraphs 4.2 and 5 of our Terms.
Recommended articles
Treatment Outcomes and Risk Factors of Multidrug-Resistant Tuberculosis Patients in Xi’an China, a Retrospective Cohort Study

Ma JB, Zeng LC, Ren F, Dang LY, Luo H, Wu YQ, Yang XJ, Li R, Yang H, Xu Y
Infection and Drug Resistance 2022, 15:4947-4957
Published Date: 29 August 2022
Comparison of Computed Tomography Findings of Tuberculosis and Non-Tuberculous Mycobacterial Lung Infections
Turkar A, Babalik A
Infection and Drug Resistance 2025, 18:5703-5710
Published Date: 3 November 2025
Assessing Invasiveness of Ground-Glass Nodules Using Ternary-Class CT Radiomics Models: A Multi-Center Study with SHAP Explanations
Zhao P, Chen H, Gu H, Lin Y, Ma Y
Cancer Management and Research 2026, 18:602730
Published Date: 5 June 2026