Back to Journals » Diabetes, Metabolic Syndrome and Obesity » Volume 17
Claudin-2 Mediates the Proximal Tubular Epithelial Cell–Fibroblast Crosstalk via Paracrine CTGF
Authors Guo C ![]() , Jiao M
, Jiao M ![]() , Cui Y, Li P, Yao J, Dong J, Liao L
, Cui Y, Li P, Yao J, Dong J, Liao L ![]()
Received 24 July 2023
Accepted for publication 14 December 2023
Published 3 January 2024 Volume 2024:17 Pages 55—73
DOI https://doi.org/10.2147/DMSO.S432173
Checked for plagiarism Yes
Review by Single anonymous peer review
Peer reviewer comments 4
Editor who approved publication: Prof. Dr. Juei-Tang Cheng
Congcong Guo,1– 4 Mingwen Jiao,5 Yuying Cui,1– 4 Pingjiang Li,6 Jinming Yao,1– 3 Jianjun Dong,7 Lin Liao1– 4
1Department of Endocrinology and Metabology, The First Affiliated Hospital of Shandong First Medical University & Shandong Provincial Qianfoshan Hospital, Jinan, Shandong, People’s Republic of China; 2Shandong Key Laboratory of Rheumatic Disease and Translational medicine, Shandong Institute of Nephrology, Jinan, Shandong, People’s Republic of China; 3Shandong Institute of Nephrology, the First Affiliated Hospital of Shandong First Medical University& Shandong Provincial Qianfoshan Hospital, Jinan, Shandong, People’s Republic of China; 4Shandong University of Traditional Chinese Medicine, Jinan, Shandong, People’s Republic of China; 5Department of General Surgery, The First Affiliated Hospital of Shandong First Medical University & Shandong Provincial Qianfoshan Hospital, Jinan, Shandong, People’s Republic of China; 6Shandong First Medical University and Shandong Academy of Medical Sciences, Jinan, Shandong, People’s Republic of China; 7Department of Endocrinology, Qilu Hospital, Cheeloo College of Medicine, Shandong University, Jinan, Shandong, People’s Republic of China
Correspondence: Lin Liao, Department of Endocrinology and Metabology, The First Affiliated Hospital of Shandong First Medical University and Shandong Provincial Qianfoshan Hospital, Jinan, Shandong, People’s Republic of China, Tel +86 15168888260, Email [email protected] Jianjun Dong, Department of Endocrinology, Qilu Hospital, Cheeloo College of Medicine, Shandong University, Jinan, Shandong, People’s Republic of China, Tel +86 13791122910, Email [email protected]
Purpose: Proximal tubular epithelial cell (PTEC) is vulnerable to injury in diabetic kidney disease (DKD) due to high energy expenditure. The injured PTECs-derived profibrotic factors are thought to be driving forces in tubulointerstitial fibrosis (TIF) as they activate surrounding fibroblasts. However, the mechanisms remain unclear.
Methods: The diabetes with uninephrectomy (DKD) rats were used to evaluated renal histological changes and the expression of Claudin-2 by immunofluorescence staining. Then, Claudin-2 expression in PTECs were modulated and subsequently determined the proliferation and activation of fibroblasts by building a transwell co-culture system in normal glucose (NG)or high glucose (HG) condition.
Results: Decreased expression of Claudin-2 in PTECs accompanied by tight junction disruption and increased interstitial fibrosis, were detected in DKD rats. In vitro, downregulated Claudin-2 in PTECs promoted proliferation and activation of fibroblasts, which coincided with elevated expression of profibrotic connective tissue growth factor (CTGF) in PTECs. Silenced CTGF inhibited the profibrotic of PTECs via Claudin-2 inhibition. Fibroblasts co-cultured with PTECs transitioned more to myofibroblasts and generated extracellular matrix (ECM) significantly in response to high glucose (HG) stimulation whereas overexpression of Claudin-2 in PTECs reversed the above results. Upregulating CTGF disrupted the beneficial anti-fibrosis effects obtained by overexpression of Claudin-2 in HG condition.
Conclusion: Our study suggested that Claudin-2 in PTECs, a key mediator of paracellular cation and water transport, promotes the activation and proliferation of surrounding fibroblasts significantly via CTGF in a paracrine manner.
Keywords: proximal tubular epithelial cell, fibroblast, crosstalk, diabetic kidney disease, Claudin-2
Graphical Abstract:

Introduction
Diabetic kidney disease (DKD) is the leading cause of end-stage renal disease (ESRD) in developed and developing countries.1 In the past 30 years, the prevalence of other diabetes mellitus (DM)-related complications have been significantly reduced, but the ESRD caused by DKD has not been significantly improved.2 DKD has been thought as glomerulopathy previously. In recent years, tubulointerstitial fibrosis (TIF) has been found strongly associated with proteinuria and renal dysfunction.3 The renal interstitium consists of multiple cell types, including proximal tubule epithelial cell (PTECs), fibroblasts, endothelial cells, inflammatory cells and pericytes, all of which contribute to fibrosis progression. For a long time, much emphasis has understandably been placed on fibroblast, as its activation is responsible for the excessive production of extracellular matrix (ECM).4 However, in recent years, a growing number of studies have shed light on the role of PTECs in renal fibrosis. PTEC is a high energy consumption cell that makes it not only the primary target of injury but also the essential driver of TIF progression.5 After severe or recurrent injury, PTECs switch to a secretory phenotype to release paracrine growth factors, including transforming growth factor β (TGF-β), Wnt ligand and connective tissue growth factor (CTGF), which contribute to the initiation of the fibrotic response by favoring activation of fibroblasts.6 Among the factors, CTGF expressed at low levels in normal adult kidneys and markedly upregulated in PTECs of DKD.7 It modulates cell proliferation, migration and differentiation, and has an important role in the development of TIF in progressive DKD.8 However, the mechanism by which CTGF participates in the regulation of PTECs-fibroblasts crosstalk is not fully understood in DKD.
Tight junctions are the most apical junction between adjacent cells, regulating the passive movement of paracellular water and solutes.9 Altered the structure and function of tight junctions are recognized as a critical step in the generation of renal fibrosis.10 The tight junction is composed of a large complex of proteins in the membrane, including Claudins, occludin, and zonula occludens (ZO)-1, −2 and −3. Claudins polymerize linearly to form junctional strands between cells, thereby conferring paracellular barrier or channel functions to the cell. There are 27 mammalian Claudin genes. Most claudins are expressed in the renal tubule. Claudin-2 is exclusively expressed in the PTECs.11 Claudin-2 contains four transmembrane domains, one intracellular loop and two extracellular segments.12 In the proximal tubule (PT), Claudin-2 forms paracellular channels selective for small cations such as Na+, K+, and Ca2+ and is also permeable to H2O.13 The paracellular sodium transport mediated by Claudin-2 is necessary for maintaining the function of the PT and contributes to energy efficiency in the kidney.14 Evidence supports that Claudin-2 also acts as a signal transduction platform to regulate cell proliferation, migration and survival.15 Reduced Claudin-2 expression was recorded in cisplatin-induced nephrotoxicity.16 Work by Dan, Q. et al17 reported that Claudin-2 loss in PTECs induced by tumor necrosis factor-α (TNF-α) elevated the expression of CTGF in PTECs. It is unknown whether renal tubular Claudin-2 mediates epithelial-fibroblast crosstalk in DKD by inducing CTGF.
This study observed tight junction disruption and down-regulation of Claudin-2 protein in PTECs during progressive TIF in the DKD rat model. Furthermore, by constructing the in vitro co-culture system, we revealed that renal tubular Claudin-2 is required for mediating the interplay between PTECs and surrounding fibroblasts by inducing CTGF secretion. These findings suggest that down-regulated Claudin-2 in PTECs under high glucose (HG) may exert a paracrine influence on neighboring fibroblasts by up-regulating CTGF. This association may hold potential as a therapeutic target in managing TIF in DKD.
Materials and Methods
Animal Models
Male Wistar rats of 8 weeks were purchased from Beijing Vital River Laboratory Technology and housed in a room with constant temperature and a 12:12-hour light-dark cycle. All rats were allowed to acclimatize for 1 week before the experiment began. Sham control rats underwent a sham operation consisting of an incision in the skin and muscle in the right renal region and manipulation of the renal pedicles, without damage to the kidney. To accelerate the DKD development, the other rats were subjected to right uninephrectomy at 9 weeks of age. Diabetes was induced one week after surgery by a single intraperitoneal injection of streptozocin (STZ; Sigma-Aldrich, St. Louis, MO, United States), diluted in a citrate buffer (0.1 mol/L, pH 4.0) at a 45 mg/kg dose. The rats developed hyperglycemia with blood glucose levels over 16.7 mmol/L at 72 hours after STZ injection. Then, all animals were randomized into three groups: (1) Sham (n=6), (2) Uninephrectomy (Unx; n=8), and (3) Diabetes with uninephrectomy (DKD, n =8). Two DKD and two Unx rats died in the process. After five months of feeding, the kidney from each animal was fixed with formalin for histology. The study was conducted following the Guiding Principles for the Care and Use of Laboratory Animals in China.
Specimen Collection and Histological Observation
The remaining rats were weighed and kept individually in metabolic cages to collect 24-h urine 2 days before execution. The total volume of collected urine was measured. Centrifuge the sample at 1000g for 5 minutes to remove any residue. And the urine samples were stored at –80°C after centrifugation. Urine protein was assessed by the Bradford method. In order to evaluate the histological injury, 4% paraformaldehyde-fixed and paraffin-embedded kidney blocks were cut into 3-μm sections. Then Tissue sections were stained with periodic acid-Schiff (PAS) and Masson’s trichrome. The sections were examined with light microscopy by two experienced pathologists. The histological alterations were calculated as tubular injury scores. The scoring system was on a scale from 0 to 5 grades (0 = 0%, 1 = 5%, 2 = 5–10%, 3 = 10–20%, 4 = 20–30%, 5≤30%) according to the following criteria: tubular dilation, tubular atrophy, vacuoles formation, and extracellular matrix accumulation (interstitial volume).18 Six randomly selected non-overlapping cortical fields were obtained per kidney section, with six rats in each group.
Electron Microscopy
Cortical kidney tissue was cut into 1mm3 cubes for standard Electron Microscopy processing. Photographs were taken with the transmission electron microscope (JEM-1200EX, Japan). Five random photographs with a final magnification of 8000× were taken from each section.
Immunofluorescence Staining
Kidney slides were incubated overnight at 4°C with primary antibodies anti-DppD (1:100, ab187048, Abcam, UK), anti-Claudin-2 (1:100, Product#51-6100, Invitrogen, USA), and anti-α-SMA (1:200, BM0002, BOSTER, China). Dipeptidyl peptidase (DppD) was used as a marker of PTs. Negative controls were incubated with phosphate-buffered saline (PBS). At room temperature, NRK49F cells cultured on coverslips were fixed with 4% paraformaldehyde for 5 minutes, permeabilized with 0.1% TritonTMX-100 for 10 minutes, and blocked with 2% BSA for 45 minutes. The cells were labeled with antibodies against PCNA (1:200, 10205-1-AP; Proteintech, Wuhan, China), α-SMA (1:200, BM0002, BOSTER, China), and anti-Claudin-2 (1:100, Product#51-6100, Invitrogen, USA). Secondary antibodies Alexa Fluor® 488 donkey anti-rabbit (Product#A32790, Invitrogen, USA), Alexa Fluor® 488 donkey anti-mouse (Product#A-11029, Invitrogen, USA) were used at a 1:300 dilution in vivo and 1:800 dilution in vitro, respectively. Nuclei were stained with 4’,6-diamidino-2-phenylindole (DAPI)(Sigma-Aldrich) according to the manufacturer’s instructions. Images were captured by fluorescence microscopy (Ni-V, Nikon, Japan), and photographs were recorded.
Cell Culture and Treatment
The normal rat kidney fibroblast cell (NRK49F) and rat renal tubule epithelial cells (NRK52E) were obtained from ProCell Corporation (Wuhan, China) and cultured in RPMI-1640 medium (Corning, NY, USA). Then they were supplemented with 10% fetal bovine serum (FBS) (Lonicera, Uruguay), 100 units/mL penicillin and 100 mg/mL streptomycin (#15140-122, Gibco, USA) until the cells became confluent. All cells were grown at 37°C in 5% CO2 and passaged every other day. Then, NRK52E cells were incubated in media containing 5.5 mM D-glucose (NG), 5.5 mM D-glucose + 24.5 mM D-mannitol (MG) or 30 mM D-glucose (HG), respectively. And NRK52E cells and NRK49F cells were co-cultured with NG medium or HG medium for 48 hours to perform cell function experiments. The osmolarity of medium was measured by Osmostat OM-6020 (Kyoto Daiichi Kagaku, Kyoto, Japan).
Transwell Co-Culture System Construction
Transwell cell-culture inserts (Catalogue:3414, pore size: 0.3μm; Corning Costar Corp., NY, USA) were placed in RPMI-1640 medium with 10% FBS and 1% antibiotics in the upper and lower compartments. NRK49F cells were resuspended at 5×10⁴/well in the lower chamber containing the NG medium or HG medium, respectively. The upper chambers containing NG medium or HG medium were seeded with 5×10⁴/mL control NRK52E cells or NRK52E cells transfected with plasmid as described in the “Cell transfection and Grouping” section below. All co-cultures were set up in triplicate.
Cell Transfection and Grouping
Small interfering RNAs (siRNAs) targeting Claudin-2 or CTGF were synthesized by RIBOBIO (Shanghai, China). The sequence of si-Cldn2 was 5′-CCAGTGTGATATCTACAGT-3′. The sequence of si-Ctgf was 5′- GGAAGAUGUACGGAGACAUTT −3′. NRK52E cells were seeded in a 6-well plate (4×10⁵ cells/well). Cldn2 and Ctgf cDNAs were subcloned with Pyrobest DNA polymerase and inserted into the pcDNA3.1 vector (Tsingke, Beijing, China). These vectors were transfected into NRK52E cells using Lipofectamine 3000. NRK52E cells transfected with empty pcDNA3.1 vector using Lipofectamine 3000 were used as the negative control. When cell density reached 70% confluence, 4μL Lipofectamine 3000 reagent (L3000-008, Invitrogen, USA) and 8ul vectors were mixed with Opti-MEM medium (31,985–070, Invitrogen, USA). The mixed solution was incubated at room temperature for 20 minutes before being gently and slowly added to each well and incubated for 8 hours. After 8 hours of incubation, the transfection mixture was replaced with 2mL of complete medium. After 48 hours, the interference efficiency was verified by Western blot. Each transfection was repeated in triplicate. After successful transfection, the cells were seeded in the transwell system’s upper chamber and co-cultured with NRK49F cells in NG or HG condition.
Grouping of cells cultured in NG: mono-culture of NRK52E cells or NRK49F cells in NG, co-culture of NRK49F cells with control NRK52E cells in NG, co-culture of NRK49F cells with NRK52E cells transfected with si-Cldn2 in NG, co-culture of NRK49F cells with NRK52E cells transfected with the negative control plasmid (si-NC) in NG, co-culture of NRK49F cells with NRK52E cells transfected with si-Cldn2 and negative control plasmid (si-NC) in NG, and co-culture of NRK49F cells with NRK52E cells transfected with si-Cldn2 and si-Ctgf in NG.
Grouping of cells cultured in HG: mono-culture of NRK52E cells or NRK49F cells in HG, co-culture of NRK49F cells with control NRK52E cells in HG, co-culture of NRK49F cells with NRK52E cells transfected with pcDNA3.1-Cldn2 in HG, co-culture of NRK49F cells with NRK52E cells transfected with the negative control plasmid (pcDNA3.1-NC) in HG, co-culture of NRK49F cells with NRK52E cells transfected with pcDNA3.1-Cldn2 in HG, co-culture of NRK49F cells with NRK52E cells transfected with pcDNA3.1-Cldn2 and negative control plasmid (pcDNA3.1-NC) in HG, and co-culture of NRK49F cells with NRK52E cells transfected with pcDNA3.1-Cldn2 and pcDNA3.1-Ctgf in HG.
Western Blot Analysis
Proteins were isolated from various cultured NRK52E cells and NRK49F cells. As previously described, the protein levels were determined using Western blot analysis.19 The primary antibodies used were as follows: anti-Claudin-2 (1:500, A14085, ABclonal, China), anti-PCNA (1:500, 10205-1-AP; Proteintech, China), anti-α-SMA (1:100, 14395-1-AP, Proteintech, China), anti-Collage I (1:500, 14695-1-AP,Proteintech, China), CTGF (1:500, A11067,ABclonal, China),anti-GAPDH (1:5000, 10494-1-AP, Proteintech, China), anti-β-actin (1:5000, 20536-1-AP; Proteintech, China). Finally, the ECL luminescence kit (E412-02, Vazyme, China) was used for luminescence. Moreover, quantification was performed by measuring the signal intensity using the Image J software (National Institutes of Health, Bethesda, MD, United States).
5-Ethynyl-2’-Deoxyuridine (EdU) Assay
Cell proliferation was examined by 5-ethynyl-2′-deoxyuridine (EdU) incorporation using a Click-iT Edu Imaging Kit (C0075LC10337, Beyotime, China). Images were taken at ten randomized fields under fluorescence microscopy (Ni-V, Nikon, Japan). The quantification was assessed by the proportion of cells with EdU-positive staining.
Enzyme‑linked Immunosorbent Assay (ELISA)
The supernatant collected from each group was stored at −80°C before use. The CTGF concentrations in the supernatants were determined by ELISA kit (Rat CTGF ELISA Kit, E-EL-R0259c, Elabscience, Wuhan, China) according to the manufacturer’s instructions. The standard curve range of the assay for CTGF was 31.25—2000 pg/mL. The inter-assay and intra-assay coefficients of variations were 4.01% and 7.76%, respectively. The above ranges for CTGF concur with provided by the manufacturer.
Statistical Analysis
Results are expressed as mean ± SEM. All statistical analyses were performed using SPSS Statistics 22.0 (SPSS Inc, Chicago, USA). Student’s t-test was used to assess significance for data between two groups. One-way ANOVA test with subsequent post hoc Tukey’s test were used for multiple comparisons. The significance level was set at P < 0.05.
Results
Diabetes Causes Tight Junction Disruption Accompanied by Increased Interstitial Fibrosis
To investigate the renal damage caused by diabetes, the DKD rat model was induced by STZ and uninephrectomy (Figure 1A). As shown in Figure 1C, DKD rats exhibited a substantial increase in 24-h proteinuria at the end of week 20. Morphological images of histopathological slides for the different groups are presented in Figure 1B. The renal pathological evaluation was performed by PAS staining and calculated quantitatively as a tubular injury score. As expected, there was no significant difference in tubular injury scores between the Sham and Unx groups. In contrast, the tubulointerstitial damage, such as the tubular dilation, tubular cell atrophy, protein casts and vacuolar formation were significantly in the DKD group accompanied by increased tubular injury scores compared that of Unx group (Figure 1B, a1–a3 and D, all P<0.01). Masson’s trichrome was conducted to detect ECM accumulation (Figure 1B, b1–b3), and semi-quantification of Masson Trichrome indicated that DKD rats produced about 4-fold increase in the area of ECM in the renal cortex than that of Unx rats (Figure 1E, P<0.01). Moreover, compared with the Unx control, semi-quantification of immunofluorescence staining for α-smooth muscle actin (α-SMA) protein (Figure 1B, c1–c3 and F) demonstrated a dramatic increased myofibroblasts accumulation in the interstitial areas in DKD rats (P<0.01). The results provided evidence that DKD rats increased the severity of fibrosis.
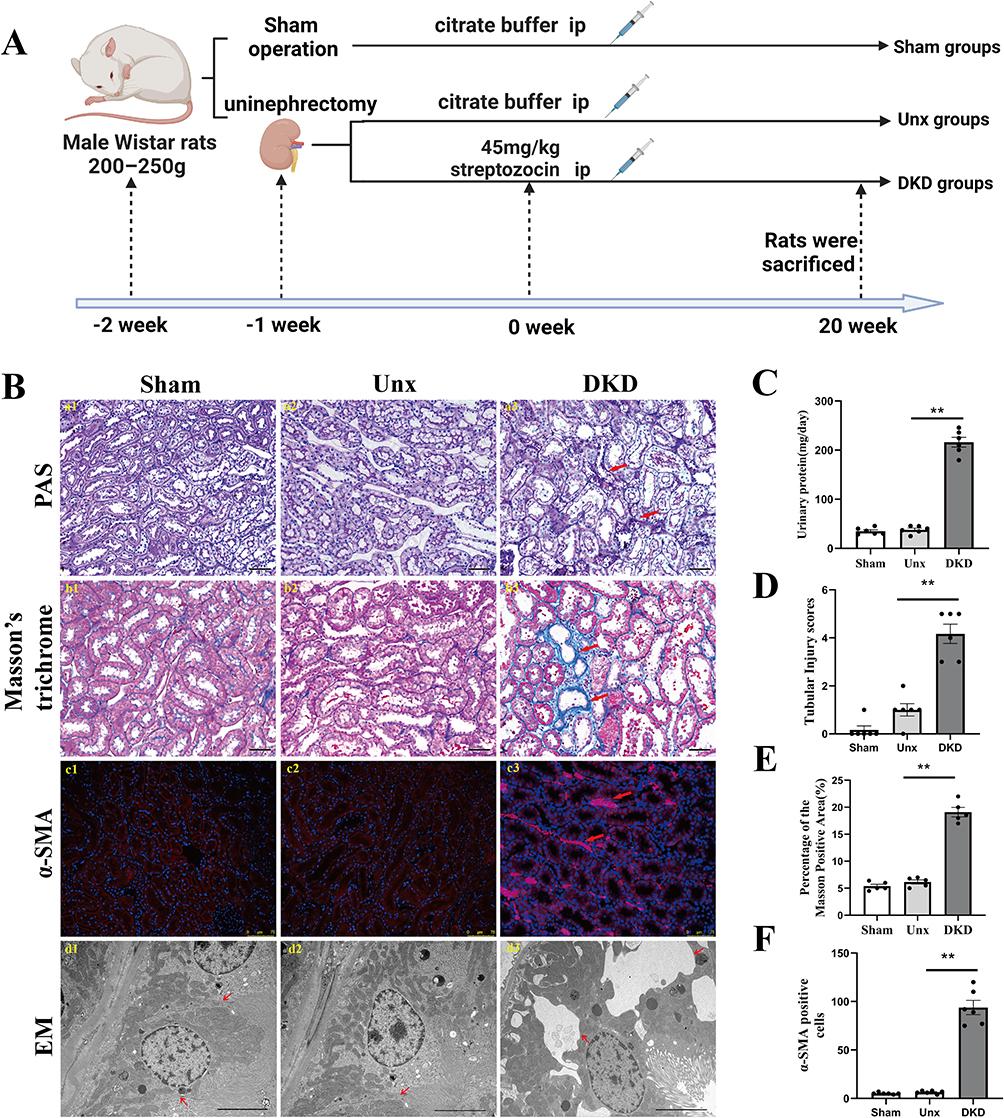 |
Figure 1 Diabetes-induced tubule-interstitial damage is associated with loss of renal tight junction. (A) Schematic diagram of the DKD rat modeling process. (B) (a1-a3, b1-b3) Representative micrographs of PAS-stained tubules and Masson’s trichrome-stained sections. Magnification: ×200, scale bar = 50µm. Red arrows indicate the injured tubules and extracellular matrix accumulation, respectively. (c1-c3) Representative images of α-SMA-positive immunostaining of the STZ-induced renal cortex. Kidney sections were stained with antibodies specific for α-SMA (red). Nuclei were visualized using DAPI. Magnification: ×200, scale bar =75µm. Red arrows indicate the activated fibroblasts. (d1-d3) Morphology change in the PTECs (transmission electron microscopy, ×8000). The absence of tight junctions between adjacent of PTECs were observed in the DKD group compared to the Sham and Unx groups. Red arrows indicate the tight junctions between adjacent of PTECs. (C) Urinary protein. DKD group showed increased urinary protein. (D) The tubular injury score was evaluated by blinded scoring of the injury tubule in the PAS-stained section at 20×power-field. (E) Quantitative analysis of tubular interstitial fibrosis from Masson’s trichrome staining. (F) Increase in α-SMA myofibroblasts in DKD group. Data are expressed as mean ± SEM. n = 6, **P<0.01, vs Unx. Abbreviations: DKD, diabetic kidney disease; STZ, streptozocin; Unx, uninephrectomy; PTECs, proximal tubular epithelial cells; NG, normal glucose; HG, high glucose; PAS, periodic acid-Schiff; α-SMA, α-smooth muscle actin; DAPI, 4’,6-diamidino-2-phenylindole. |
Tight junction proteins are located at the apical side of the junctional complexes that connect epithelial cells. Their primary role is to generate cell polarity (referred to as fence function), control paracellular transport (gate function), and provide signaling input for a wide variety of cellular events.20,21 Our results showed significant disruption of tight junction between adjacent PTECs by electron microscopy in DKD rats, while there was no significant change in that of the Sham group and Unx group (Figure 1B, d1-d3). Based on clinical evidence, Lee, Huang. et al22 proposed a link between the disruption of the tubular epithelial barrier and kidney diseases. The impairment of the tight junction structure results in the passage of tubular fluid to the interstitial region and loss of cell polarity, directly affecting the epithelial tubular transports, cell growth, proliferation, differentiation, and dedifferentiation. These results suggested that diabetes causes disassembly of the tight junction and this is accompanied by increased interstitial fibrosis.
The Expression of Claudin-2 Was Decreased in Response to High Glucose in PTECs
The tight junction is comprised of a multitude of transmembrane and intracellular proteins. Claudin-2 is a tight junction protein that forms cation-selective and water-permeable paracellular channels. As shown in Figure 2A, DppD, a proximal tubule marker, did not change significantly in each group of rats. Claudin-2 was mainly expressed in proximal tubules, as a chicken fence pattern in cell borders of PTs in the Sham group and Unx group by confocal microscopy. In contrast, the localization of Claudin-2 in the cell borders was discontinuous and almost disappeared in the DKD group, indicating that the decremented expressions of Claudin-2 induced by diabetes were selective. This is a significant result because Claudin-2 is required for tubular sodium reabsorption and maintaining cell-to-cell contacts. These finding suggested that decreased expression of Claudin-2 caused by diabetes might be linked to tubular dysfunction and interstitial fibrosis.
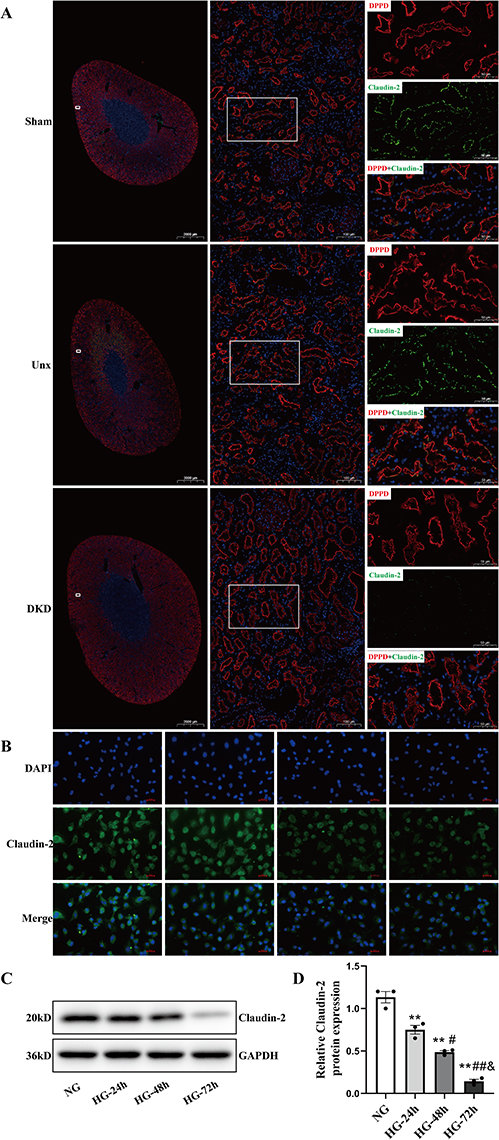 |
Figure 2 Effect of high glucose on Claudin-2 in PTECs by IF staining and Western blot in vivo and in vitro. (A) Diabetes decreased the expression of Claudin-2 in PTs. Five months after STZ injection, the expression (assessed by confocal microscopy) of Claudin-2 was studied. Diabetes significantly decreased Claudin-2 (green) expression in the apical membrane of PTECs, as shown by immunofluorescence. DppD (red) was used as a marker of PTs. Magnification: × 5, scale bar =2000µm. Magnification: ×100, scale bar =100µm. Magnification: ×200, scale bar =50µm. (B) NRK52E cells were cultured in 30mM D-glucose (HG) medium for 24 hours, 48 hours, and 72 hours, respectively. The effect of HG in the protein expression of Claudin-2 was stained and observed under a fluorescence microscope at a magnification of ×400, scale bar =100µm. (C and D) Western blot and quantitative analysis showed that the expression of Claudin-2 protein increased in a time-dependent manner when PTECs were exposed to HG. Values represent mean ± SEM, n = 3, **P < 0.01, vs NG; #P < 0.05, ##P < 0.01 vs HG (24h); &P<0.05 vs HG (48h). Abbreviations: DKD, diabetic kidney disease; Unx, uninephrectomy; STZ, streptozocin; PT, proximal tubule; PTECs, proximal tubular epithelial cells; NG, normal glucose; HG, high glucose; DppD, Dipeptidyl peptidase. DAPI, 4’,6-diamidino-2-phenylindole. |
In order to further explore the factors that could reduce the expression level of Claudin-2 in PTECs. The NRK52E cells were cultured in 5.5mM D-glucose (NG) medium, 5.5 mM D-glucose + 24.5 mM D-mannitol (MG) medium, or 30mM D-glucose (HG) medium for 48h, respectively. An obvious decrease in the expression of Claudin-2 was detected in HG group when compared to NG group or MG group by Western blot (both P < 0.01, Figure S1A and B). Then, the NRK52E cells were treated in HG for 24 hours, 48 hours, and 72 hours, respectively. The immunofluorescence microscopic analysis revealed a significantly reduced Claudin-2 expression in HG (Figure 2B). Western blot determined that HG induced a significant decrease expression of Claudin-2 in a time-dependent manner (Figure 2C and Figure S2A and B). Compared to NG control, the expression of Claudin-2 decreased approximately 2-fold in 24 hours and approximately 6-fold in 72 hours in HG condition (Figure 2D, P<0.05, P<0.01). These results confirmed our hypothesis that HG decreases the expression of Claudin-2 in a time-dependent manner.
Cldn2 Depletion in PTECs Enhances the Activation and Proliferation of Fibroblast
While PTECs are often regarded as the initial drivers of renal injury, fibroblasts are considered the primary matrix-producing cells.23 In response to sustained tubular injury, fibroblasts were recruited and activated. Structurally, fibroblasts are located in the renal interstitium around the tubules formed by epithelial cells. This proximity promotes epithelial–fibroblast interactions, which are critical for maintaining the integrity of kidney structure and function.24 To investigate the role of Claudin-2 in crosstalk between PTECs and fibroblasts, a co-culture model was constructed. First, the silenced Cldn2 in NRK52E cells was confirmed by Western blot analysis (Supplementary Figure S3A and B). NRK52E cells or NRK52E cells transfected with small interfering RNA were co-cultured with NRK49F cells in normal glucose (NG, 5.5 mM D-glucose) for 48 hours. Dual staining of NRK49F cells for proliferating cell nuclear antigen (PCNA) and α-SMA revealed no significant difference in the numbers of proliferating fibroblasts (PCNA+/α-SMA+ cells) between NRK49F cells mono-culture and co-culture with NRK52E cells (Figure 3A and B). When co-cultured with NRK52E cells in NG, the number of PCNA+/α-SMA+ cells increased, and a marked accumulation of PCNA in the nuclei of NRK49F cells in NRK52E-si-Cldn2 group was observed compared with the NRK52E-si-NC group (both P<0.01). Similarly, Cldn2 silencing in NRK52E cells significantly promoted NRK49F cells proliferation (∼1.5-fold) by EdU staining compared with that of NRK52E-si-NC group (Figure 3C and D, P<0.01). The results highlighted an increased transition of fibroblasts to myofibroblasts, accompanied by a higher proliferative capacity of activated fibroblasts. In order to further evaluate the profibrotic ability of activated fibroblasts, we analyzed α-SMA and Type I Collagen I (collage I) expression in NRK49F cells when co-cultured tubular Claudin-2 by Western blot. Of note, increased α-SMA and Collage I expression of NRK49F cells in the NRK52E-si-Cldn2 group were observed compared with the NRK52E-si-NC group (Figure 3E and F, P<0.01). These results suggested that renal tubular Claudin-2 loss can promote ECM secretion by myofibroblasts.
 |
Figure 3 Knockdown of Cldn2 in PTECs enhances fibroblast activation and proliferation. (A) Representative immunostaining images showing the nuclear localization of proliferating cell nuclear antigen (PCNA) in activated fibroblasts. Cells were immune-stained for α-SMA (red) and PCNA (green) and counterstained with DAPI (blue). White arrows indicate positive staining. Magnification ×400, scale bar =100µm. (B) Quantitative analysis of PCNA+/α-SMA+ cells showed knockdown of Cldn2 in PTECs markedly ameliorated the activation and proliferation in fibroblasts by co-culturing with PTECs in NG for 48 hours. (C and D) Representative images and quantitative analysis show knockdown of Cldn2 in PTECs promotes fibroblast proliferation, as demonstrated by EdU incorporation. (E and F) Western blot revealed the expression levels of α-SMA and collagen I in NRK49F cells in 5.5mM D-glucose (NG) medium± co-culture with NRK52E cells ±si-Cldn2 for 48 hours. Representative blots and quantitative analysis of α-SMA and collagen I are shown above. Data are the mean ± SEM (n=3). **P<0.01, vs NRK52E-siNC+NRK49F+NG. Abbreviations: PTECs, proximal tubular epithelial cells; PCNA, proliferating cell nuclear antigen; α-SMA, α-smooth muscle actin; Collagen I, Type I Collagen; NG, normal glucose. DAPI, 4’,6-diamidino-2-phenylindole. |
Overexpression of Cldn2 Reverses the High Glucose-Induced Activation and Proliferation of Fibroblast
To examine whether sustained Claudin-2 expression could reverse HG-induced the activation and proliferation of fibroblast, NRK49F cells were co-cultured with NRK52E cells or mono-cultured in HG (30mM D-glucose) for 48 hours. The number of proliferating fibroblasts (PCNA+/α-SMA+ cells) and a marked accumulation of PCNA in the nuclei remarkably increased in mono-culture HG group compared with that of mono-culture NG control (P<0.01, Figure 4A and B). When co-cultured with NRK52E cells in HG, the number of PCNA+/α-SMA+-positive cells further increased compared to that of mono-cultured NRK49F cells in HG (P<0.01). While a decrease of PCNA+/α-SMA+-positive NRK49F cells was observed in the NRK52E-pcDNA3.1-Cldn2 group compared with that of NRK52E-pcDNA3.1-NC group (P<0.01). EdU staining exhibited the similar results (Figure 4C and D, P<0.01). In contrast to NG, HG treatment for 48 hours dramatically upregulated the levels of α-SMA and Collagen I in NRK49F cells by Western blot analysis (P<0.01, Figure 4E and F). The expression levels of α-SMA and Collagen I increased significantly in NRK49F cells co-cultured with NRK52E cells compared with that of mono-cultured (both P<0.01), while Cldn2-overexpressed NRK52E significantly blocked this effect (both P<0.01). According to the findings, injured PTECs by HG further exacerbated HG-induced activation and proliferation of fibroblasts, and overexpression of Cldn2 in PTECs can relieve the above changes.
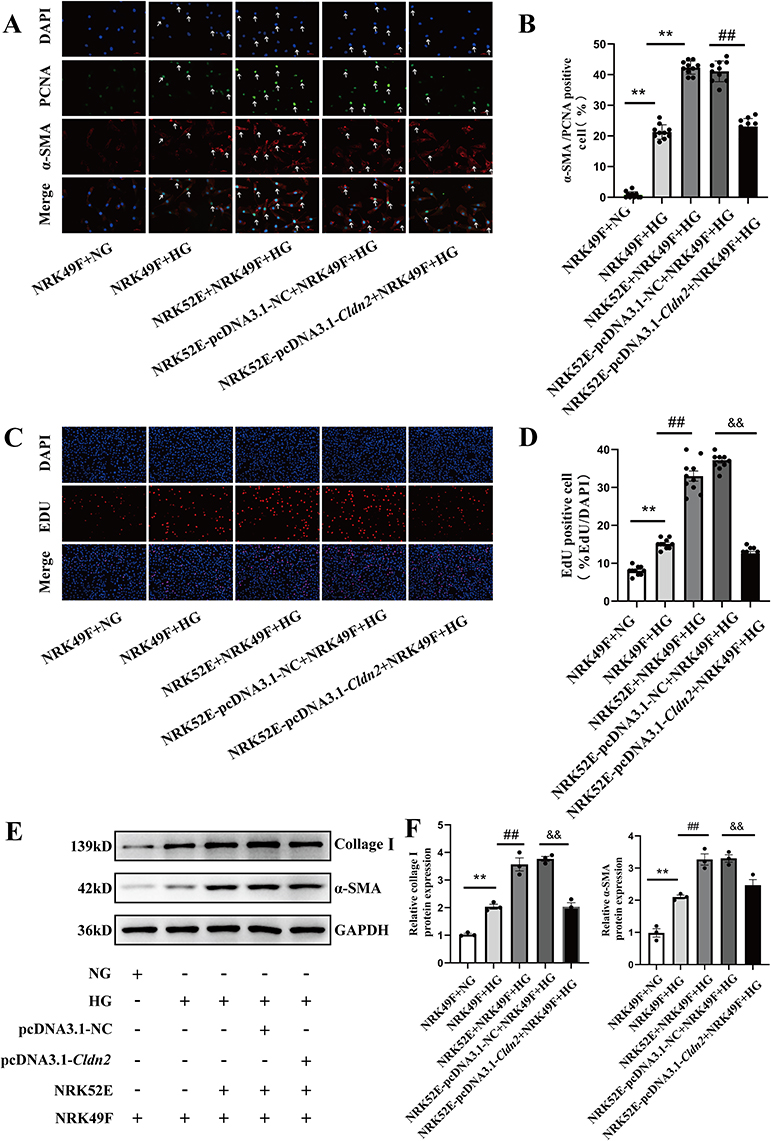 |
Figure 4 Overexpression of Cldn2 reverses high glucose-induced fibroblast activation and proliferation. (A and B) Immunocytochemistry revealed the nuclear localization of proliferating cell nuclear antigen (PCNA) in activated-fibroblasts (NRK49Fcells) in 5.5mM D-glucose (NG) medium or 30mM D-glucose (HG) medium ± co-culture with NRK52E ± pcDNA3.1-Cldn2. Cells were immune-stained for α-SMA (red) and PCNA (green) and counterstained with DAPI (blue). White Arrows indicate positive staining. Magnification ×400, scale bar =100µm. (C and D) Representative images and quantitative analysis show HG stimulated fibroblast proliferation, and co-culture with PTECs exacerbated this process. And overexpressed Cldn2 in PTECs inhibited HG-induced fibroblast proliferation. (E and F) Western blot revealed the expression levels of α-SMA and collagen I in NRK49F cells in 5.5mM D-glucose (NG) medium or 30mM D-glucose (HG) medium ± co-culture with NRK52E cells ± pcDNA3.1-Cldn2 for 48 hours. Representative blots and quantitative analysis of α-SMA and collagen I are shown above. Data are expressed as mean data ± SEM (n = 3), **P<0.01, vs NRK49F+NG; ##P<0.01, vs NRK49F+HG; &&P<0.01, vs NRK52E-pcDNA3.1-NC+NRK49F+HG. Abbreviations: PTECs, proximal tubular epithelial cells; PCNA, proliferating cell nuclear antigen; α-SMA, α-smooth muscle actin; Collagen I, Type I Collagen; NG, normal glucose. HG, high glucose. DAPI, 4’,6-diamidino-2-phenylindole. |
Claudin-2 Regulates CTGF in PTECs
CTGF is an important secreted protein produced by various renal resident cells involved in DKD fibrosis. Our Western blot analysis revealed that HG caused a significant increase expression of CTGF in a time-dependent manner (Figure 5A and B). Subsequently, the cell supernatants were collected from Cldn2-overexpressed/knockdown NRK52E cells and CTGF protein expression was detected by ELISA. The results showed that silenced Cldn2 promoted CTGF secretion in NRK52E cells cultured in NG (Figure 5C, P<0.01), while overexpression of Cldn2 could reduce CTGF secretion in NRK52E cells cultured in HG (Figure 5C, P<0.01).
 |
Figure 5 Claudin-2 regulates CTGF in PTECs. (A and B) Western blot and quantitative analysis showed that the CTGF protein expression increased time-dependent when NRK52E cells were exposed to HG for 24 hours, 48 hours, and 72 hours, respectively. Values represent mean ± SEM, n = 3, *P < 0.05, **P < 0.01, vs NG; #P < 0.05, ##P < 0.01 vs HG (24 h), &P<0.05 vs HG (48 h). (C) Concentrations of CTGF in the culture supernatants of PTECs after interference. Experiments were performed in triplicate. **P<0.01, vs NRK52E-si-NC +NG; ##P<0.01, vs NRK52E-pcDNA3.1-NC+HG. (D–F) NRK52E cells were transduced with control (si-NC) or si-Cldn2 followed by co-culture with NRK49F cells in 5.5mM D-glucose (NG) medium for 48 hours. Western blot revealed the CTGF and Claudin-2 expression levels in NRK52E cells in 5.5mM D-glucose (NG) medium ± co-culture with NRK49F cells ± si-Cldn2. Cldn2 siRNA knockdown efficiency was confirmed by Western blot analyses. Representative blots and quantitative analysis of Claudin-2 and CTGF are shown above. Data are expressed as the mean ± S.E.M. **P<0.01, vs NRK52E-si-NC+NRK49F+NG. (G and H and I) Western blot revealed the CTGF and Claudin-2 expression levels in NRK52E cells in 5.5mM D-glucose (NG) medium or 30mM D-glucose (HG) medium ±co-culture with NRK49F cells ± pcDNA3.1-Cldn2 for 48 hours. The overexpression efficiency of pcDNA3.1-Cldn2 plasmid was confirmed by Western blot analyses. Representative blots and quantitative analysis of Claudin-2 and CTGF are shown above. **P<0.01, vs NRK49F+NG; ##P<0.01, vs NRK49F+HG; &&P<0.01, vs NRK52E-pcDNA3.1-NC+NRK49F+HG. Abbreviations: PTECs, proximal tubular epithelial cells; NG, normal glucose, HG, high glucose; CTGF, connective tissue growth factor. |
Western blot results revealed that when co-cultured with NRK49F cells in NG, the expression of CTGF was higher in the NRK52E-si-Cldn2 group than that of NRK52E-si-NC group (Figure 5D–F, P<0.01). When co-cultured with NRK49F cells in HG, the expressions of CTGF decreased significantly in NRK52E cells in the pcDNA3.1-Cldn2 group compared with that of pcDNA3.1-NC group (Figure 5G–I, P<0.01). In addition, our study found that when the cells were cultured in NG, there was no significant difference in the expression levels of CTGF and Claudin-2 between NRK52E cells mono-cultured and co-cultured with NRK49F cells (Figure 5D–F). Intriguingly, when the cells cultured in HG, the expression of CTGF increased significantly in NRK52E co-cultured with NRK49F cells compared to that mono-cultured (Figure 5G–I, P<0.01). However, the expression of Claudin-2 did not change obviously.
Epithelial CTGF Regulated by Claudin-2 is Involved in Fibroblast Activation and Proliferation
As shown in Figure 6A and B, the number of PCNA+/α-SMA+-positive NRK49F cells further decreased in NRK52E-si-Cldn2-si-Ctgf group compared with that of NRK52E-si-Cldn2-si-NC control (P<0.01), when the cells were co-cultured in NG. The number of PCNA+/α-SMA+-positive NRK49F cells increased in NRK52E-pcDNA3.1-Cldn2-pcDNA3.1-Ctgf group compared with that of NRK52E-pcDNA3.1-Cldn2- pcDNA3.1-NC control, when the cells were co-cultured in HG (P<0.01). Similar results were observed in the EdU staining (Figure 6C and D, P<0.01). The interference efficiency of Clnd2 and Ctgf in NRK52E cells cultured in NG or HG were confirmed by Western blot analysis (Figure 7A–C). Western blot results revealed that when co-cultured with NRK52E cells in NG, the expression levels of α-SMA and Collagen I in NRK49F cells decreased significantly in NRK52E-si-Cldn2-si-Ctgf group compared with that of NRK52E-si-Cldn2-si-NC control (Figure 7D and E, P<0.01). When co-cultured with NRK52E cells in HG, the expression levels of α-SMA and Collagen I in NRK49F cells were higher in the NRK52E-pcDNA3.1-Cldn2-pcDNA3.1-Ctgf group than that of NRK52E-pcDNA3.1-Cldn2-si-NC control (Figure 7D and E, P<0.01). These data suggested that CTGF is involved in Claudin-2-driven communication between PTECs and fibroblasts.
 |
Figure 6 Claudin-2 deficiency induced tubular epithelial CTGF is involved in fibroblast activation and proliferation. (A and B) Immunocytochemistry revealed the nuclear localization of proliferating cell nuclear antigen (PCNA) in activated-fibroblasts in 5.5mM D-glucose (NG) medium or 30mM D-glucose (HG) medium ± co-culture with NRK52E cells ± si-Cldn2 ± pcDNA3.1-Cldn2 ± si-Ctgf ± pcDNA3.1-Ctgf. Cells were immune-stained for α-SMA (red) and PCNA (green) and counterstained with DAPI (blue). White arrows indicate positive staining. Magnification ×400, scale bar =100µm. (C and D) Representative image and quantitative analysis show the effect of interfering with Claudin-2 and CTGF protein expression in PTECs on fibroblast proliferation in 5.5mM D-glucose (NG) medium or 30mM D-glucose (HG) medium. Data are the mean ± SEM (n=3). **P<0.01, vs NRK52E-si-Cldn2-si-NC+NRK49F+NG; ##P<0.01, vs NRK52E-pcDNA3.1-Cldn2-pcDNA3.1-NC+HG. Abbreviations: PTECs, proximal tubular epithelial cells; PCNA, proliferating cell nuclear antigen; α-SMA, α-smooth muscle actin; DAPI, 4’,6-diamidino-2-phenylindole; NG, normal glucose; HG, high glucose. |
 |
Figure 7 Claudin-2 deficiency induced tubular epithelial CTGF facilitates fibroblasts to product matrix protein. (A) Western blot demonstrated CTGF inhibition in NRK52E-si-Cldn2 cells decreased α-SMA and collage I expression in NRK49F cells, when the cells were co-cultured in 5.5mM D-glucose (NG) medium. Overexpression of CTGF in NRK52E-pcDNA3.1-Cldn2 cells increased α-SMA and collage I expression in NRK49F cells, when the cells were co-cultured in 30mM D-glucose (HG) medium. (B and C) The interference efficiency of Claudin-2 and CTGF protein expression in NRK52E cells were confirmed by Western blot analyses. Quantitative analysis of Claudin-2 and CTGF are shown above. (D and E) Quantitative analysis of α-SMA and collagen I in NRK49F cells are shown above. Data are expressed as mean data ± SEM (n = 3), **P<0.01, NRK52E-si-Cldn2-si-NC+NRK49F+NG; ##P<0.01, vs NRK52E-pcDNA3.1-Cldn2-pcDNA3.1-NC+HG. Abbreviations: PTECs, proximal tubular epithelial cells; α-SMA, α-smooth muscle actin; Collagen I, Type I Collagen; CTGF, connective tissue growth factor; NG, normal glucose; HG, high glucose. |
Discussion
Fibrosis is a pathological fibrillar matrix that obliterates local structures. TIF is the inevitable outcome of all progressive chronic kidney diseases. The activation of α-SMA-positive myofibroblasts plays a key role in this process.4 The origins of myofibroblasts remain controversial, and possibilities include fibroblasts, pericytes, epithelial cells and endothelial cells. Although the majority of the kidney parenchyma is comprised of tubular epithelium. More recent studies appear to show that epithelia contribute little to the myofibroblast population after injury.25,26 Instead, recent studies have popularized the idea of “partial EMT” in which tubular epithelia acquire mesenchymal features but do not fully transform into a myofibroblast.27,28 PTEC is the main functional component of tubular epithelium. Growing evidence has shown that PTECs, rather than victims or bystanders, are probably a neglected mediator in renal fibrosis.29 In this process, profibrotic factors are secreted by injured PTECs to promote the recruitment of adjacent fibroblasts and complex cascades of signaling events leading to myo-fibroblastic activation, proliferation and ECM production.30 Our study developed an in vitro co-culture system in which fibroblasts were grown in a cell culture well, and PTECs were suspended on a permeable membrane above the fibroblasts’ monolayer. Our results indicated that Claudin-2 depletion in PTECs significantly promoted the activation and proliferation of fibroblasts in normal condition by inducing CTGF. Upregulated Claudin-2 expression significantly inhibited the activation and proliferation of fibroblasts in HG co-culture condition. In addition, our study also found that fibroblasts significantly increased the CTGF levels in co-cultured PTECs under HG stimulation than that of mono-cultured PTECs. The data indicated that the activated fibroblasts also produced profibrotic cytokines, which further promoted the paracrine effect of PTECs. All these results lead to the pathogenesis of TIF. These findings provided preliminary evidence for Claudin-2’s role in mediating PTECs-fibroblasts communication in DKD.
PTECs plays a major role in the bulk reclamation of water and solutes. It mainly depends on the aerobic generation of high levels of ATP for cell survival and tissue health. The high oxygen requirements are accounted for by the enormous re-absorptive functions of the PT that, in turn, render it particularly vulnerable to compromise ATP generation.3 A study found that the oxygen partial pressure of diabetic kidney cortex was 10 mmHg lower than that of control, indicating an increased kidney energy consumption in diabetes.31 Transcellular sodium reabsorption is the major determinant of energy consumption in the kidney.32 Increased glucose reabsorption capacity in diabetes is accompanied by a corresponding demand for Na+/K+ ATPase activity and increased oxygen consumption by the renal cortex.33 Unlike transepithelial transport, paracellular transport drives passive solute diffusion without ATP requirement and oxygen consumption. The rate-limiting step for paracellular transport presides at the tight junction.32 Claudin-2 is one of the tight junction proteins responsible for paracellular sodium reabsorption in the PTs. Claudin-2–null mice reabsorb sodium to the same extent but increase oxygen consumption in the kidneys compared to that of control animals,14 indicating that Claudin-2-mediated paracellular transport enhances the efficiency of renal energy utilization.
During the development of TIF, the injured PTECs undergo a partial EMT phenotype. EMT is characterized by a loss of cell to cell contact and apicobasal polarity, which are hallmarks of tight junction dysfunction.34 A study has confirmed that Claudin-2 decreased in PTECs at 21 days after STZ injection.35 Combining STZ and unilateral nephrectomy is an effective method for inducing experimental DKD.36 In our previous studies, the increased urinary albumin and injured PTECs have been observed in DKD rats at the 8th weeks after STZ treatment with unilateral nephrectomy.18,37 In this study, the results demonstrated tight junction was disrupted and the expression of Claudin-2 decreased significantly in PTECs of DKD rats at the 20th weeks after STZ treatment with unilateral nephrectomy. These data suggested that decreased expression of Claudin-2 occurs early in DKD and is accompanied by the progression of DKD. A variety of potentially harmful chronic stimuli could cause significant decrease in Claudin-2 abundance, including metabolic acidosis,38 TNF-α,39 epidermal growth factor (EGF)40 and the immune-suppressants sirolimus and cyclosporine A.41 Furthermore, previous study investigated hyperosmolarity treatment induced a significant decrease in Claudin-2.42 Hyperglycemia is a potential trigger of renal dysfunctions that can lead to the development of DKD,43 which is a well-known osmotic agent. In the current study, the effect of HG treatment on Claudin-2 is stronger than that of hyperosmolarity treatment. And the inhibiting effects of HG on Claudin-2 displayed a time dependence manner. However, our result was discordant with B.M. Mongelli-Sabino et al,44 their results reported that the expressions of Claudin-2 were significantly increased after acute HG (10mM D-glucose) treatment for 24 hours. A possible explanation for the discrepancy might be the different glucose concentrations. In addition, the difference in stimulation time can also affect Claudin-2 expression. Specifically, short-term TNF-α treatment caused an increase in Claudin-2 abundance.39 In contrast, prolonged (>8h) TNF-α or IL-1β treatment downregulated Claudin-2 expression.17 Manipulation of Claudin-2 expression could alter the proliferation of cancer cell lines.45 And many proliferative pathways affect Claudin-2 expression. For example, EphA2 signaling up-regulates the expression of the Claudin-2 that plays an important role in promoting cell proliferation and tumor growth in in A549 lung adenocarcinoma cells.46 Recently, miR-488 was shown to suppress progression of colorectal cancer via inhibition of the mitogen-activated protein kinase pathway by targeting Claudin-2.47 Although the intracellular mechanisms underlying the regulation of Claudin-2 proteins by HG remain to be determined, studies by Molina-Jijon et al determined that Claudin-2 was a direct target of reactive oxygen species as evidenced by its increased tyrosine nitration under diabetic condition.35
To analyze the paracrine effect of PTECs on fibroblasts, our Western blot and ELISA analysis showed that sustained Claudin-2 inhibition significantly elevated the intracellular and extracellular CTGF expression levels in PTECs and potentiated the activation and proliferation of surrounding fibroblasts. CTGF is considered to be one of the important paracrine mediators that promotes ECM deposition and fibrosis regulation in a variety of chronic kidney diseases. CTGF is typically secreted into the extracellular environment, where it interacts with cell surface receptors, growth factors and the ECM proteins.8 CTGF promotes fibroblast proliferation and ECM production through TGF-β dependent and TGF-β independent pathways.48,49 The secretion of CTGF in human urine was significantly correlated with the severity of DKD.50 And CTGF-deficient mice are protected from DKD.51 The cellular source of CTGF was not identified, which was detected not only in glomerular cells but also in tubular epithelial cells and interstitial cells of the diabetic kidney tissue. At present, the epigenetic mechanism of HG-induced CTGF transcription remains unclear. Myocardin-related transcription factor (MRTF) is an important class of transcription factors, comprising of two isoforms, MRTF-A and MRTF-B. MRTF play a versatile role in regulating renal fibrosis.52 Jing Shao et al53 reported that MRTF-A recruits histone demethylase KDM3A to activate CTGF transcription in PTECs under HG stimulation. Although the underlying mechanism between Claudin-2 and CTGF in DKD remains unclear. The latest study implicated that Claudin-2 was a negative regulator of MRTF. Claudin-2 loss enhanced RhoA-mediated activation of MRTF to promote the elevation of CTGF in PTECs.17
Conclusion
As shown in Figure 8, this study provided evidence that Claudin-2 loss in PTECs could contribute to the activation and proliferation of fibroblast in HG condition. CTGF is a crucial mediator in this process. Claudin-2 may play important role in mediating epithelial-fibroblast crosstalk in DKD. This association may hold potential as a therapeutic target in managing TIF in DKD. Recent study raised hope that targeting Claudin-2 could have beneficial effects. A monoclonal antibody that recognizes the first extracellular loop (ECL1) of Claudin-2 was shown to prevent TNF-α-induced tight junction disruption.54 Importantly, no major adverse effects were found. Although more studies are needed, these results clarified the role of Claudin-2 in DKD and helped to understand the pathogenesis of TIF.
 |
Figure 8 Schematic diagram showing Claudin-2 deficiency in PTECs promoting surrounding fibroblast activation and proliferation via inducing CTGF. In DKD, the tight junction between adjacent PTECs was disrupted, accompanied by decreased Claudin-2 expression. Claudin-2 loss may activate MRTF to promote CTGF transcription in PTECs, aggravating fibroblasts proliferation and facilitating matrix protein production and deposition. Created with BioRender.com. Abbreviations: PTECs, proximal tubular epithelial cells; ECM, extracellular matrix; α-SMA, a-smooth muscle actin; CTGF, connective tissue growth factor; MRTF, myocardin-related transcription factor. |
Abbreviations
DKD, diabetic kidney disease; TIF, tubule-interstitial fibrosis; PTECs, proximal tubular epithelial cells; NG, normal glucose; HG, high glucose; DM, diabetes mellitus; ESRD, end -stage renal disease; ECM, extracellular matrix; TGF-β, transforming growth factor-β; CTGF, connective tissue growth factor; EMT, epithelial–mesenchymal transition; ZO, zonula occludens; PT, proximal tubule; TNF-α, tumor necrosis factor-α; PAS, periodic acid-Schiff; ELISA, enzyme‑linked immunosorbent assay; DAPI, 4’,6-diamidino-2-phenylindole; PCNA, proliferating cell nuclear antigen; α-SMA, α-smooth muscle actin; Collagen I, Type I Collagen; DppD, Dipeptidyl peptidase, EdU, 5-ethynyl-2’-deoxyuridine; STZ, streptozocin; Unx, uninephrectomy; EGF, epidermal growth factor; ECL1, the first extracellular loop; MRTF, myocardin-related transcription factor.
Institutional Review Board Statement
All experiments were conducted following the Guiding Principles for the Care and Use of Laboratory Animals in China. Experimental protocols were approved by the Ethics Committee of the First Affiliated Hospital of Shandong First Medical University & Shandong Provincial Qianfoshan Hospital (SYKX shandong 2023-S065).
Data Sharing Statement
The data that support the findings of this study are available from the corresponding author (Lin Liao, PhD) upon reasonable request.
Acknowledgments
Schematics were created with BioRender.com. We would like to acknowledge Ms. Yu tian Tian ‘s guidance on Figure layout.
Author Contributions
All authors made a significant contribution to the work reported, whether that is in the conception, study design, execution, acquisition of data, analysis and interpretation, or in all these areas; took part in drafting, revising or critically reviewing the article; gave final approval of the version to be published; have agreed on the journal to which the article has been submitted; and agree to be accountable for all aspects of the work.
Funding
This work was funded by National Natural Science Foundation of China Grants (NO.82170847, 82105044), key project of Shandong Provincial Natural Science Foundation of China Grants (NO. ZR2020KH004); Shandong Provincial Natural Science Foundation of China Grants (No. ZR 2020QH310).
Disclosure
The authors declare no conflict of interest.
References
1. Bikbov B, Purcell CA, Levey AS; Collaboration GBDCKD. Global, regional, and national burden of chronic kidney disease, 1990–2017: a systematic analysis for the global burden of disease study 2017. Lancet. 2020;395(10225):709–733. doi:10.1016/S0140-6736(20)30045-3
2. Soheilipour F, Abbasi Kasbi N, Imankhan M, Eskandari D. Complications and treatment of early-onset type 2 diabetes. Int J Endocrinol Metab. 2023;21(3):e135004. doi:10.5812/ijem-135004
3. Gilbert RE. Proximal tubulopathy: prime mover and key therapeutic target in diabetic kidney disease. Diabetes. 2017;66(4):791–800. doi:10.2337/db16-0796
4. Yuan Q, Tan RJ, Liu Y. Myofibroblast in kidney fibrosis: origin, activation, and regulation. Adv Exp Med Biol. 2019;1165:253–283. doi:10.1007/978-981-13-8871-2_12
5. Peng Z, Wang H, Zheng J, et al. Is the proximal tubule the focus of tubulointerstitial fibrosis? Heliyon. 2023;9(2):e13508. doi:10.1016/j.heliyon.2023.e13508
6. Schiessl IM. The role of tubule-interstitial crosstalk in renal injury and recovery. Semin Nephrol. 2020;40(2):216–231. doi:10.1016/j.semnephrol.2020.01.012
7. Kok HM, Falke LL, Goldschmeding R, Nguyen TQ. Targeting CTGF, EGF and PDGF pathways to prevent progression of kidney disease. Nat Rev Nephrol. 2014;10(12):700–711. doi:10.1038/nrneph.2014.184
8. Zaykov V, Chaqour B. The CCN2/CTGF interactome: an approach to understanding the versatility of CCN2/CTGF molecular activities. J Cell Commun Signal. 2021;15(4):567–580. doi:10.1007/s12079-021-00650-2
9. Saito AC, Higashi T, Chiba H. Tight-junction strand networks and tightness of the epithelial barrier. Microscopy. 2023;72(3):213–225. doi:10.1093/jmicro/dfad008
10. Sun H, Li H, Yan J, et al. Loss of CLDN5 in podocytes deregulates WIF1 to activate WNT signaling and contributes to kidney disease. Nat Commun. 2022;13(1):1600. doi:10.1038/s41467-022-29277-6
11. Yu AS. Claudins and the kidney. J Am Soc Nephrol. 2015;26(1):11–19. doi:10.1681/ASN.2014030284
12. Nyimanu D, Behm C, Choudhury S, Yu ASL. The role of claudin-2 in kidney function and dysfunction. Biochem Soc Trans. 2023;51(4):1437–1445. doi:10.1042/BST20220639
13. Muto S, Hata M, Taniguchi J, et al. Claudin-2-deficient mice are defective in the leaky and cation-selective paracellular permeability properties of renal proximal tubules. Proc Natl Acad Sci U S A. 2010;107(17):8011–8016. doi:10.1073/pnas.0912901107
14. Pei L, Solis G, Nguyen MT, et al. Paracellular epithelial sodium transport maximizes energy efficiency in the kidney. J Clin Invest. 2016;126(7):2509–2518. doi:10.1172/JCI83942
15. Venugopal S, Anwer S, Szaszi K. Claudin-2: roles beyond permeability functions. Int J Mol Sci. 2019;20(22):5655. doi:10.3390/ijms20225655
16. Trujillo J, Molina-Jijon E, Medina-Campos ON, et al. Curcumin prevents cisplatin-induced decrease in the tight and adherens junctions: relation to oxidative stress. Food Funct. 2016;7(1):279–293. doi:10.1039/c5fo00624d
17. Dan Q, Shi Y, Rabani R, et al. Claudin-2 suppresses GEF-H1, RHOA, and MRTF, thereby impacting proliferation and profibrotic phenotype of tubular cells. J Biol Chem. 2019;294(42):15446–15465. doi:10.1074/jbc.RA118.006484
18. Guo C, Li Y, Zhang R, et al. Protective effect of salidroside against diabetic kidney disease through inhibiting BIM-mediated apoptosis of proximal renal tubular cells in rats. Front Pharmacol. 2018;9:1433. doi:10.3389/fphar.2018.01433
19. Xu C, Zhou X, Xie T, et al. Renal tubular Bim mediates the tubule-podocyte crosstalk via NFAT2 to induce podocyte cytoskeletal dysfunction. Theranostics. 2020;10(15):6806–6824. doi:10.7150/thno.43145
20. Zihni C, Mills C, Matter K, Balda MS. Tight junctions: from simple barriers to multifunctional molecular gates. Nat Rev Mol Cell Biol. 2016;17(9):564–580. doi:10.1038/nrm.2016.80
21. Van Itallie CM, Anderson JM. Architecture of tight junctions and principles of molecular composition. Semin Cell Dev Biol. 2014;36:157–165. doi:10.1016/j.semcdb.2014.08.011
22. Lee DB, Huang E, Ward HJ. Tight junction biology and kidney dysfunction. Am J Physiol Renal Physiol. 2006;290(1):F20–F34. doi:10.1152/ajprenal.00052.2005
23. Peng Q, Wu W, Wu KY, et al. The C5a/C5aR1 axis promotes progression of renal tubulointerstitial fibrosis in a mouse model of renal ischemia/reperfusion injury. Kidney Int. 2019;96(1):117–128. doi:10.1016/j.kint.2019.01.039
24. Williams BM, Cliff CL, Demirel I, Squires PE, Hills CE. Blocking connexin 43 hemichannel-mediated ATP release reduces communication within and between tubular epithelial cells and medullary fibroblasts in a model of diabetic nephropathy. Diabet Med. 2022;39(12):e14963. doi:10.1111/dme.14963
25. Humphreys BD, Lin SL, Kobayashi A, et al. Fate tracing reveals the pericyte and not epithelial origin of myofibroblasts in kidney fibrosis. Am J Pathol. 2010;176(1):85–97. doi:10.2353/ajpath.2010.090517
26. LeBleu VS, Taduri G, O’Connell J, et al. Origin and function of myofibroblasts in kidney fibrosis. Nat Med. 2013;19(8):1047–1053. doi:10.1038/nm.3218
27. Grande MT, Sanchez-Laorden B, Lopez-Blau C, et al. Snail1-induced partial epithelial-to-mesenchymal transition drives renal fibrosis in mice and can be targeted to reverse established disease. Nat Med. 2015;21(9):989–997. doi:10.1038/nm.3901
28. Lovisa S, Zeisberg M, Kalluri R. Partial epithelial-to-mesenchymal transition and other new mechanisms of kidney fibrosis. Trends Endocrinol Metab. 2016;27(10):681–695. doi:10.1016/j.tem.2016.06.004
29. Qi R, Yang C. Renal tubular epithelial cells: the neglected mediator of tubulointerstitial fibrosis after injury. Cell Death Dis. 2018;9(11):1126. doi:10.1038/s41419-018-1157-x
30. Gewin L, Zent R, Pozzi A. Progression of chronic kidney disease: too much cellular talk causes damage. Kidney Int. 2017;91(3):552–560. doi:10.1016/j.kint.2016.08.025
31. Laustsen C, Ostergaard JA, Lauritzen MH, et al. Assessment of early diabetic renal changes with hyperpolarized [1-(13) C]pyruvate. Diabetes Metab Res Rev. 2013;29(2):125–129. doi:10.1002/dmrr.2370
32. Asl Y. Paracellular transport and energy utilization in the renal tubule. Curr Opin Nephrol Hypertens. 2017;26(5):398–404. doi:10.1097/MNH.0000000000000348
33. Layton AT, Vallon V, Edwards A. Modeling oxygen consumption in the proximal tubule: effects of NHE and SGLT2 inhibition. Am J Physiol Renal Physiol. 2015;308(12):F1343–1357. doi:10.1152/ajprenal.00007.2015
34. Fujiwara-Tani R, Mori S, Ogata R, et al. Claudin-4: a new molecular target for epithelial cancer therapy. Int J Mol Sci. 2023;24:6.
35. Molina-Jijon E, Rodriguez-Munoz R, Namorado Mdel C, Pedraza-Chaverri J, Reyes JL. Oxidative stress induces claudin-2 nitration in experimental type 1 diabetic nephropathy. Free Radic Biol Med. 2014;72:162–175. doi:10.1016/j.freeradbiomed.2014.03.040
36. Uil M, Scantlebery AML, Butter LM, et al. Combining streptozotocin and unilateral nephrectomy is an effective method for inducing experimental diabetic nephropathy in the ‘resistant’ C57Bl/6J mouse strain. Sci Rep. 2018;8(1):5542. doi:10.1038/s41598-018-23839-9
37. Zhang YH, Zhang YQ, Guo CC, et al. Prostaglandin E1 attenuates high glucose-induced apoptosis in proximal renal tubular cells by inhibiting the JNK/Bim pathway. Acta Pharmacol Sin. 2020;41(4):561–571. doi:10.1038/s41401-019-0314-9
38. Balkovetz DF, Chumley P, Amlal H. Downregulation of claudin-2 expression in renal epithelial cells by metabolic acidosis. Am J Physiol Renal Physiol. 2009;297(3):F604–F611. doi:10.1152/ajprenal.00043.2009
39. Amoozadeh Y, Dan Q, Xiao J, Waheed F, Szaszi K. Tumor necrosis factor-alpha induces a biphasic change in claudin-2 expression in tubular epithelial cells: role in barrier functions. Am J Physiol Cell Physiol. 2015;309(1):C38–C50. doi:10.1152/ajpcell.00388.2014
40. Ikari A, Takiguchi A, Atomi K, Sugatani J. Epidermal growth factor increases clathrin-dependent endocytosis and degradation of claudin-2 protein in MDCK II cells. J Cell Physiol. 2011;226(9):2448–2456. doi:10.1002/jcp.22590
41. Martin-Martin N, Dan Q, Amoozadeh Y, et al. RhoA and Rho kinase mediate cyclosporine A and sirolimus-induced barrier tightening in renal proximal tubular cells. Int J Biochem Cell Biol. 2012;44(1):178–188. doi:10.1016/j.biocel.2011.10.014
42. Ikari A, Fujii N, Hahakabe S, et al. Hyperosmolarity-induced down-regulation of Claudin-2 mediated by decrease in PKCbeta-Dependent GATA-2 in MDCK Cells. J Cell Physiol. 2015;230(11):2776–2787. doi:10.1002/jcp.25004
43. Wu T, Ding L, Andoh V, Zhang J, Chen L. The mechanism of hyperglycemia-induced renal cell injury in diabetic nephropathy disease: an update. Life. 2023;13:2.
44. Mongelli-Sabino BM, Canuto LP, Collares-Buzato CB. Acute and chronic exposure to high levels of glucose modulates tight junction-associated epithelial barrier function in a renal tubular cell line. Life Sci. 2017;188:149–157. doi:10.1016/j.lfs.2017.09.004
45. Wei M, Zhang Y, Yang X, et al. Claudin-2 promotes colorectal cancer growth and metastasis by suppressing NDRG1 transcription. Clin Transl Med. 2021;11(12):e667. doi:10.1002/ctm2.667
46. Sukka-Ganesh B, Mohammed KA, Kaye F, Goldberg EP, Nasreen N. Ephrin-A1 inhibits NSCLC tumor growth via induction of Cdx-2 a tumor suppressor gene. BMC Cancer. 2012;12(1):309. doi:10.1186/1471-2407-12-309
47. Wang YB, Shi Q, Li G, Zheng JH, Lin J, Qiu W. MicroRNA-488 inhibits progression of colorectal cancer via inhibition of the mitogen-activated protein kinase pathway by targeting claudin-2. Am J Physiol Cell Physiol. 2019;316(1):C33–C47. doi:10.1152/ajpcell.00047.2018
48. Sakai N, Nakamura M, Lipson KE, et al. Inhibition of CTGF ameliorates peritoneal fibrosis through suppression of fibroblast and myofibroblast accumulation and angiogenesis. Sci Rep. 2017;7(1):5392. doi:10.1038/s41598-017-05624-2
49. Wang Y, Yu Y, Xu M, Zhou J, Kang G, Li K. Circ_0080940 regulates miR-139-5p/CTGF pathway to promote the proliferation, migration, extracellular matrix deposition of human tenon’s capsule fibroblasts. Curr Eye Res. 2023;48(1):34–43. doi:10.1080/02713683.2022.2138449
50. Slagman MC, Nguyen TQ, Waanders F, et al. Effects of antiproteinuric intervention on elevated connective tissue growth factor (CTGF/CCN-2) plasma and urine levels in nondiabetic nephropathy. Clin J Am Soc Nephrol. 2011;6(8):1845–1850. doi:10.2215/CJN.08190910
51. Nguyen TQ, Roestenberg P, van Nieuwenhoven FA, et al. CTGF inhibits BMP-7 signaling in diabetic nephropathy. J Am Soc Nephrol. 2008;19(11):2098–2107. doi:10.1681/ASN.2007111261
52. Miranda MZ, Lichner Z, Szaszi K, Kapus A. MRTF: basic biology and role in kidney disease. Int J Mol Sci. 2021;22(11):6040. doi:10.3390/ijms22116040
53. Shao J, Xu H, Wu X, Xu Y. Epigenetic activation of CTGF transcription by high glucose in renal tubular epithelial cells is mediated by myocardin-related transcription factor A. Cell Tissue Res. 2020;379(3):549–559. doi:10.1007/s00441-019-03124-5
54. Takigawa M, Iida M, Nagase S, et al. Creation of a Claudin-2 binder and its tight junction-modulating activity in a human intestinal model. J Pharmacol Exp Ther. 2017;363(3):444–451. doi:10.1124/jpet.117.242214
 © 2024 The Author(s). This work is published and licensed by Dove Medical Press Limited. The
full terms of this license are available at https://www.dovepress.com/terms
and incorporate the Creative Commons Attribution
- Non Commercial (unported, 3.0) License.
By accessing the work you hereby accept the Terms. Non-commercial uses of the work are permitted
without any further permission from Dove Medical Press Limited, provided the work is properly
attributed. For permission for commercial use of this work, please see paragraphs 4.2 and 5 of our Terms.
© 2024 The Author(s). This work is published and licensed by Dove Medical Press Limited. The
full terms of this license are available at https://www.dovepress.com/terms
and incorporate the Creative Commons Attribution
- Non Commercial (unported, 3.0) License.
By accessing the work you hereby accept the Terms. Non-commercial uses of the work are permitted
without any further permission from Dove Medical Press Limited, provided the work is properly
attributed. For permission for commercial use of this work, please see paragraphs 4.2 and 5 of our Terms.