Back to Journals » Journal of Pain Research » Volume 14
Classification of Qualitative Fieldnotes Collected During Quantitative Sensory Testing: A Step Towards the Development of a New Mixed Methods Approach in Pain Research
Authors Bordeleau M ![]() , Léonard G
, Léonard G ![]() , Gauthier L, Ferland CE, Backonja M, Vollert J, Marchand S, Jackson P, Cantin L, Prud'Homme M
, Gauthier L, Ferland CE, Backonja M, Vollert J, Marchand S, Jackson P, Cantin L, Prud'Homme M
Received 26 February 2021
Accepted for publication 16 June 2021
Published 18 August 2021 Volume 2021:14 Pages 2501—2511
DOI https://doi.org/10.2147/JPR.S301655
Checked for plagiarism Yes
Review by Single anonymous peer review
Peer reviewer comments 2
Editor who approved publication: Professor Michael Überall
Video abstract of "Classification of qualitative fieldnotes collected during QST" [ID 301655].
Views: 242
Martine Bordeleau,1,2 Guillaume Léonard,1,2 Lynn Gauthier,3– 6 Catherine Estelle Ferland,7– 9 Miroslav Backonja,10,11 Jan Vollert,12– 15 Serge Marchand,2,16 Philip Jackson,17– 19 Léo Cantin,20,21 Michel Prud’Homme20,21
1Faculty of Medicine and Health Sciences, Université de Sherbrooke, Sherbrooke, QC, Canada; 2Research Center on Aging, CIUSSS de l’Estrie-CHUS, Sherbrooke, QC, Canada; 3Department of Family and Emergency Medicine, Faculty of Medicine, Université Laval, Quebec City, QC, Canada; 4Équipe de recherche Michel-Sarrazin en oncologie psychosociale et soins palliatifs, Quebec City, QC, Canada; 5Oncology Division, CHU de Québec-Université Laval Research Center, Quebec City, QC, Canada; 6Université Laval Cancer Research Center, Quebec City, QC, Canada; 7Department of Anesthesia, McGill University, Montreal, QC, Canada; 8Integrated Program in Neuroscience, McGill University, Montreal, QC, Canada; 9Shriners Hospitals for Children-Canada, Montreal, QC, Canada; 10Department of Neurology, University of Wisconsin, Madison, WI, USA; 11Department of Neurology, University of Washington, Seattle, WA, USA; 12Pain Research, MSK lab, Department of Surgery and Cancer, Imperial College London, London, UK; 13Division of Neurological Pain Research and Therapy, Department of Neurology, University Hospital of Schleswig-Holstein, Campus Kiel, Kiel, Germany; 14Department of Anaesthesiology, Intensive Care and Pain Medicine, University Hospital Muenster, Münster, Germany; 15Neurophysiology, Mannheim Center of Translational Neuroscience (MCTN), Medical Faculty Mannheim, Heidelberg University, Heidelberg, Germany; 16Sherbrooke University Hospital Research Center (CRCHUS), Sherbrooke, QC, Canada; 17CIRRIS, Quebec City, QC, Canada; 18CERVO Brain Research Center, Quebec City, QC, Canada; 19School of Psychology, Laval University, Quebec City, QC, Canada; 20Centre de recherche du CHU de Québec – Université Laval, Axe neurosciences, Quebec City, QC, Canada; 21Department of Surgery, Division of neurosurgery, CHU de Québec – Université Laval, Quebec City, QC, Canada
Correspondence: Martine Bordeleau Email [email protected]
Purpose: Quantitative sensory testing (QST) is a standardized method to assess somatosensory function. The collection of qualitative information, during the QST procedure, could be an interesting way to facilitate the characterization of altered sensory perception and the identification of different pain phenotypes. The aims of this study were 1) to classify qualitative fieldnotes of sensory abnormalities collected during an independent QST study, and 2) to generate a qualitative interview guide that could be included in the traditional QST procedure as a step towards the implementation of a mixed methods approach.
Patients and Methods: QST data were collected from 48 chronic neuropathic pain patients treated with spinal cord stimulation (SCS). Three body areas, with or without SCS, were tested: the painful limb targeted by SCS, the contralateral area, and the ipsilateral upper limb. After each trial of each QST modality, patients were encouraged to report any sensory abnormalities they could identify with a pain quality scale or using their own words.
Results: Qualitative self-reported sensory abnormalities were dichotomized into two groups: altered sensory intensities and altered sensory perceptions. Altered sensory intensities were classified as sensory loss or sensory gain subgroups. Altered sensory perceptions were classified as paresthesia and dysesthesia subgroups Overall, 630 qualitative fieldnotes of altered sensations were collected: 385 on the painful limb, 173 at the contralateral area, and 72 at the ipsilateral upper limb. Based on these qualitative data, we propose a standardized method to collect qualitative data involving 9 open- and close-ended questions and 21 codes.
Conclusion: Our findings have highlighted the value of qualitative sensory evaluation during QST and constitute an important milestone in the development of a mixed methods protocol in phenotyping research.
Keywords: sensory evaluation, sensory abnormality, qualitative approach, quantitative approach, mixed methods research
Introduction
Chronic pain is a rising problem in aging societies, its prevalence estimated to affect up to 33% of the adult population of low and middle-income countries.1,2 Accurate diagnostic methods are required to precisely differentiate pain phenotypes and select the best course of treatment. For neuropathic pain, ie, pain arising from a lesion or disease of the nervous system,3–5 sensory evaluation is an essential part of the neurological examination. Clinical sensory examinations aim to evaluate functional status of the specific types of sensory receptors as they respond to various stimuli (light touch, pressure, vibration, etc.) from using specific tools (thermode, monofilaments, tuning fork, etc.). The anatomical pattern of abnormal sensory findings can help clinicians to identify the anatomic location of the lesion along the neural axis, from receptors on peripheral nerve endings to the brain where stimuli are interpreted – an essential step, in many cases, for making the proper diagnosis.6 Physicians usually identify sensory abnormalities by comparing the testing stimuli in the affected area to the perception in the non-affected areas, or by relying on their clinical judgment.7 Unless the examination is standardized, it is unlikely to generate the reproducible and measurable stimuli needed for clinical and research settings.8
Quantitative sensory testing (QST) provides precise and accurate information following standardized procedures for evaluating the magnitude of sensory changes, which are useful to detect and quantify sensory gain (ie, increase of sensory intensity) or loss (ie, decrease of sensory intensity). QST has recently been used to classify patients based on their sensory patterns into subgroups of neuropathic pain, enabling phenotype-stratified trials and treatments.9–11 In 2006, the German Research Network on Neuropathic Pain (DFNS) developed a standardized QST protocol which greatly improved the application and accessibility of somatosensory examination in laboratories.12,13 This team proposed an approach using individual QST data from patients, transformed into z-scores based on region-sex-age-matched data from healthy controls. Reference data from the control population are given as means and 95% confidence intervals (95% CI). When a patient’s z-score is above or below the 95% CI, it is considered as an abnormal sensory gain or loss of function, respectively. This approach led to reproducible results, with high specificity and moderate sensitivity for the detection of sensory abnormalities.14 However, the clinical translation of QST results from the laboratory setting to clinical setting has been challenging thus far. For example, in a recent study, Forstenpointner et al15 aimed
to investigate sensory profiles in patients with various neuropathic conditions, including polyneuropathy, mononeuropathy, and lesions to the central nervous system, in relation to self-reported presence or absence of pain and pain sensitivity using the Pain Sensitivity Questionnaire.
Following a thorough analysis of their data, a main finding was that “QST profiles did not differ between painful and painless patients.” This conclusion was the basis of Schmelz’s commentary,16 which stated that “In short, QST failed to provide mechanistic insights into neuropathic pain.” In their response, Vollert et al17 concluded that
All [Schmelz’s arguments] do not render QST a failure, as the headline of his comment suggests, it only renders QST a part of the real world, where no single procedure or test can or should stand on its own but contribute to a holistic picture of the patient’s condition.
Adding a qualitative component to the QST procedure would add valuable information about patients’ perception which could contribute to the detection of sensory abnormalities. The value of combining quantitative and qualitative information has been well demonstrated in research (mixed methods designs). The purpose of a mixed methods approaches is to combine qualitative and quantitative methods to consider important data that could have been missed if only one of these approaches had been used.18 These approaches combine the advantages of participants fieldnotes of their own experience (detailed description of real-life contexts) with the advantages of numbers (measurement of the magnitude and frequency of variables).19,20 For example, from a sensory assessment perspective, the qualitative approach could be used to identify the presence of an abnormality while the quantitative approach could be used to assess the magnitude, frequency, and size of the abnormality.
Accordingly, our first objective was to organize and classify qualitative fieldnotes of sensory abnormalities collected during a previous QST study.21 A second objective was to generate a qualitative interview guide, based on these qualitative results, that could be included in the traditional QST procedure as a step towards the development of a mixed methods approach.
Patients and Methods
Population
Qualitative fieldnotes were collected among 48 patients with chronic neuropathic pain during an independent multicenter QST study.21 Recruitment for the QST study occurred between January 2016 and November 2017 at three research centers: CHU de Québec – Université Laval, Canada; University of Toledo Medical Center, USA; and Centre hospitalier de l’Université de Montréal, Canada. Inclusion criteria were the following: older than 18 years old; French or English speaker; diagnosed with complex regional pain syndrome and failed back surgery syndrome (meeting the International Association for the Study of Pain’s criteria22,23); implanted with a spinal cord stimulator device for at least 6 months; having the same programming parameters or medication for at least 30 days before testing; using tonic stimulation mode only; feeling the paresthesia induced by tonic spinal cord stimulation (SCS) in one or both legs. Participants were excluded if they had received any other neuromodulatory treatment (peripheral nerve stimulation, transcutaneous electrical nerve stimulation, etc.) or if they had reported a surgical revision 6 months prior to inclusion. Participants were asked to report their percent of pain relief with SCS at the time of recruitment. The study was registered at clinicaltrials.gov (project ID: NCT02837822). This study was conducted in accordance with the Declaration of Helsinki and approved by the institutional review board of each collaborating center: Centre de recherche du CHU de Québec (project ID: 2018–1655), University of Toledo Medical Center (project ID: 201151), Centre hospitalier de l’Université de Montréal (project ID: MP-20-2015-2072). All participants provided written informed consent for their participation.
QST Study
The assessment of the independent QST study was described previously.21 Briefly, two testing sessions (spinal cord stimulator turned On vs turned Off) were randomly scheduled at 1- to 4-week intervals. Three different areas were evaluated at each visit: the most painful leg targeted by SCS where paresthesia was clearly felt (target area); the contralateral leg (contralateral area); and a control pain-free upper limb site ipsilateral to the target area (ipsilateral area). All assessments were performed by the same investigator (MB). A standardized QST protocol was administered. This protocol was inspired by the German Research Network on Neuropathic Pain12 and the Quebec Pain Research Network24 protocols regarding QST verbal instructions and technical handling. Four thermal parameters followed by five mechanical parameters were evaluated. Thermal thresholds – including cold detection threshold (CDT), heat detection threshold (HDT), cold pain threshold (CPT), and heat pain threshold (HPT) – were measured using a TSA-II neurosensory Analyzer (Medoc, Ramat Yishai, Israel). Mechanical modalities included mechanical detection threshold (MDT, Von Frey monofilaments, Bioseb, Pinellas Park, Florida), dynamic mechanical allodynia (DMA, SENSELab Brush-05, Somedic AB, Hörby, Sweden), vibration detection threshold (VDT, VSA3000, Medoc, Ramat Yishai, Israel), pressure pain threshold (PPT, The Wagner Force Ten™ FDX Digital Algometer, Wagner, Greenwich, Connecticut), and mechanical temporal pain summation (Mechanical-TSP, Neuropen and Neurotips, Owen Mumford, Saint Marcel, France).
Qualitative Fieldnotes
After each trial for each QST modality in each area, participants were encouraged to report any sensory abnormalities they could identify. No prespecified procedure was followed to collect these qualitative fieldnotes. The evaluator (MB) asked open- and closed-ended questions that she considered relevant to help the participants characterize their sensory perception. The evaluator also used a tool including 13 illustrations of sensory quality term to help with the description of any abnormal sensations perceived by the participants: 1. pulse, 2. electrical shock, 3. hammer blow, 4. needle prick, 5. cut, 6. pinch, 7. tightness, 8. crush, 9. stretch, 10. burn, 11. freeze, 12. itch, 13. numbness.25 They were also invited to report and describe, in their own words, any other sensory abnormalities they could identify. Participants were encouraged to report any difference of sensation intensity between areas (eg, more painful, less painful, no pain, more sensitive, less sensitive, no sensation).
If the participant experienced and reported the same abnormal sensation during a series of trials for a specific QST modality in a specific area, during the same visit, the repeated experience was considered as one fieldnote. If a sensory abnormality was reported in two different areas, during the same QST modality, and the same visit, it was considered as two independent fieldnotes. If a sensory abnormality was reported in both visits, in the same area, and during the same QST modality, it was considered as two independent fieldnotes. A test that was not sensitive enough to allow the participant to detect a stimulus (subthreshold stimulation) was considered as a sensory abnormality. The absence of thermal sensory perception during the QST procedure (thermal detection and pain thresholds) was defined as no detection of cooling and/or warming stimuli up to the cut-off values of 0 °C and 50 °C, respectively. The absence of mechanical sensation (mechanical detection threshold, vibration detection threshold, pressure pain threshold) was defined as no detection of touch, and/or vibration, and/or pressure up to the cut-off values of 300 g, 130 μm, and 11 kg, respectively.
Qualitative Data Analysis
A general inductive approach was followed to infer a classification based on our qualitative fieldnotes. Inductive analysis refers to approaches that primarily use detailed of raw data to derive concepts, themes, or a model through interpretations by an evaluator or researcher.26 The analysis followed these steps: 1) Preparation of raw data file: raw data (ie, qualitative fieldnotes) were compiled using a standard data extraction spreadsheet (Microsoft Excel, Microsoft Corporation, Washington, United States); 2) Attentive reading of the text: MB reviewed several times the raw data collected to identify emerging patterns and gain an understanding of the themes and events covered in the raw text; 3) Creation of a classification system: from the raw data, categories, groups, and subgroups were developed into a classification system; 4) Continuing revision and refinement of the classification system: after discussion, a classification and a coding frame were developed by all authors and the fieldnotes were coded by MB. If new codes emerged, the encoding frame was modified, and the transcripts were reread according to the new structure.
Results
Population
Forty-eight patients were included in the independent QST study (65% were men). The mean age was 57.4 ± 11.1 years (range 35–77 years). Forty-two participants were diagnosed with failed back surgery syndrome (FBSS) and six were diagnosed with complex regional pain syndrome (CRPS). The mean percent pain relief with SCS at the time of recruitment was 52.3 ± 23.6% (range 0–99%). Overall, 71% (n=34) of patients reported pain in only one leg, while 29% (n=14) reported pain in both legs. Furthermore, 62% (n=30) of patients felt SCS stimulation in only one leg, while 38% (n=18) felt SCS stimulation in both legs. Five patients (10%) were considered as non-responders for SCS because they experienced less than 30% of pain relief with this approach.
Classification of Sensory Abnormalities
A total of 630 fieldnotes of qualitative sensory abnormalities were collected from 46/48 participants (96%) across the two assessment times of the QST study. These deidentified fieldnotes are shared in Table S1. Two patients (4%) did not self-report any sensory abnormality. The classification suggested by our team presents sensory abnormalities that can be observed according to the QST modality tested in relation with the experience reported by the participants (Figure 1).
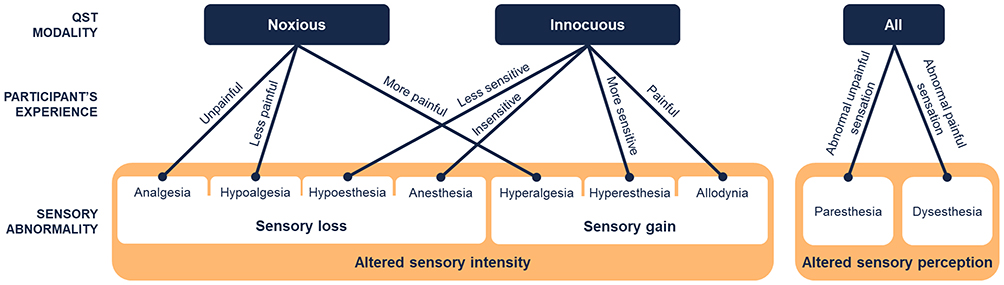 |
Figure 1 Classification of qualitative fieldnotes of sensory abnormality collected during the quantitative sensory testing procedure. |
Each fieldnote has been assigned to two categories of QST modality: 1) noxious stimuli which normally induce pain by the activation of nociceptors, such as pain thresholds, tolerance threshold, temporal pain summation; and 2) innocuous stimulus which is normally not painful, such as detection thresholds, dynamic mechanical allodynia.
Then, according to the experience of the participant, the collected fieldnotes were classified into two groups: 1) altered sensory intensity (sensory loss or gain), and/or 2) altered sensory perception. In the first group, altered sensory intensity (ie, increase or decrease in the level of sensitivity experienced and reported by the patient) were divided in the following subgroups: analgesia (absence of pain in response to a stimulus that is normally painful27), hypoalgesia (decreased pain sensitivity to normally painful stimulus27), hypoesthesia (decreased sensitivity to normally unpainful stimulus28) and anesthesia (absence of sensation in response to normally unpainful stimulus). Sensory gains were classified in the following subgroups: hyperalgesia (increased pain sensitivity to normally painful stimulus27,28), hyperesthesia (increased sensitivity to normally unpainful stimulus28), and allodynia (pain due to a normally unpainful stimulus27,28). In the second group, altered sensory perception (eg, brush sensation felt like “water flow” or “electrical shock”) were classify in the following subgroups: paresthesia (abnormal unpainful sensation27) and dysesthesia (abnormal painful sensation).
Table 1 shows an overview of the number of qualitative fieldnotes of sensory abnormalities reported during the QST procedure and classified following the coding book proposed by our team. Three hundred eighty-five fieldnotes were reported at the target area by 46 patients (96%), compared to 173 at the contralateral area by 40 patients (83%), and 72 at the ipsilateral control leg by 26 patients (54%) (Figure 2). Overall, the most common sensory abnormalities observed were analgesia and hypoesthesia – with 193 (31%) and 117 (19%) fieldnotes, respectively – followed by hyperalgesia (14%), dysesthesia (10%), paresthesia (10%), allodynia (7%), anesthesia (7%), hyperesthesia (2%) and hypoalgesia (0.3%).
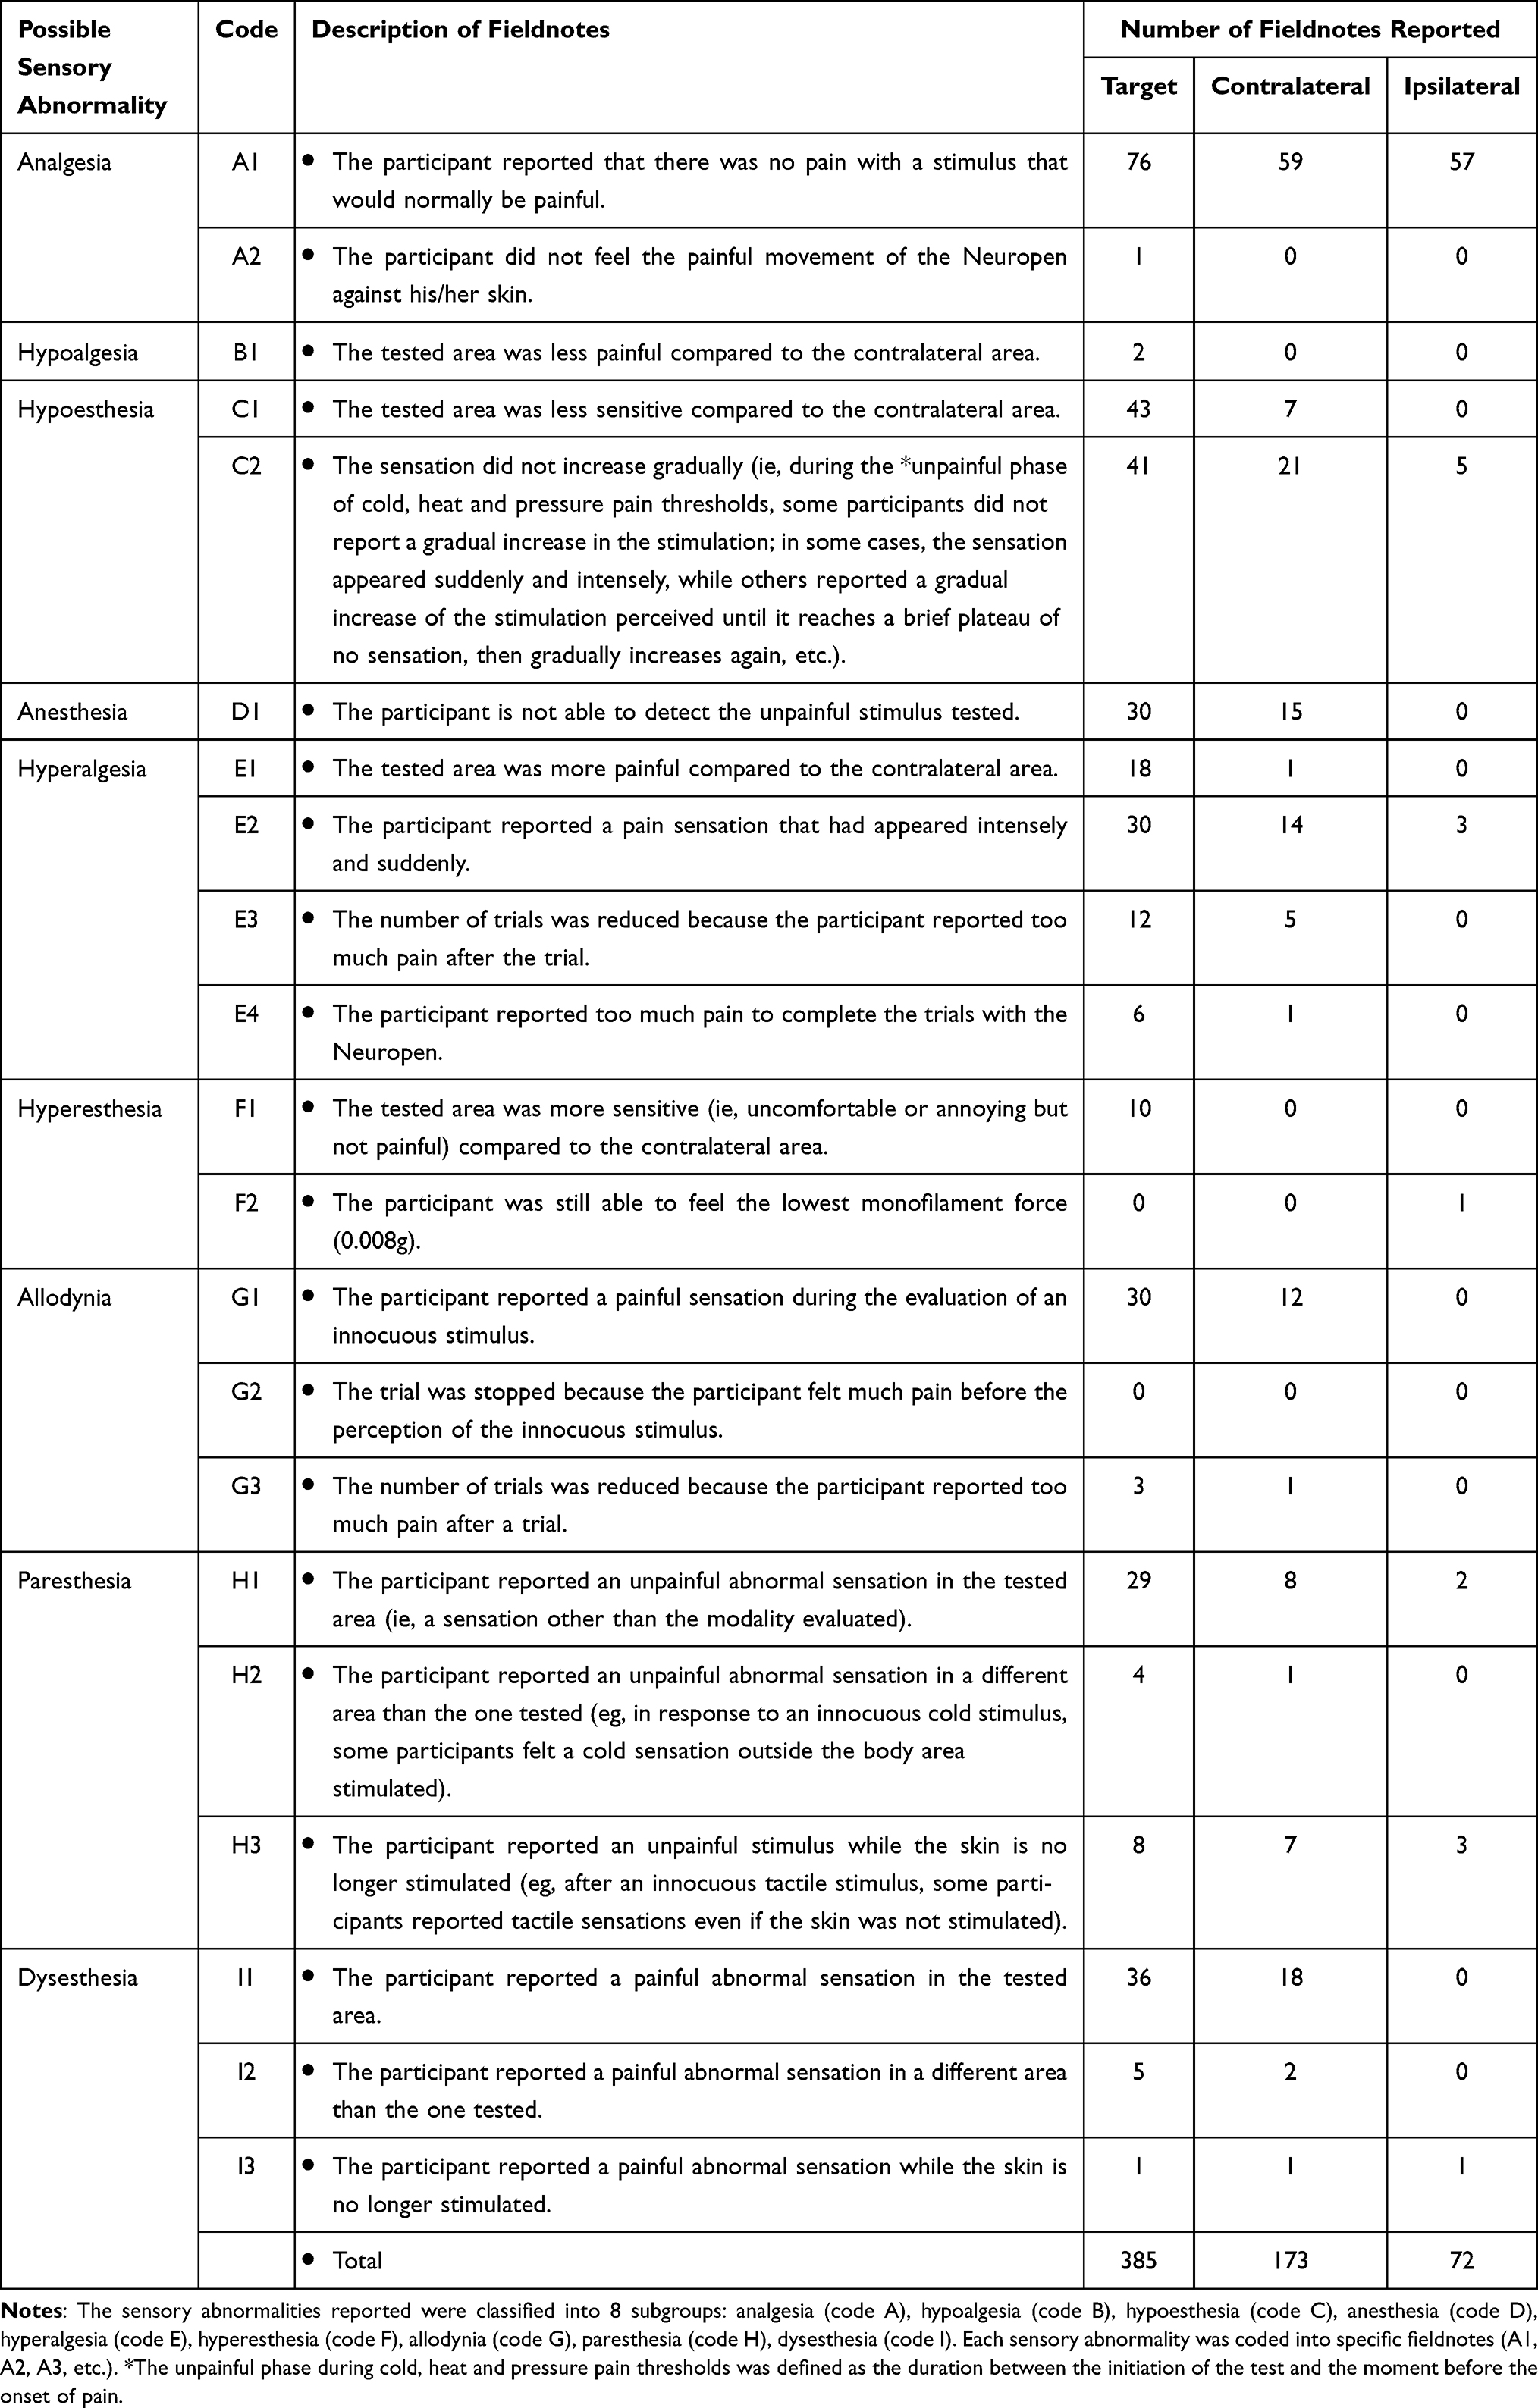 |
Table 1 Codification System Based on the Qualitative Fieldnotes of Sensory Abnormality Observed During the Quantitative Sensory Testing Procedure |
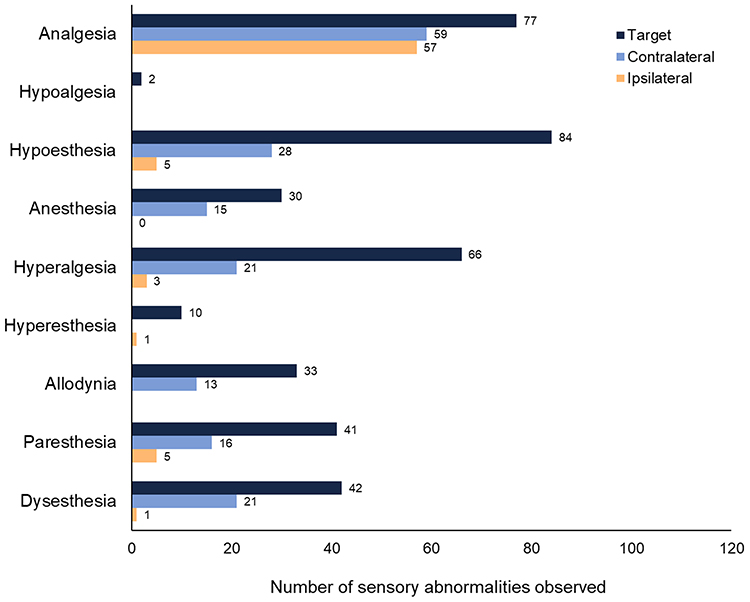 |
Figure 2 Overview of qualitative fieldnotes of sensory abnormality self-reported in each tested area. |
The Supplementary Tables S2, S3, S4, and S5 give an overview of the qualitative fieldnotes of sensory abnormalities self-reported during each QST modality at each area and classified following the coding book proposed by our team. These abnormalities could be detected in future QST studies by using the interview guide developed by our team (Table 2). This interview guide was adapted to be feasible within the existing QST protocol short idle times.
 |
Table 2 Interview Guide |
Discussion
Our qualitative results may have highlighted the potential importance of qualitative evaluation for sensory and pain assessment during QST. Accordingly, our team have proposed a classification system and an interview guide as a qualitative approach which could be added to the traditional QST. Previous studies have evaluated the degree of consensus between quantitative sensory testing and independent qualitative methods.29–34 These studies have highlighted the lack of agreement between quantitative sensory testing and independent qualitative sensory testing, suggesting that these approaches are complementary rather than substitutive, and, taken as a whole, could combine the benefits of numbers with the benefits of a detailed description of the participants’ experiences. Moreover, sensory perception and pain are personal phenomena experienced in an intimate and unique way by each individual;35 this diversity ultimately contributes to an important variability between subjects among quantitative21,24 and qualitative results, emphasizing the value of developing a personalized approach to sensory perception evaluation.
Our team has therefore proposed a classification system and an interview guide to be used alongside the QST protocol to better characterize phenotype with the breadth and depth of information from qualitative and quantitative data in a step towards the development of a mixed methods approach. We believe that the development of a mixed methods design could help to achieve this goal. In the context of mixed methods designs, the study involves the implementation of qualitative and quantitative components, the results of which are then integrated through merging analyses and interpretation to develop more holistic and comprehensive conclusion.20,36 The unique challenge of mixed methods is to plan for and achieve meaningful integration.37 Integration is the explicit dialogue between the qualitative and the quantitative elements of a mixed methods study; it is what distinguishes a mixed methods study from a study that includes some quantitative information and some qualitative information.20 Failure to achieve meaningful integration will affect the quality of the inferences produced and simply does not take advantage of the benefit of mixed research methods.36 In perspective, our team aims to carefully plan how to facilitate meaningful integration of qualitative and quantitative results obtained during the QST procedure in clinical and research settings. For instance, open-access electronic clinical decision support algorithms combined with an online version of our interview guide could be developed to help the identification of qualitative sensory abnormalities. These algorithms could indicate sensory abnormalities that are associated with the participants’ interview responses based on our classification. In parallel, quantitative approaches (such as QST and body mapping) could be used to assess the magnitude, frequency, and size of the abnormality. This mixed methods approach could be especially helpful, for example, in evaluating the impact of a specific intervention on the occurrence and severity of sensory abnormalities (such as in neuropathic pain treatments context). The following paragraphs explain how the inclusion of our interview guide in the traditional QST procedure could overcome some challenges in the collection and classification of qualitative data.
Side-to-side comparison between two contralateral areas allows for a more sensitive assessment of sensory abnormalities in unilateral diseases, while it is less useful in bilateral diseases affecting both contralateral areas – in which case, none of the areas can be used as a healthy reference side. This underlines the importance of developing qualitative assessment approaches during QST that complement side-to-side evaluations. For example, our fieldnotes lead us to be aware that certain signs of sensory abnormality can be detected by investigating the sensations felt during the unpainful phase preceding the onset of pain thresholds. We have defined the unpainful phase as the period during which the stimulus intensity gradually increases before the beginning of the painful sensation. Normally, a healthy participant should be able to describe sensation felt during this phase as unpainful, increasing gradually, and corresponding to the modality tested at the right body area stimulated. In our study, some participants experienced signs of hypoesthesia as they did not report a gradual increase in the sensation tested during the unpainful phase; rather, the sensation appeared sudden and intensely painful and was as a sign of hyperalgesia. While others reported a gradual increase of the stimulation perceived until it reaches a plateau, then gradually increases again. This fieldnote was classified as a sign of hypoesthesia.
Our results also suggest that some individuals are naturally more sensitive to light stimuli than others; this condition should not be considered a sensory abnormality. Indeed, Boterberg et al38 described high sensory processing sensitivity as a personality trait involving increased sensitivity to subtle stimuli and deeper cognitive processing. Interestingly, 15 to 20% of the population present high sensory processing sensitivity.39 Those individuals are believed to be easily overstimulated by external stimuli due to lower perceptual thresholds.39 Accordingly, only fieldnotes from participants who reported an unpleasant or annoying sensation associated with an unpainful stimulation were classified as hyperesthesia. For example, some participants reported an unpleasant but unpainful sensation when the soft brush was applied to their skin during the dynamic mechanical allodynia assessment. A few participants also reported the unpleasant sensation of being constantly aware of the movements of their clothing on their skin, which could also be a sign of hyperesthesia.
Moreover, analgesia and anesthesia were associated in our classification with the inability to detect the sensory modality assessed. Participants were considered unable to identify detection or pain thresholds if no cooling, warming, touch, vibration, or pressure stimuli were felt before exceeding the safety limit values (ie, 0–50 °C, 300 g, 130 μm, and 11 kg, respectively). Thirty-eight percent of our collected fieldnotes were considered as signs of analgesia and anesthesia. However, because of the safety limit values, we cannot be certain that these fieldnotes were associated with the complete absence of sensation or pain; perhaps with a stimulus intensity outside of the safety limit values, sensation or pain could have been felt.
Our findings also indicate that special attention should be given to the detection of abnormal sensations in terms of quality, duration, and localization. We classified such fieldnotes as paresthesia (abnormal unpainful sensation) and dysesthesia (abnormal painful sensation). For example, an innocuous sensation of water flow was reported by two participants when a soft brush was applied to their skin (sign of paresthesia), while some participant reported a burning sensation with the same stimulus (sign of dysesthesia). Surprisingly, a few participants were able to detect unpainful heat sensation but were not able to detect unpainful cold sensation. In some of these cases, painful cold stimuli produced a sensation of paradoxical heat pain. Defrin et al40 reported similar findings and proposed that the sensory nervous system could compensate for the loss of one of its modalities in order to maintain the ability to detect warning signals. Another interesting fieldnote concern the persistence of the sensation after the end of the stimuli as reported by 6 participants; for example, some of them continued to feel a sensation of touch even if the monofilament was not touching their skin. This fieldnote was considered as a sign of paresthesia. On the other hand, a persistent painful sensation was considered as a sign of dysesthesia. Another frequent fieldnote reported involves the perception of induced of spontaneous sensations in a different area than the one tested. For example, some participants felt a touch sensation induced with a monofilament on the contralateral area.
There are some limitations to the interpretation of the findings that should be considered. First, the collection of qualitative fieldnotes did not follow a standardised procedure; it is likely that more fieldnotes would have been collected if a pre-specified procedure had been developed, which was initially not possible due to a lack of previous research studies on the topic. Second, it is also acknowledged that these fieldnotes are reflective of a small subset of neuropathic pain patients treated with SCS. Thus, the generalizability of our classification and coding system could be improved by incorporating the perspectives of a larger number of participants suffering from various pain conditions. Third, only a single evaluator collected and coded the fieldnotes. The extent to which the identified the presence of evaluator bias will be evaluated in a planned follow-up study. This broad study will use current findings to elaborate a qualitative component through directed and open-ended questions during QST’s usual waiting period.
Conclusion
In this study, we presented qualitative fieldnotes of sensory abnormalities collected during an independent QST study. Our findings have highlighted the importance of qualitative data for sensory and pain assessment. Accordingly, we have proposed a classification system and an interview guide as a qualitative approach which could be added to the traditional QST. With this qualitative method, we go beyond side-to-side comparisons between two contralateral areas and present complementary ways of identifying sensory abnormalities. To address potential issues with classifying, collecting, and integrating the qualitative component to the QST procedure, our team will set up a private forum in collaboration with the Sensory Evaluation Network. If you are an expert in the field of quantitative or qualitative sensory testing and would like to take part in these projects, please contact our project manager ([email protected]).
Acknowledgments
For their cooperation, the authors would like to thank the 48 participants included in this study. The authors are also grateful to the anonymous reviewers who helped strengthen this manuscript.
Disclosure
JV has received consultancy fees from Casquar GmbH, Bochum, Germany, unrelated to this manuscript and reports consultancy fees from Vertex Pharmaceuticals, outside the submitted work. The authors report no other potential conflicts of interest for this work. The deidentified fieldnotes are shared in Supplementary Tables 1–5. The abstract for this paper was presented at the 2021 Canadian Pain Society Annual General Meeting.41
References
1. Jackson T, Thomas S, Stabile V, Han X, Shotwell M, McQueen K. Prevalence of chronic pain in low-income and middle-income countries: a systematic review and meta-analysis. Lancet. 2015;385(Suppl 2):S10. doi:10.1016/s0140-6736(15)60805-4
2. Institute of Medicine Committee on Advancing Pain Research C, Education. The National Academies Collection: Reports funded by National Institutes of Health. Relieving Pain in America: A Blueprint for Transforming Prevention, Care, Education, and Research. National Academies Press (US) 2011, National Academy of Sciences; 2011.
3. Finnerup NB, Haroutounian S, Kamerman P, et al. Neuropathic pain: an updated grading system for research and clinical practice. Pain. 2016;157(8):1599–1606. doi:10.1097/j.pain.0000000000000492
4. Scholz J, Finnerup NB, Attal N, et al. The IASP classification of chronic pain for ICD-11: chronic neuropathic pain. Pain. 2019;160(1):53–59. doi:10.1097/j.pain.0000000000001365
5. Treede RD, Rief W, Barke A, et al. Chronic pain as a symptom or a disease: the IASP classification of chronic pain for the international classification of diseases (ICD-11). Pain. 2019;160(1):19–27. doi:10.1097/j.pain.0000000000001384
6. Lundy-Ekman L. Chapter 3: neurologic disorders and the neurologic examination. In: Neuroscience: Fundamentals for Rehabilitation.
7. Gruener G, Dyck PJ. Quantitative sensory testing: methodology, applications, and future directions. J Clin Neurophysiol. 1994;11(6):568–583. doi:10.1097/00004691-199411000-00004
8. Dyck PJ, Herrmann DN, Staff NP, Dyck PJ. Assessing decreased sensation and increased sensory phenomena in diabetic polyneuropathies. Diabetes. 2013;62(11):3677–3686. doi:10.2337/db13-0352
9. Baron R, Maier C, Attal N, et al. Peripheral neuropathic pain: a mechanism-related organizing principle based on sensory profiles. Pain. 2017;158(2):261–272. doi:10.1097/j.pain.0000000000000753
10. Vollert J, Magerl W, Baron R, et al. Pathophysiological mechanisms of neuropathic pain: comparison of sensory phenotypes in patients and human surrogate pain models. Pain. 2018;159(6):1090–1102. doi:10.1097/j.pain.0000000000001190
11. Vollert J, Maier C, Attal N, et al. Stratifying patients with peripheral neuropathic pain based on sensory profiles: algorithm and sample size recommendations. Pain. 2017;158(8):1446–1455. doi:10.1097/j.pain.0000000000000935
12. Rolke R, Baron R, Maier C, et al. Quantitative sensory testing in the german research network on neuropathic pain (DFNS): standardized protocol and reference values. Pain. 2006;123(3):231–243. doi:10.1016/j.pain.2006.01.041
13. Rolke R, Magerl W, Campbell KA, et al. Quantitative sensory testing: a comprehensive protocol for clinical trials. Eur J Pain. 2006;10(1):77–88. doi:10.1016/j.ejpain.2005.02.003
14. Gehling J, Mainka T, Vollert J, Pogatzki-Zahn EM, Maier C, Enax-Krumova EK. Short-term test-retest-reliability of conditioned pain modulation using the cold-heat-pain method in healthy subjects and its correlation to parameters of standardized quantitative sensory testing. BMC Neurol. 2016;16:125. doi:10.1186/s12883-016-0650-z
15. Forstenpointner J, Ruscheweyh R, Attal N, et al. No pain, still gain (of function): the relation between sensory profiles and the presence or absence of self-reported pain in a large multicenter cohort of patients with neuropathy. Pain. 2021;162(3):718–727. doi:10.1097/j.pain.0000000000002058
16. Schmelz M. What can we learn from the failure of quantitative sensory testing? Pain. 2021;162(3):663–664. doi:10.1097/j.pain.0000000000002059
17. Vollert J, Forstenpointner J, Enax-Krumova EK, et al. The need for previous knowledge does not render quantitative sensory testing a “failure” but part of a larger picture of the relationship between nociception and pain. Pain. 2021;162(4):1273–1274. doi:10.1097/j.pain.0000000000002138
18. Heyvaert M, Maes B, Onghena P. Mixed methods research synthesis: definition, framework, and potential. Qual Quant. 2013;47(2):659. doi:10.1007/s11135-011-9538-6
19. Pluye P, Hong QN. Combining the power of stories and the power of numbers: mixed methods research and mixed studies reviews. Annu Rev Public Health. 2014;35:29–45. doi:10.1146/annurev-publhealth-032013-182440
20. Clark VLP. Meaningful integration within mixed methods studies: identifying why, what, when, and how. Contemp Educ Psychol. 2019;57:106–111. doi:10.1016/j.cedpsych.2019.01.007
21. Bordeleau M, Carrondo Cottin S, Cantin L, et al. Effects of tonic spinal cord stimulation on external mechanical and thermal stimuli perception using quantitative sensory testing: a multicenter stimulation ON-OFF study on chronic pain patients. Clin J Pain. 2020;36(3):189–196. doi:10.1097/ajp.0000000000000791
22. Baranowski A, Abrams P, Berger R, et al. Classification of chronic pain, second edition (Revised). International association for the study of pain; 2011. Available from: https://www.iasp-pain.org/PublicationsNews/Content.aspx?ItemNumber=1673.
23. Harden RN, Oaklander AL, Burton AW, et al. Complex regional pain syndrome: practical diagnostic and treatment guidelines, 4th edition. Pain Med. 2013;14(2):180–229. doi:10.1111/pme.12033
24. Ferland CE, Villemure C, Michon P-E, et al. Multicenter assessment of quantitative sensory testing (QST) for the detection of neuropathic-like pain responses using the topical capsaicin model. Canadian J Pain. 2018;2(1):266–279. doi:10.1080/24740527.2018.1525682
25. Leblanc N, Audet MH, Lebrasseur I, Trepanier A. Ca fait mal! Developpement et validation de l’Echelle d’autoevaluation de la qualite de la douleur chez l’enfant au Centre mere-enfant du CHUL [That hurts! Development and validation of a self evaluation scale of pain intensity in the child at the CHUL mother-child center]. Perspective Infirmiere Revue Officielle De l’Ordre Des Infirmieres Et Infirmiers Du Quebec. 2010;7(3):33–36.
26. Thomas DR. A general inductive approach for analyzing qualitative evaluation data. Am J Evaluation. 2006;27(2):237–246. doi:10.1177/1098214005283748
27. Merskey H, Bogduk N. Classification of Chronic Pain, Descriptions of Chronic Pain Syndromes and Definitions of Pain Terms
28. Gebhart GF, Schmidt RF. Encyclopedia of Pain. Springer; 2013. Available from: http://ariane.ulaval.ca/cgi-bin/recherche.cgi?qu=a2334695
29. Vollert J, Kramer M, Barroso A, et al. Symptom profiles in the painDETECT Questionnaire in patients with peripheral neuropathic pain stratified according to sensory loss in quantitative sensory testing. Pain. 2016;157(8):1810–1818. doi:10.1097/j.pain.0000000000000588
30. Agbaje J, De Laat A, Constantinus P, Svensson P, Baad-Hansen L. Agreement between quantitative and qualitative sensory testing of changes in oro-facial somatosensory sensitivity. J Oral Rehabil. 2017;44(1):30–42. doi:10.1111/joor.12455
31. Baad-Hansen L, Pigg M, Ivanovic SE, et al. Intraoral somatosensory abnormalities in patients with atypical odontalgia–a controlled multicenter quantitative sensory testing study. Pain. 2013;154(8):1287–1294. doi:10.1016/j.pain.2013.04.005
32. Mustonen L, Vollert J, Rice ASC, Kalso E, Harno H. Sensory profiles in women with neuropathic pain after breast cancer surgery. Breast Cancer Res Treat. 2020;182(2):305–315. doi:10.1007/s10549-020-05681-8
33. Kothari SF, Shimosaka M, Iida T, et al. Quantitative and qualitative assessment of sensory changes induced by local anesthetics block of two different trigeminal nerve branches. Clin Oral Investig. 2019;23(6):2637–2649. doi:10.1007/s00784-018-2695-4
34. Pillai RS, Pigg M, List T, et al. Assessment of somatosensory and psychosocial function of patients with trigeminal nerve damage. Clin J Pain. 2020;36(5):321–335. doi:10.1097/ajp.0000000000000806
35. Rivard MJ, Gingras D, Shir Y, Sandilands B. Pain: From Suffering to Feeling Better. Dundurn; 2014.
36. Guetterman TC, Fetters MD. Two methodological approaches to the integration of mixed methods and case study designs: a systematic review. Am Behav Scientist. 2018;62(7):900–918. doi:10.1177/0002764218772641
37. Fetters MD, Freshwater D. The 1+ 1= 3 Integration Challenge. Los Angeles, CA: SAGE Publications Sage CA; 2015.
38. Boterberg S, Warreyn P. Making sense of it all: the impact of sensory processing sensitivity on daily functioning of children. Pers Individ Dif. 2016;92:80–86. doi:10.1016/j.paid.2015.12.022
39. Aron EN, Aron A. Sensory-processing sensitivity and its relation to introversion and emotionality. J Pers Soc Psychol. 1997;73(2):345–368. doi:10.1037/0022-3514.73.2.345
40. Defrin R, Ohry A, Blumen N, Urca G. Sensory determinants of thermal pain. Brain. 2002;125(Pt 3):501–510. doi:10.1093/brain/awf055
41. Gentile E, Bobeuf F, Bendas Aet al. The effects of a physical training intervention on pain, disability and psychological factors in patients with chronic low back pain. Canadian J Pain. 2021;5(2):A48–A137. doi:10.1080/24740527.2021.1914233
 © 2021 The Author(s). This work is published and licensed by Dove Medical Press Limited. The
full terms of this license are available at https://www.dovepress.com/terms
and incorporate the Creative Commons Attribution
- Non Commercial (unported, 3.0) License.
By accessing the work you hereby accept the Terms. Non-commercial uses of the work are permitted
without any further permission from Dove Medical Press Limited, provided the work is properly
attributed. For permission for commercial use of this work, please see paragraphs 4.2 and 5 of our Terms.
© 2021 The Author(s). This work is published and licensed by Dove Medical Press Limited. The
full terms of this license are available at https://www.dovepress.com/terms
and incorporate the Creative Commons Attribution
- Non Commercial (unported, 3.0) License.
By accessing the work you hereby accept the Terms. Non-commercial uses of the work are permitted
without any further permission from Dove Medical Press Limited, provided the work is properly
attributed. For permission for commercial use of this work, please see paragraphs 4.2 and 5 of our Terms.