Back to Journals » Clinical Interventions in Aging » Volume 20
Classification of Elderly Patients with Comorbidities and Their Subtypes: A Data-Driven Cluster Analysis
Authors Qiao X ![]() , Chen X
, Chen X ![]() , Wang W
, Wang W ![]() , Guo L, Pan Q
, Guo L, Pan Q
Received 10 July 2025
Accepted for publication 30 September 2025
Published 3 October 2025 Volume 2025:20 Pages 1671—1680
DOI https://doi.org/10.2147/CIA.S549148
Checked for plagiarism Yes
Review by Single anonymous peer review
Peer reviewer comments 2
Editor who approved publication: Dr Zhi-Ying Wu
Xiuqi Qiao,1,2 Xinda Chen,3 Weihao Wang,1 Lixin Guo,1,2 Qi Pan1,2
1Department of Endocrinology, Beijing Hospital, National Center of Gerontology, Institute of Geriatric Medicine, Chinese Academy of Medical Sciences, Beijing, People’s Republic of China; 2Graduate School of Peking Union Medical College, Chinese Academy of Medical Sciences, Beijing, People’s Republic of China; 3Department of Endocrinology, Beijing Hospital, National Center of Gerontology, Institute of Geriatric Medicine, Beijing, People’s Republic of China
Correspondence: Lixin Guo, Email [email protected] Qi Pan, Email [email protected]
Background: To explore the precise classification of elderly patients with multimorbidity and identify subgroups with an increased prevalence of related diseases.
Methods: A data-driven clustering analysis (K-means clustering) was conducted on individuals aged 60 years or older with comorbidities. The clustering was based on five essential and routinely measured variables: body mass index (BMI), intrinsic capacity (IC), low-density lipoprotein cholesterol (LDL-c), fasting plasma glucose (FPG), and systolic blood pressure (SBP). Logistic regression models were used to compare the prevalence of diabetes, coronary heart disease, hypertension, osteoporosis, sarcopenia, and frailty among the clusters.
Results: A total of 350 elderly patients with a mean age of 78.74 ± 8.27 years were included. Four subtypes of elderly patients with multimorbidity were identified, with significant differences in disease prevalence observed among the groups. Specifically, cluster 1 included 70 participants who exhibited the highest levels of LDL-c and BMI, as well as relatively higher IC scores. Cluster 2 consisted of 117 participants, who had the highest IC scores among all clusters and similar BMI levels to cluster 1. Cluster 3 included 77 participants and was distinguished by the highest SBP levels. Cluster 4, comprising 86 participants, had the lowest IC and BMI levels. Compared with cluster 2, cluster 4 had significantly higher prevalence of hypertension and frailty. Cluster 3 and 4 had higher prevalence of coronary heart disease compared with cluster 1, and cluster 4 had the highest prevalence of osteoporosis and sarcopenia.
Conclusion: There is significant pathophysiological heterogeneity among individuals with elderly multimorbidity. This classification method provides a crucial foundation for understanding disease complexity in this population. Future research, including intervention studies based on these classifications, is needed to evaluate their potential clinical utility.
Keywords: aged, multimorbidity, clustering analysis, intrinsic capacity
Introduction
Elderly individuals often suffer from multiple chronic comorbidities, have poor organ reserve functions, and low compensatory capabilities, making them susceptible to interactions between various diseases.1 Among older adults in the United States, the prevalence of chronic disease comorbidity is notably high, reaching approximately 77.0%.2 In a similar vein, China reports a substantial prevalence of multimorbidity, with 52.9% of older adults (aged 60 years and above) experiencing multiple chronic conditions.3 The uncertainty of multimorbidity patterns in the elderly poses greater challenges to clinical diagnosis and treatment. Compared to a single chronic disease, multimorbidity in the elderly has adverse effects on patients’ health and quality of life, increases healthcare expenditures, and complicates the management of patients’ health conditions. Currently, clinical practice and scientific research predominantly focus on single diseases or individual systems. However, the combinations of multimorbidities in older adults are highly diverse, and the cumulative effects on the human body resulting from the complex interplay of multiple diseases cannot be effectively managed by simply superimposing several individual medical decisions.
The intrinsic capacity (IC) framework, initially proposed by the World Health Organization, was introduced in 2017 through a publication, which recommend screening for cognition, vitality (nutrition), mobility, depression, and sensory.4,5 The five domains of IC were utilized to predict participation patterns among older adults, thereby shifting the focus from merely the absence of disease to a more holistic paradigm of healthy aging that emphasizes functional ability. To implement personalized treatment, it is crucial to reclassify older adults with multimorbidity, enabling precise and effective interventions for those at the highest risk. Several studies have explored data-driven classifications of IC in older adults. Justin et al6 and Reshma et al7 analyzed the relationships between different clusters and IC, but none of these studies have linked the classifications to disease outcomes. This study aims to explore whether the assessment of IC and common metabolic parameters supports the classification of multimorbidity in older adults, and whether there are differences in disease prevalence among different classifications, providing a reference for personalized intervention.
Methods
Study Design and Population
This cross-sectional study examines IC among elderly patients aged 60 years and older at Beijing Hospital in China from November 2020 to December 2023. Participants were included if they met the following criteria: (1) aged 60 years or older and (2) diagnosed with at least two of the chronic diseases. We excluded individuals who were wheelchair-bound, bedridden, or had mental illnesses. Individuals with incomplete measurement data were excluded. Ultimately, a total of 350 participants were included in the final analysis (Figure 1). Ethical approval for this study was obtained from the Medical Ethics Committee of Beijing Hospital (Approval number: 2024BJYYEC-KY083-02). This study was conducted in compliance with the principles of the Declaration of Helsinki (2013 revision). Given the retrospective nature of this study and the maintenance of patient anonymity, a waiver for informed consent was granted.
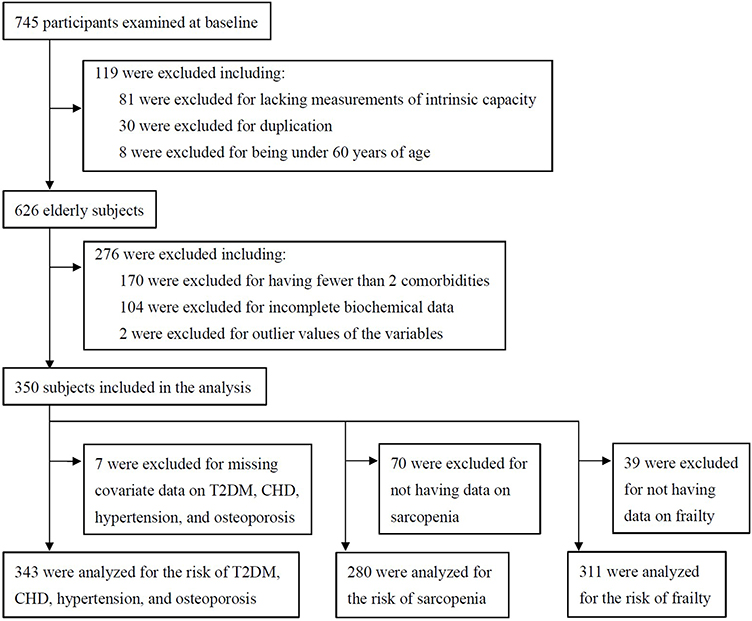 |
Figure 1 Flowchart of participant selection. T2DM, type 2 diabetes mellitus; CHD, coronary heart disease. |
Measurements of Intrinsic Capacity
We employed the IC framework, which was originally proposed by the World Health Organization.4 The IC score is constructed as follows: each domain has a maximum score of 2 points, with declines in each domain calculated as either 0 or 1 point. The total IC score is determined by summing the scores across the five domains, with higher scores indicating greater IC in older adults.8
Cognitive status was evaluated using the Mini-Mental State Examination (MMSE), with scores below 27 indicating abnormal cognition.9 For vitality, the Mini Nutritional Assessment Short-Form (MNA-SF) was applied, where a score of ≥12 signifies good nutritional status.10 Mobility was assessed using the Short Physical Performance Battery (SPPB), which included a 4-meter walking speed test, a standing balance test, and a repeated chair rise test.11 Depressive symptoms were identified using the Geriatric Depression Scale-15 (GDS-15), with scores above 4 indicating the presence of depressive symptoms.12 For sensory function, both auditory and visual impairments (0 points), either vision or hearing impaired (1 point), or both normal (2 points).
Data Collection
General demographic information, questionnaires, and scales were collected via face-to-face interviews conducted by uniformly trained nurses. Smoking status was determined using a standardized question: “Do you still smoke or have you completely quit smoking?” Participants who answered “still smoke” were defined as smokers. Alcohol consumption was defined as drinking more than once a month. Blood pressure was measured three times using a digital sphygmomanometer (Omron), after at least 5 minutes of rest in a seated position. Grip strength was assessed using the Leaping HealthTM WL-1000 dynamometer. Participants held the device at a 90° angle and squeezed as hard as possible, with two measurements taken for each hand to determine the maximum grip strength. Additionally, we collected data on results of routine blood tests, lipid profiles, and biochemical analyses using calibrated instruments.
Diagnostic information about patients was collected through the hospital’s electronic medical record system. Our study encompassed a range of diseases identified using the International Classification of Diseases, 10th Revision (ICD-10) codes, including osteoporosis (M80, M80.091, M80.191, M80.591–M81.191, M81.5, M81.591–M81.992), diabetes (E10.001–E10.161, E10.733–E11.151, E11.733, E11.901, E13.2521–E14.151, E14.733, E14.901), hypertension (I10xx01–I10xx29, I15.001–I15.901), coronary heart disease (I24.803, I25.105–I25.231, I25.601), sarcopenia (M62.504), and frailty (R68.802). Sarcopenia was diagnosed according to the AWGS 2019 criteria.13 Frailty was assessed using the Clinical Frailty Scale-09 (CFS-09), with participants classified as frail if scoring ≥5.14 Comorbidity was defined as the presence of two or more concurrent chronic conditions in an individual.15
Statistical Analysis
Key clinical variables were selected based on the following criteria: (1) Essential for characterizing comorbidities; (2) Routinely measured in clinical practice; (3) Easily interpretable and having clear physiological significance. Additionally, a smaller number of variables were chosen to enhance the generalizability of the classification model. Variables included in the cluster analysis were body mass index (BMI), IC, low density lipoprotein cholesterol (LDL-c), fasting plasma glucose (FPG), and systolic blood pressure (SBP). Cluster analysis was performed on standardized values (mean = 0, standard deviation = 1). Participants with extreme outliers (absolute standardized values > 5) were excluded from subsequent analyses.
A two-stage clustering approach was employed. In the first stage, consensus clustering analysis using the K-means algorithm was performed on 100 random subsamples to determine the optimal number of clusters.16,17 The optimal number of clusters was selected based on consensus matrix heatmaps, cumulative distribution function (CDF) plots, and consensus scores. In the second stage, patients were assigned to seven clusters using the fpc package (runs = 100) for K-means clustering. Clusters were considered stable when the Jaccard similarity index exceeded 0.75.18 Logistic regression analysis was conducted to examine the relationship between comorbidities and participation clusters, with results presented as odds ratios (OR) and 95% confidence intervals (CI). All statistical analyses were performed using R version 4.4.2, with significance set at P < 0.05.
Results
Baseline Characteristics
A total of 350 elderly patients with a mean age of 78.74 ± 8.27 years were included. Among them, 176 (50.3%) were female and 174 (49.7%) were male. Overall, the mean BMI for the entire cohort was 23.62 ± 4.04kg/m2, and the total IC score was 5.35 ± 2.59. The prevalence of diabetes, coronary heart disease, hypertension, and osteoporosis was 67.9%, 76.4%, 96.2%, and 75.2%, respectively. Sarcopenia and frailty were present in 22.1% and 57.9% of the participants, respectively.
Cluster Analysis
Through the visualization of consensus matrices, CDFs, and the relative increase in the area under the CDFs, the consensus clustering algorithm determined that K = 4 clusters optimally captured the data patterns of elderly participants with comorbidities (Supplementary Figure 1). We applied K-means clustering to the entire cohort of elderly participants, with cluster stability assessed via Jaccard similarity indices exceeding 0.76 for the four clusters. The cluster centers determined by K-means clustering of the analysis datasets are provided in Supplementary Table 1. Baseline characteristics of study participants in four clusters is shown in Table 1.
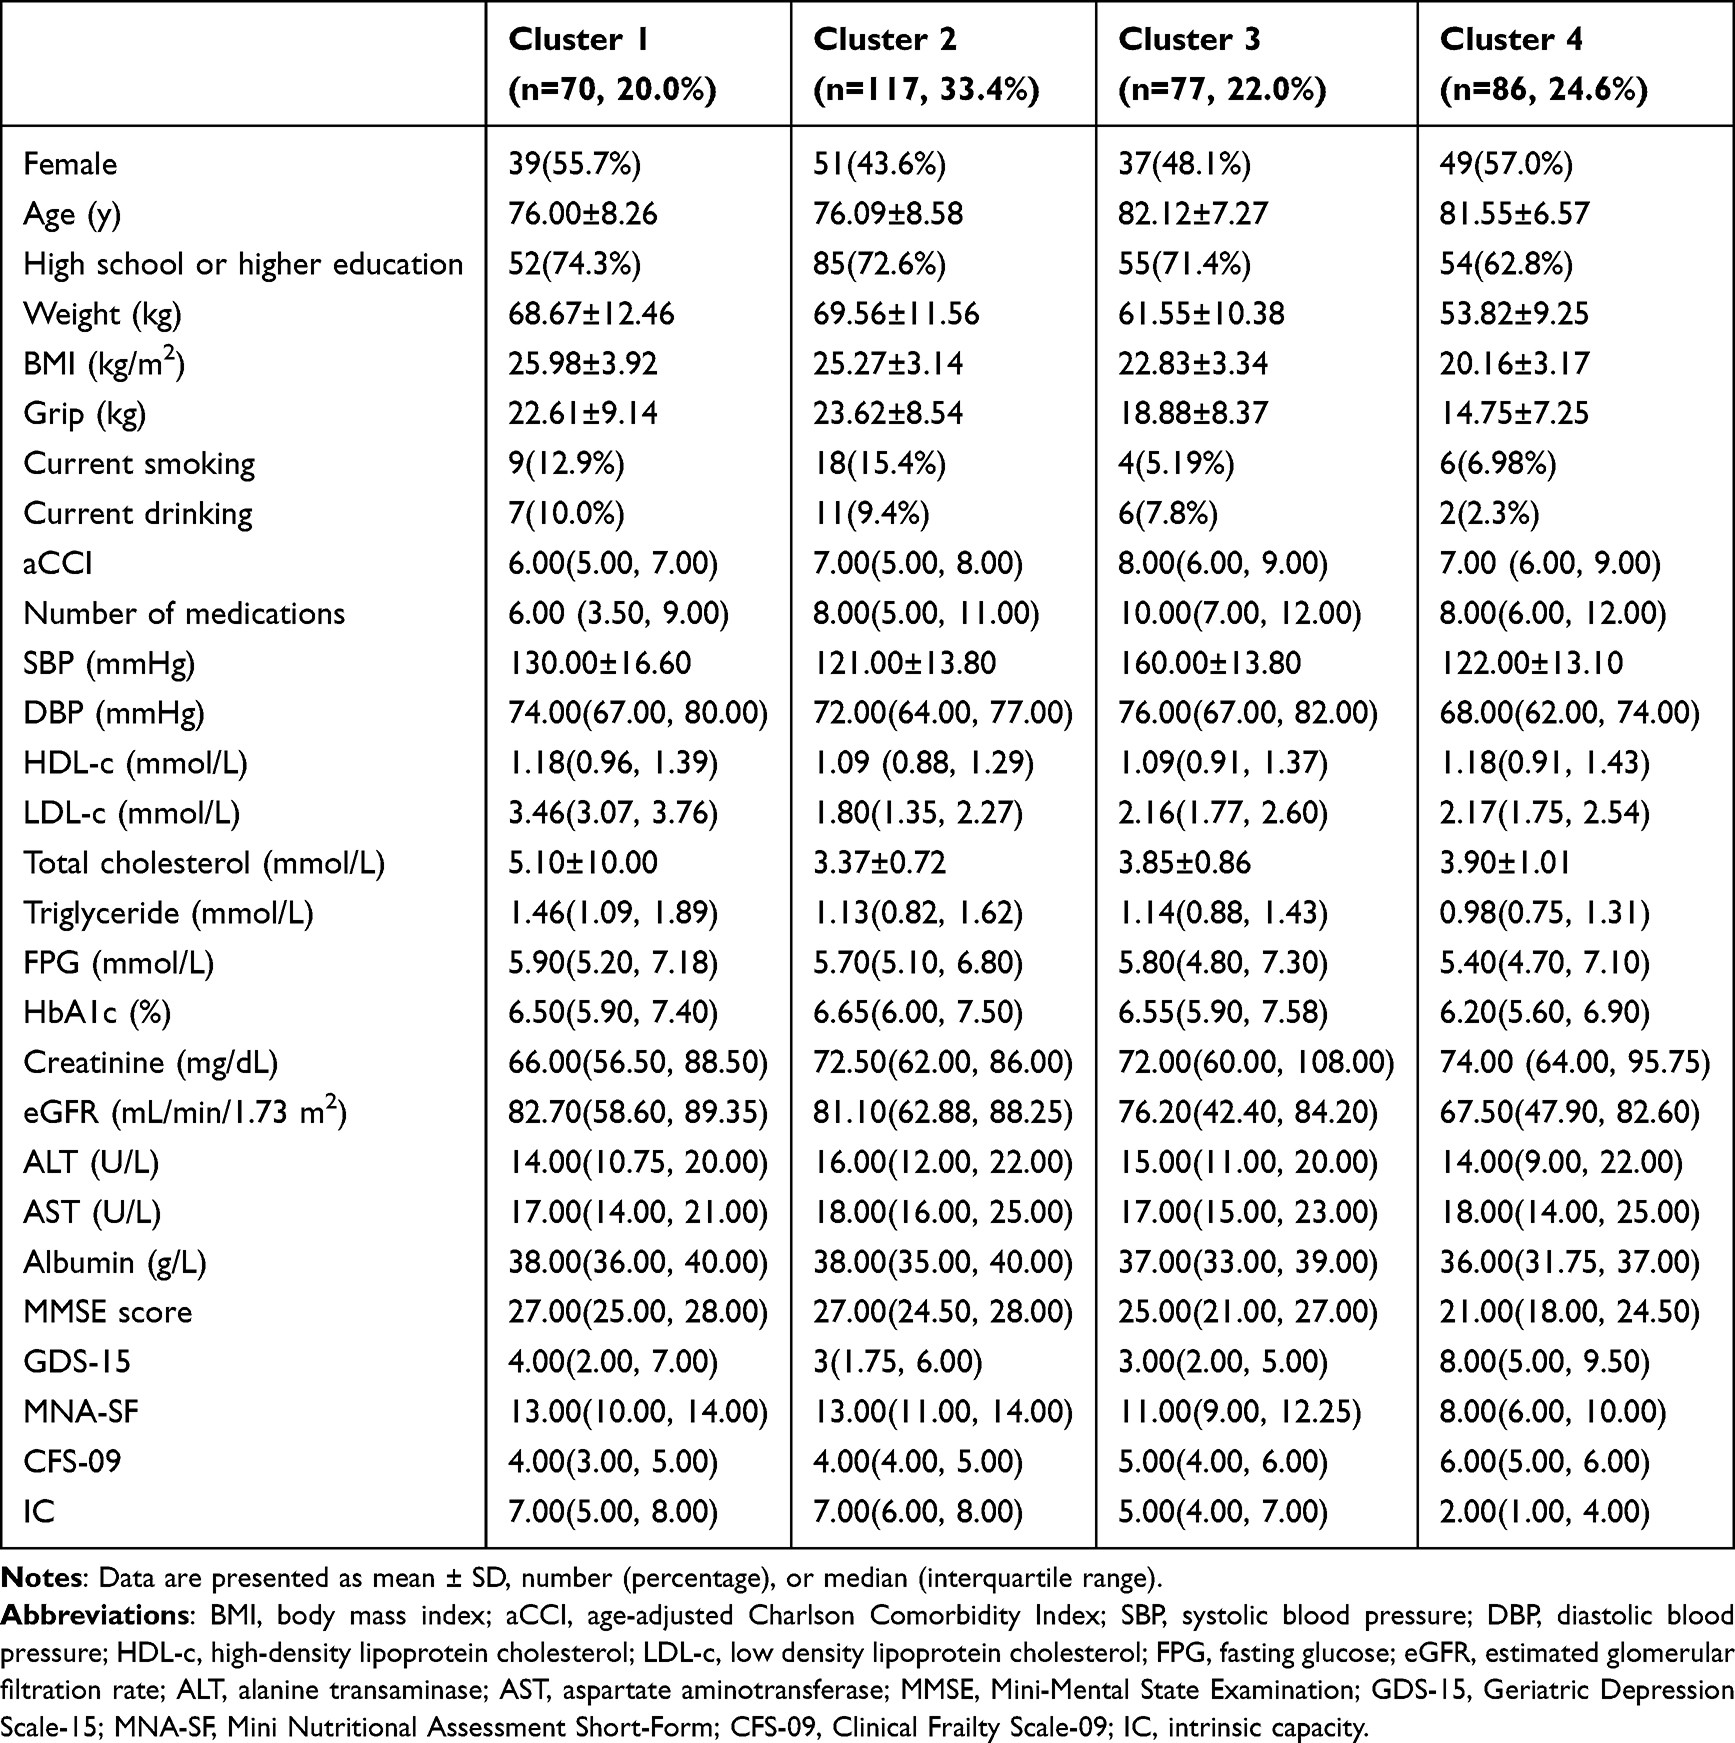 |
Table 1 Baseline Characteristics of Study Participants in Four Clusters |
As is shown in Figures 2 and 3, cluster 1, with 70 participants (20.0%), exhibited the highest levels of LDL-c and BMI, along with relatively higher IC scores. Cluster 2 included 117 participants (33.4%), who had the highest IC scores among all clusters, similar BMI levels to Cluster 1, but the lowest LDL-c and SBP. Cluster 3 consisted of 77 participants (22.0%) and was distinguished by the highest SBP levels, though other features were relatively lower. Cluster 4, comprising 86 participants (24.6%), had the lowest IC and BMI levels, along with relatively lower SBP.
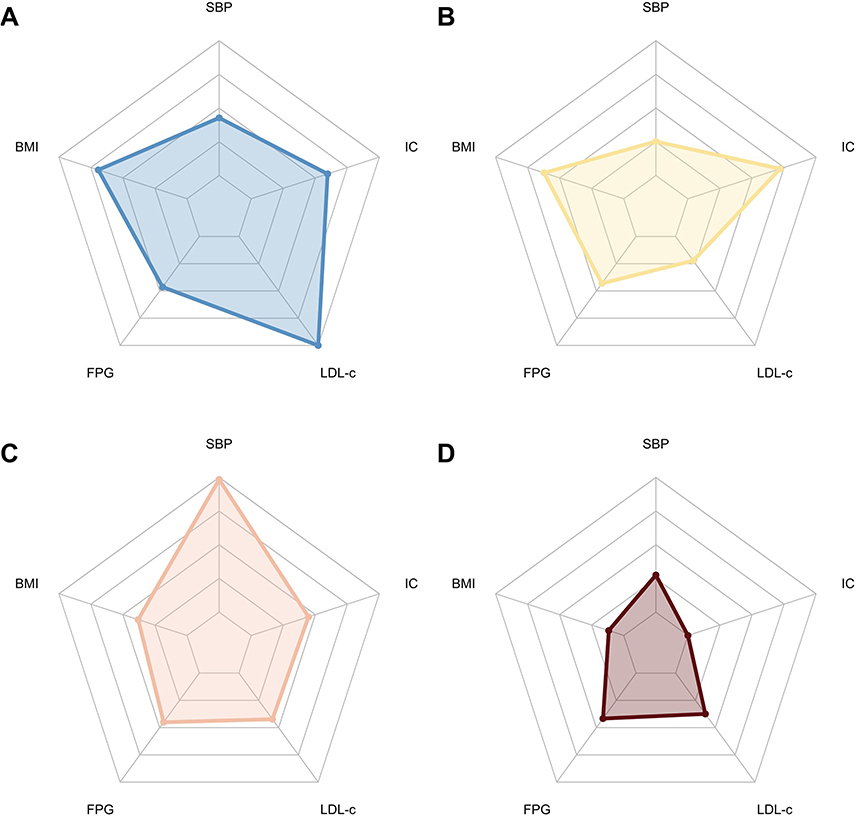 |
Figure 2 Distribution of the cluster feature variables by clusters. (A) Cluster 1; (B) Cluster 2; (C) Cluster 3; (D) Cluster 4. Abbreviations: BMI, body mass index; SBP, systolic blood pressure; IC, intrinsic capacity; LDL-c, low density lipoprotein cholesterol; FPG, fasting plasma glucose. |
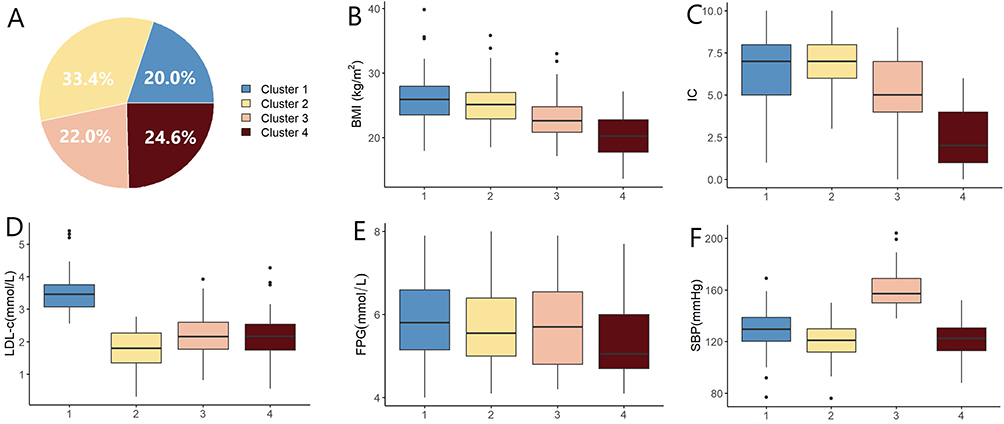 |
Figure 3 Characteristics of the subjects clustered using K-means. (A) Distribution of 4 clusters; (B) Comparison of 4 clusters in BMI; (C) Comparison of 4 clusters in IC; (D) Comparison of 4 clusters in LDL-c; (E) Comparison of 4 clusters in FPG; (F) Comparison of 4 clusters in SBP. Abbreviations: BMI, body mass index; SBP, systolic blood pressure; IC, intrinsic capacity; LDL-c, low density lipoprotein cholesterol; FPG, fasting plasma glucose. |
Associations Between Comorbidity Clusters and Major Diseases
Among the participants, the prevalence of diabetes was 67.9%, coronary heart disease 76.4%, hypertension 96.2%, and osteoporosis 75.2%. Sarcopenia was identified in 22.1% of the participants, while frailty was noted in 57.9%. After adjusting for covariates, we found significant differences in comorbidity prevalence among clusters (Figure 4 and Supplementary Figure 2). Cluster 4 had the highest prevalence of comorbidities, followed by Cluster 3. Relative to Cluster 1, which exhibited the lowest prevalence of coronary heart disease, the ORs for coronary heart disease in Clusters 3 and 4 were 2.49 (95% CI: 1.07–5.99) and 2.54 (95% CI: 1.06–6.21), respectively (model 2). Compared with Cluster 2, Cluster 4 had significantly higher ORs for hypertension (OR: 7.86, 95% CI: 1.04–166.90) and frailty (OR: 6.53, 95% CI: 2.17–21.96) in model 2. Additionally, when compared to Cluster 1, Cluster 4 showed elevated ORs for osteoporosis (OR: 2.74, 95% CI: 1.19–6.60) and sarcopenia (OR: 4.54, 95% CI: 1.79–12.72) in model 1.
 |
Figure 4 Disease prevalence comparisons across clusters. Prevalence of type 2 diabetes, coronary heart disease, hypertension, osteoporosis, sarcopenia, and frailty were compared using logistic regression models. Clusters with the lowest prevalence served as reference groups. Model 1 adjusted for age and gender. Model 2 adjusted for age, gender, education, smoking, drinking, and weight. Abbreviations: OR, odds ratio; CI, confidence interval. |
Discussion
This study categorized elderly patients with multimorbidity into four reproducible clusters, each exhibiting distinct metabolic profiles and disease prevalence. Two of the clusters demonstrated increased prevalence of coronary heart disease: Cluster 3 was characterized by high SBP levels, while cluster 4 was marked by low BMI and low IC levels. Additionally, Cluster 4 was associated with higher prevalence of hypertension, osteoporosis, sarcopenia, and frailty. The clustering method employed in this study was to describe the metabolic heterogeneity among elderly patients with multimorbidity. We utilized variables that are easily measurable and reflective of the metabolic characteristics of this patient population. As a result, this clustering approach can be readily implemented in outpatient settings. The identification of these subtypes suggests potential therapeutic strategies. Cluster 3, with its elevated cardiovascular disease prevalence, may benefit from antihypertensive treatment and lifestyle interventions. Cluster 4, with its higher prevalence of osteoporosis, sarcopenia, and frailty, may benefit from nutritional therapy, physical activity, and lifestyle modifications. Future research could involve intervention studies based on these different subtypes to validate these findings.
In our study, elderly patients with multimorbidity in cluster 1 and cluster 2 exhibited higher levels of IC and BMI, which were associated with a lower prevalence of diseases and frailty. In contrast, cluster 4 had the lowest levels of IC and BMI, and was associated with a higher prevalence of diseases and frailty. Consistent with our findings, several studies have demonstrated that the lowest cardiovascular disease mortality prevalence was observed at a BMI of approximately 28kg/m2, indicating that an optimal BMI for the elderly may fall within the range of overweight or mild obesity.19 Moreover, both higher BMI and higher waist circumference are associated with better survival outcomes in both men and women.20 Elderly individuals with lower BMI are at increased risk of sarcopenia and may tend to be less socially engaged and physically active.20 This sedentary lifestyle can exacerbate the risk of bone loss, fractures, and cognitive decline.
Similar to our findings, previous studies have supported the complementarity between IC and frailty assessments, demonstrating that individuals with low IC levels are more likely to be frail, whereas those with high IC levels are more likely to be robust.6 The IC encompasses five key domains relevant to older adults, including cognition, vitality (nutrition), mobility, depression, and sensory function. Higher scores on these domains collectively indicate a stronger IC in older adults.8 Reduced levels of IC were associated with a greater likelihood of increased dependency and mortality in frail and prefrail individuals, compared to those who were robust.21 The World Health Organization has introduced the Integrated Care for Older People program, which is backed by evidence demonstrating that simple interventions can potentially slow or reverse age-related decline.22 This program aims to enhance health and functioning in older adults and delay the onset of care dependency.
In our study, cluster 3 exhibited the highest levels of SBP and had elevated ORs for coronary heart disease. Research has shown that among older adults, there is a U-shaped association between blood pressure and all-cause mortality.23 The risk of death is minimized when SBP is within the range of 120–129mmHg, the risk of stroke, myocardial infarction and mortality risk significantly increases when SBP rises above 150 mmHg23 SBP under 120 mmHg is correlated with the risk of mortality in the frail oldest old.24 These findings suggest that in older individuals, blood pressure management must strike a balance between cardiovascular protection and the risks associated with excessive blood pressure reduction.
Studies have shown that in older adults, each 1 mmol/L reduction in LDL-c is significantly associated with a 23% lower risk of major vascular events.25 Another meta-analysis involving over 240,000 patients demonstrated that for individuals aged 75 years and older, each 1 mmol/L reduction in LDL-c was linked to a 26% lower risk of major cardiovascular events.26 Importantly, no increased risk of hemorrhagic stroke, new-onset diabetes, cancer, or adverse neurocognitive events was observed.26 Based on the above research findings, it is recommended to actively adopt lipid-lowering therapy in older adults, especially for individuals with higher LDL-c levels or those at risk of cardiovascular disease. In our study, both cluster 1 and cluster 2 exhibited higher levels of IC and BMI, as well as appropriate SBP levels. However, cluster 2 had the lowest levels of LDL-c, while cluster 1 had the highest. This discrepancy may be attributed to cluster 1’s lack of emphasis on lipid-lowering treatment and poor adherence to prescribed therapies. Therefore, for cluster 1, it is essential to prioritize lifestyle modifications and lipid-lowering interventions.
Our study has several limitations. First, the data were derived from a single hospital, and our findings may not be representative of the broader population of elderly patients with multimorbidity in China. Future multi-center, prospective studies are essential to validate our findings, enhance generalizability, and minimize selection bias. Second, the clustering analysis was conducted using only five common variables, and it remains unclear whether incorporating additional variables—such as lifestyle factors, genetic influences, and family history of diseases—would provide any incremental benefits in stratifying subgroups of elderly patients with multimorbidity. While this provided a tractable approach, it necessarily simplifies the intricate and multidimensional nature of multimorbidity patterns. Future studies incorporating a broader range of clinical, functional, social, and molecular variables are warranted. Third, in our study, 67.9% of the participants had diabetes, and there were minimal differences in blood glucose levels across the four clusters. This may be attributed to the fact that glucose measurements were taken while patients were on medication. We did not calculate indices of insulin resistance or secretion based on insulin or C-peptide levels. Therefore, better glucose control does not necessarily reflect the overall disease state of diabetes. Future research could involve intervention studies based on these different subtypes to validate these findings.
Conclusion
The data-driven clustering approach identified four distinct subtypes. Specifically, cluster 4 exhibited the highest prevalence of hypertension, osteoporosis, sarcopenia, and frailty, while clusters 3 and 4 had elevated prevalence of coronary heart disease. These findings suggest that a one-size-fits-all approach may be inadequate for managing multimorbidity in older adults. Our study demonstrates significant heterogeneity among elderly patients with multimorbidity, highlighting the importance of precise classification in understanding disease risk profiles.
Data Sharing Statement
Data will be made available on request.
Ethics Approval and Consent to Participate
Ethical approval for this study was obtained from the Medical Ethics Committee of Beijing Hospital (Approval Number: 2024BJYYEC-KY083-02). This study was conducted in compliance with the principles of the Declaration of Helsinki (2013 revision). Given the retrospective nature of this study and the maintenance of patient anonymity, a waiver for informed consent was granted.
Acknowledgments
An unauthorized version of the Chinese MMSE was used by the study team without permission, however this has now been rectified with PAR. The MMSE is a copyrighted instrument and may not be used or reproduced in whole or in part, in any form or language, or by any means without written permission of PAR (www.parinc.com).
Funding
This work was supported by Capital’s Funds for Health Improvement and Research (2024-1-4053) and CAMS Innovation Fund for Medical Sciences (2021-I2M-1-050).
Disclosure
The authors report no conflicts of interest in this work.
References
1. Boyd C, Smith CD, Masoudi FA, et al. Decision making for older adults with multiple chronic conditions: executive summary for the American geriatrics society guiding principles on the care of older adults with multimorbidity. J Am Geriatr Soc. 2019;67(4):665–673. doi:10.1111/jgs.15809
2. Ornstein SM, Nietert PJ, Jenkins RG, et al. The prevalence of chronic diseases and multimorbidity in primary care practice: a PPRNet report. J Am Board Fam Med. 2013;26(5):518–524. doi:10.3122/jabfm.2013.05.130012
3. Zhao M, He X, Li T, et al. Early-life factors and multimorbidity risk later in older age: evidence based on CHARLS. Gerontology. 2023;69(11):1347–1357. doi:10.1159/000532060
4. World Health Organization. Integrated care for older people: guidelines on community-level interventions to manage declines in intrinsic capacity. 2017. Available from: https://www.who.int/publications/i/item/9789241550109.
5. George PP, Lun P, Ong SP, et al. A rapid review of the measurement of intrinsic capacity in older adults. J Nutr Health Aging. 2021;25(6):774–782. doi:10.1007/s12603-021-1622-6
6. Chew J, Lim JP, Yew S, et al. Disentangling the relationship between frailty and intrinsic capacity in healthy community-dwelling older adults: a cluster analysis. J Nutr Health Aging. 2021;25(9):1112–1118. doi:10.1007/s12603-021-1679-2
7. Merchant RA, Chan YH, Aprahamian I, et al. Patterns of participation restriction among older adults at risk of falls and relationship with intrinsic capacity: a latent cluster analysis. Front Med. 2022;9:1023879. doi:10.3389/fmed.2022.1023879
8. López-Ortiz S, Lista S, Peñín-Grandes S, et al. Defining and assessing intrinsic capacity in older people: a systematic review and a proposed scoring system. Ageing Res Rev. 2022;79:101640. doi:10.1016/j.arr.2022.101640
9. Li H, Jia J, Yang Z. Mini-mental state examination in elderly chinese: a population-based normative study. J Alzheimers Dis. 2016;53(2):487–496. doi:10.3233/JAD-160119
10. Kaiser MJ, Bauer JM, Ramsch C, et al. Validation of the mini nutritional assessment short-form (MNA-SF): a practical tool for identification of nutritional status. J Nutr Health Aging. 2009;13(9):782–788. doi:10.1007/s12603-009-0214-7
11. Gómez JF, Curcio CL, Alvarado B, et al. Validity and reliability of the short physical performance battery (SPPB): a pilot study on mobility in the Colombian andes. Colomb Med. 2013;44(3):165–171. doi:10.25100/cm.v44i3.1181
12. Yesavage JA. Geriatric depression scale. Psychopharmacol Bull. 1988;24(4):709–711.
13. Chen LK, Woo J, Assantachai P, et al. Asian working group for sarcopenia: 2019 consensus update on sarcopenia diagnosis and treatment. J Am Med Dir Assoc. 2020;21(3):300–307.e2. doi:10.1016/j.jamda.2019.12.012
14. Lee JH, Park YS, Kim MJ, et al. Clinical Frailty Scale as a predictor of short-term mortality: a systematic review and meta-analysis of studies on diagnostic test accuracy. Acad Emerg Med. 2022;29(11):1347–1356. doi:10.1111/acem.14493
15. You L, Guo L, Li N, et al. Association between multimorbidity and falls and fear of falling among older adults in eastern China: a cross-sectional study. Front Public Health. 2023;11:1146899. doi:10.3389/fpubh.2023.1146899
16. Zheng R, Xu Y, Li M, et al. Data-driven subgroups of prediabetes and the associations with outcomes in Chinese adults. Cell Rep Med. 2023;4(3):100958. doi:10.1016/j.xcrm.2023.100958
17. Monti S, Tamayo P, Mesirov J, et al. Consensus clustering: a resampling-based method for class discovery and visualization of gene expression microarray data. Machine Learning. 2003;52(1):91–118. doi:10.1023/A:1023949509487
18. Hennig C. Cluster-wise assessment of cluster stability. Comput Stat Data Anal. 2007;52(1):258–271. doi:10.1016/j.csda.2006.11.025
19. Lv Y, Zhang Y, Li X, et al. Body mass index, waist circumference, and mortality in subjects older than 80 years: a Mendelian randomization study. Eur Heart J. 2024;45(24):2145–2154. doi:10.1093/eurheartj/ehae206
20. Lv YB, Liu S, Yin ZX, et al. Associations of body mass index and waist circumference with 3-year all-cause mortality among the oldest old: evidence from a chinese community-based prospective cohort study. J Am Med Dir Assoc. 2018;19(8):672–678.e4. doi:10.1016/j.jamda.2018.03.015
21. Prince MJ, Acosta D, Guerra M, et al. Intrinsic capacity and its associations with incident dependence and mortality in 10/66 dementia research group studies in Latin America, India, and China: a population-based cohort study. PLoS Med. 2021;18(9):e1003097. doi:10.1371/journal.pmed.1003097
22. World Health Organization. Integrated Care for Older People: Guidelines on Community-Level Interventions to Manage Declines in Intrinsic Capacity. Geneva: World Health Organization; 2017.
23. Shoji-Asahina A, Usui T, Tabara Y. U-shaped association between blood pressure and all-cause mortality in older adults: the Shizuoka study. J Hum Hypertens. 2025;39(1):66–71. doi:10.1038/s41371-024-00979-2
24. Ishii T, Tamura K. Blood pressure in the longevous population with different status of hypertension and frailty. Hypertens Res. 2024;47(6):1738–1740. doi:10.1038/s41440-024-01618-6
25. Andersson NW, Corn G, Dohlmann TL, et al. LDL-C reduction with lipid-lowering therapy for primary prevention of major vascular events among older individuals. J Am Coll Cardiol. 2023;82(14):1381–1391. doi:10.1016/j.jacc.2023.07.027
26. Gencer B, Marston NA, Im K, et al. Efficacy and safety of lowering LDL cholesterol in older patients: a systematic review and meta-analysis of randomised controlled trials. Lancet. 2020;396(10263):1637–1643. doi:10.1016/S0140-6736(20)32332-1
 © 2025 The Author(s). This work is published and licensed by Dove Medical Press Limited. The
full terms of this license are available at https://www.dovepress.com/terms
and incorporate the Creative Commons Attribution
- Non Commercial (unported, 4.0) License.
By accessing the work you hereby accept the Terms. Non-commercial uses of the work are permitted
without any further permission from Dove Medical Press Limited, provided the work is properly
attributed. For permission for commercial use of this work, please see paragraphs 4.2 and 5 of our Terms.
© 2025 The Author(s). This work is published and licensed by Dove Medical Press Limited. The
full terms of this license are available at https://www.dovepress.com/terms
and incorporate the Creative Commons Attribution
- Non Commercial (unported, 4.0) License.
By accessing the work you hereby accept the Terms. Non-commercial uses of the work are permitted
without any further permission from Dove Medical Press Limited, provided the work is properly
attributed. For permission for commercial use of this work, please see paragraphs 4.2 and 5 of our Terms.
Recommended articles
Frequency and Correlates of Multimorbidity Among the Oldest Old: Study Findings from the Representative “Survey on Quality of Life and Subjective Well-Being of the Very Old in North Rhine-Westphalia (NRW80+)”
Hajek A, König HH
Clinical Interventions in Aging 2023, 18:41-48
Published Date: 11 January 2023