")
Back to Journals » Diabetes, Metabolic Syndrome and Obesity » Volume 13
Circulating miR-15a and miR-222 as Potential Biomarkers of Type 2 Diabetes
Authors Sadeghzadeh S, Dehghani Ashkezari M, Seifati SM, Vahidi Mehrjardi MY , Dehghan Tezerjani M , Sadeghzadeh S, Ladan SAB
Received 21 May 2020
Accepted for publication 4 August 2020
Published 2 October 2020 Volume 2020:13 Pages 3461—3469
DOI https://doi.org/10.2147/DMSO.S263883
Checked for plagiarism Yes
Review by Single anonymous peer review
Peer reviewer comments 2
Editor who approved publication: Prof. Dr. Antonio Brunetti
Salman Sadeghzadeh,1 Mahmood Dehghani Ashkezari,1 Seyed Morteza Seifati,1 Mohammad Yahya Vahidi Mehrjardi,2,3 Masoud Dehghan Tezerjani,4 Sara Sadeghzadeh,5 Seyed Amir Behtash Ladan1
1Medical Biotechnology Research Center, Ashkezar Branch, Islamic Azad University, Ashkezar, Yazd, Iran; 2Diabetes Research Center, Shahid Sadoughi University of Medical Sciences, Yazd, Iran; 3Department of Genetics, Medical School, Shahid Sadoughi University of Medical Sciences, Yazd, Iran; 4Abortion Research Center, Yazd Institute of Reproductive Sciences, Shahid Sadoughi University of Medical Sciences, Yazd, Iran; 5Department of Physiology, Faculty of Medicine, Shahid Sadoughi University of Medical Sciences, Yazd, Iran
Correspondence: Mahmood Dehghani Ashkezari
Medical Biotechnology Research Center, Ashkezar Branch, Islamic Azad University, Ashkezar, Yazd, Iran
Email [email protected]
Background: In recent years, considerable attention has been paid to the role of microRNAs (miRs) as biomarkers in type 2 diabetes (T2D). The aim of the study was to evaluate the expression levels of miR-15a and miR-222 in diabetic, pre-diabetic, and healthy individuals.
Materials and Methods: Ninety individuals, who were referred to the Yazd diabetic center, were enrolled in this study and then classified into three groups as healthy, pre-T2D, and diabetic based on the clinical manifestations. Real-time PCR was performed to explore miRs expression in the plasma samples of the studied population. The correlation between the biochemical characteristic and the expression of these miRs as well as specificity and sensitivity of different clinical markers in healthy and pre-diabetic groups was evaluated.
Results: miR-222 expression was significantly upregulated in the pre-T2D cases compared to the control subjects (P< 0.001), while no significant difference was found between the pre-T2D and T2D groups (P< 0.05). The expression of miR-15a was statistically downregulated in the pre-T2D and T2D subjects (P< 0.05). The receiver operating characteristic (ROC) curve analysis of miR-15a expression with a cutoff point of 1.12 resulted in the area under the curve (AUC) of 85% (95% CI 0.865– 0.912; P< 0.001) with 84% and 85% sensitivity and specificity, respectively. Similarly, for miR-222, the cutoff point of 4.03 and AUC of 86% (95% CI 0.875– 0.943; P< 0.001) discriminated against the pre-T2D and control subjects via the sensitivity and specificity of 86% and 87%, respectively. Moreover, miR-15a values showed a negative correlation with FG (R=− 0.32, P=0.005); however, miR-222 values were positively correlated with FG (R=0.25, P=0.03) in the pre-T2D group. Furthermore, miR-222 values were correlated with OGTT in the pre-T2D group (R=0.27, P=0.001). In addition, LDL-C had a negative correlation with miR-222 values in the pre-T2D group (R=− 0.23, P=0.02).
Conclusion: This study indicated that the plasma expression levels of miR-222 and miR-15a can be considered as non-invasive, fast tools to separate the pre-T2D individuals from their healthy counterparts. Accordingly, this information could be used to predict the development of the disease as well as a direction for optimal therapy, thus refining outcomes in patients with diabetes.
Keywords: type 2 diabetes, miR-15a, miR-222, biomarker, gene expression
Introduction
Type 2 diabetes (T2D) is a common disease that has an increased prevalence rate over the past years as a result of genetic predisposition and lifestyle alterations such as the reduced physical activities and the increased consumption of high-calorie foods.1 Currently, T2D affects approximately 380 million individuals, which is expected to reach 592 million by 2035.2,3 Based on the international federation of diabetes atlas, the Middle East and North Africa have the highest prevalence rates of diabetes (10.9%).4 In 2015, about 85% of 30,202 diabetic patients referring to the university-affiliated adult diabetes clinics were diagnosed with T2D. Also, despite the broad availability of medications in Iran, the frequencies of some diabetes complications like chronic vascular problems are relatively high among T2D individuals.5
miRs are included in a class of small non-coding small RNAs including 21–25 nucleotides that regulate the expression of various genes by playing a significant role in several biological and pathological processes.6 Numerous studies have proven the expression of miRs in various tissues and cell types using a tissue-specific expression pattern.7 Furthermore, the roles of miRs in the regulation of metabolic pathways have been well documented in which they play crucial roles in adipocyte differentiation, energy homeostasis, lipid metabolism, glucose-induced insulin secretion, and inflammation.8 Therefore, any dysregulation in miRs expression could affect several important cellular functions such as cell cycle regulation, apoptosis, differentiation, and maintenance of the immune system cell, which consequently affect health and disease development.9 Alteration in miRs is connected to the development, diagnosis, and prognosis of different diseases such as various cancers,10,11 metabolic,12 and cardiovascular diseases.13,14
Nowadays, the individuals at risk of developing T2D are recognized through testing the readily accessible serum factors such as their levels of glucose, cholesterol, lipoproteins triacylglycerol, and HbA1c. Furthermore, several physical and lifestyle characteristics including BMI, waist-to-hip ratio, blood pressure, sex, food consumption, physical inactivity, and smoking can be also utilized to assess the risk of the developed T2D.15 Although biomolecules such as cytokines, adipokines, ferritin, and C reactive protein have been addressed as novel biomarkers that are potentially beneficial, their predictive values are similar to the classic ones.16,17 Besides, neither classic nor novel biomarkers can efficiently predict the T2D emergence.18 The application of miRs as biomarkers were firstly proposed for recognizing different types of cancers19,20 and autoimmune diseases.21
In case of T2D, different population-based studies have found a close association among different miRs with T2D and its complications.22–24 The first study suggesting a blood miRs signature was conducted by Zampetaki et al through evaluating plasma samples. Accordingly, in this study, they identified a subset of five miRs (miR-29b, miR-28-3p, miR-223, miR-15a, and miR-126) that demonstrated a dysregulation in 80 pre-diabetic or in participants with type 2 diabetes.25 Subsequently, miRs profiling was performed by Kong et al who discovered an elevation in the expression of seven miRs (miR-146a, miR-30d, miR-29a, miR-124a, miR-34a, miR-9, and miR-375) in T2D cases compared to those who were susceptible to T2D.26 Karolina et al assessed the miRNAs of the whole blood of T2D patients and detected an increase in their miR-192, miR-150, miR-27a, miR-375, and miR-320a levels. Moreover, they also observed a strong association between the elevated fasting levels of glucose and the increment in levels of miR-320a and miR-27a.27 These pioneering studies additionally justified the prospective of miRs as biomarkers for T2D. Afterward, different experiments have suggested various miRs such as miR-126 and miR-23a, as potential biomarkers of T2D in general population.17,28
In this context, the current study was aimed to assess the expression levels of miR-222 and miR-15a in healthy, pre-diabetic, and diabetic individuals to examine the applicability of circulating levels of the aforementioned miRs, as biomarkers, to calculate the risk of the T2D development.
Materials and Methods
Patients
Ninety individuals aged between 35 and 80 years old were enrolled by Yazd Diabetes Research Center. Afterward, they were equally classified into 3 groups as follows: healthy (fasting glucose (FG), ≤5.4 mmol/L, oral glucose tolerance test (OGTT) as 2-h post-load glucose (2hPG), <7.8 mmol/l); pre-T2D (FG, 5.4–6.9mmol/L; 2hPG 7.8–11.0 mmol/l); and diabetes (FG, ≥7.0mmol/L; 2hPG >11.1 mmol/l) groups.29 An informed written consent form was attained from all the individuals before participating in this research. The study procedure was approved by the ethics committee of the Shahid Sadoughi Medical University (Ethics code: IR.SSU.SPH.REC.1397.028) in terms of the declaration of Helsinki.30 Control subjects had a body mass index (BMI) <30 kg/m2, had no background of diabetes and were not on medications disturbing glucose metabolism. Moreover, the exclusion criteria were as follows: consumption of anti-diabetic medication; systemic acute or chronic inflammatory diseases; acute respiratory infection; being under physical treatment; history of malignancy and liver cirrhosis; body mass index (BMI) higher than 40 kg/m2; and diabetic complications including retinopathy, nephropathy, and cardiovascular diseases. Also, standardized methods were applied for anthropometric values including weight (kg) and height (m). Body mass index (BMI) was then measured as [weight (kg)/(height)2 (m)2].
Biochemical Analysis
Venous blood samples were collected from all the studied subjects after 8 h of fasting, which were then handled for biochemical and molecular investigations. For plasma preparation, 2 mL blood was acquired on EDTA-containing tubes followed by centrifugation at 1000 × g for 5 min. Fasting and plasma glucose levels were measured using routine laboratory tests. Subsequently, glycated hemoglobin (HbAlc), total cholesterol (TC), triglycerides (TG), high-density lipoprotein cholesterol (HDL-C), and low-density lipoprotein cholesterol (LDL-C) were measured as previously reported.31
Plasma Preparation and RNA Isolation
Circulating miRs were purified from the plasma samples acquired using an EDTA-containing blood tube. Also, venous blood samples of the subjects were taken and then stored on ice until centrifugation. Afterward, to detach the plasma from the buffy coat fractions and the erythrocytes, the samples were instantly centrifuged at 2.000×g for 10 min at 4°C. Subsequently, the supernatant phase (the plasma) was carefully removed and stored at −80°C until further analyses. The plasma samples were then thawed on ice and 500 μL of each one of these plasma samples was removed for RNA extraction. Next, GeneAll kit (General Biosystems, Seoul, Korea) was utilized to extract total RNA including long ncRNA and small ncRNA in terms of the manufacturer’s instruction.
CDNA Synthesis and Real-Time qPCR Assay
The contamination content was measured by the A260/A280 ratio using a Nanodrop spectrophotometer (Thermo Scientific, Wilmington, USA). Afterward, 10 μL of RNA was added to each reaction. miRs were reversely transcribed using the TaqMan MicroRNA Reverse Transcription Kit (Thermo Scientific,) in terms of the manufacturer’s manual. Relative expression was calculated by the 2ΔΔCt method where SNORD47 was utilized as the housekeeping gene. Primer sequences of miR-15a, miR-222, SNORD47 were 5-TAGCAGCACATAATGGTTTGTG-3, 5-CTCAGTAGCCAGTGTAGATCCT-3, and 5-ATCACTGTAAAACCGTTCCA-3, respectively. Also, universal reverse primers were purchased from the Bonyakhte company (Bonyakhte, Tehran, Iran). In addition, RT-PCR was accomplished using 7 μL of SYBR green PCR Master Mix (Applied Biosystems) and 0.5 μL of primers, 5 μL of cDNA (100 ng/μL), 7 μL of RNAse free water for each one of the reactions with 20 μL of a final volume. RT-PCR reactions included an initial denaturation for 10 min at 94°C, followed by 40 cycles of denaturation for 30 s at 94°C, annealing, and extension for 30 s at 60°C. The melting curve was then considered by increasing the temperature from 75°C to 95°C to assure that no primer dimers or undesirable genomic DNA were amplified. All the reactions were conducted in triplicates on 48-well plates (Applied Biosystems, Step One Plus, USA).
Statistical Analysis
Characteristics of the studied subjects were reported as mean ± standard deviation (SD). Pearson’s correlation analysis was also used to compare the differences among logarithmically transformed clinical values (FG, OGTT, TG, HDL, LDL, and HbA1c) and miRs expressions. miR expression values showed a normal distribution as established by the Shapiro–Wilk test. Moreover, one way-ANCOVA test was applied to compare the adjusted means of miRs expressions among the three groups. Statistical analysis was conducted using IBM SPSS Statistics, version 19 (IBM Corp, Armonk, NY, USA) at a statistical significance level of P-value <0.05. ROC curves and the area under the ROC curve (AUC) were constituted to assess the stratification capability of plasma miRs. In terms of the ROC analysis, the best statistical cutoff amounts of plasma miRs were computed, and the sensitivity and specificity were then measured for particular cutoff points. AUCs were also calculated for other clinical features as shown in Table 1.
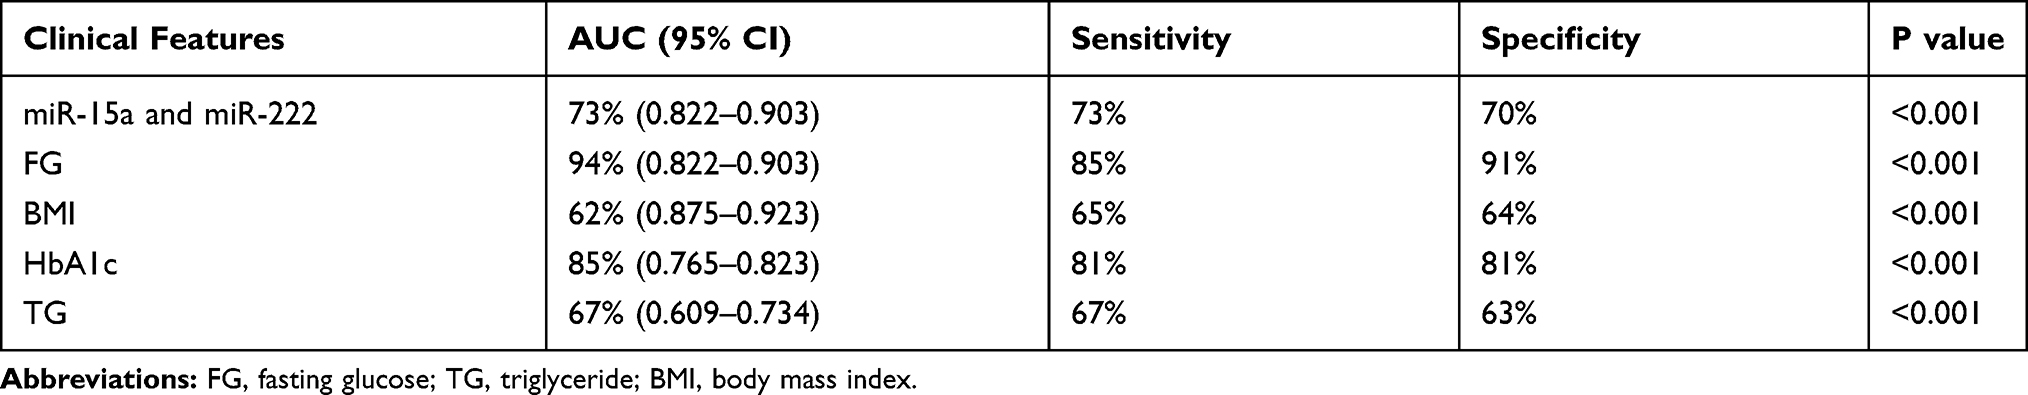 |
Table 1 AUCs, Specificity and Sensitivity of Different Clinical Markers Between Healthy and Pre-Diabetic Groups. Comparison Has Been Performed Between Healthy and Pre-Diabetic Group |
Results
Table 2 shows the clinical and biochemical parameters of the studied individuals. In this regard, no significant differences were found in the age, sex, BMI, and lipids profile of the studied participants. While HbA1c and FG were significantly higher in the T2D patients as compared to the healthy and pre-T2D individuals (P<0.001). As shown in Table 3, miR-15a values indicated a negative correlation with FG (R=−0.32, P=0.005), while miR-222 values were positively correlated with FG (R=−0.25, P=0.03) in the pre-T2D group. Moreover, miR-222 values were correlated with OGTT in the pre-T2D group (R=0.27, P=0.001). Also, LDL-C had a negative correlation with miR-222 values in the pre-T2D group (R=−0.23, P=0.02).
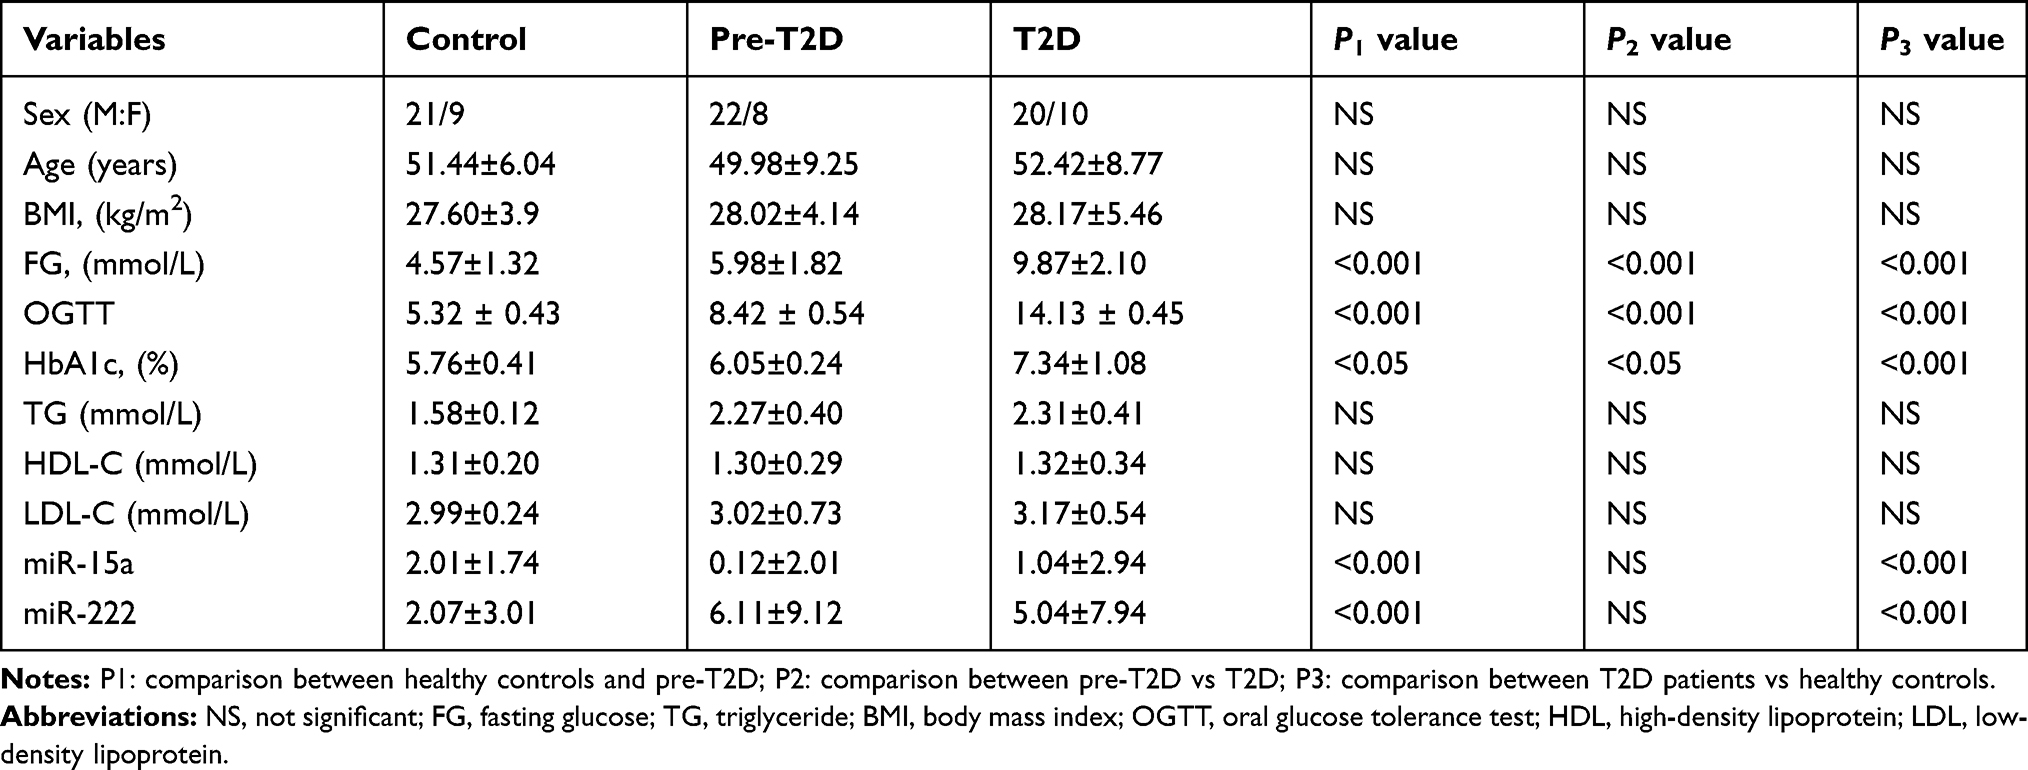 |
Table 2 Clinical and Biochemical Characteristics of the Studied Individuals |
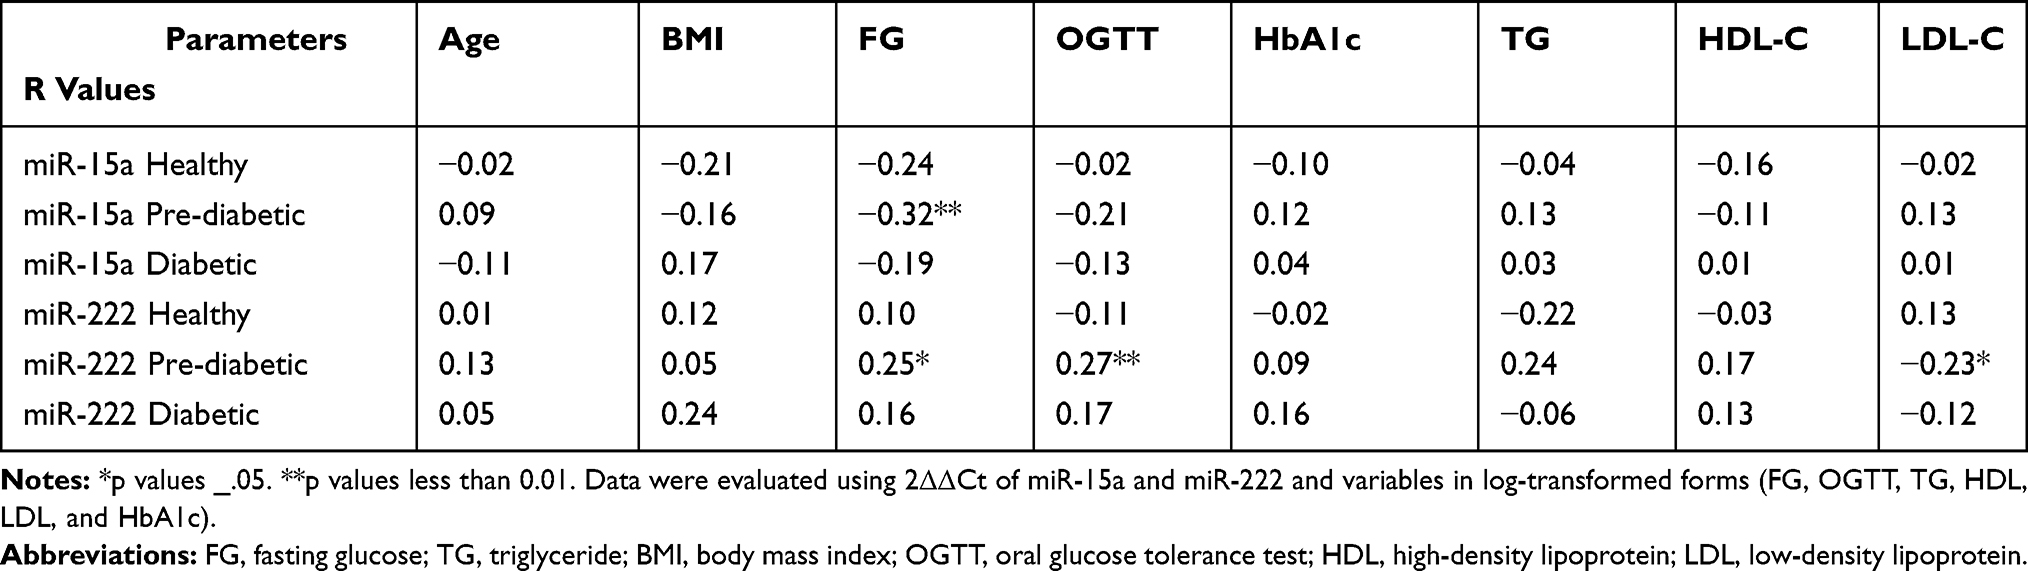 |
Table 3 Correlation (R Values) Between the Clinical and Biochemical Characteristics with miR-15a and miR-222 |
According to Figure 1, miR-15a expression was remarkably downregulated in the plasma samples obtained from the pre-T2D and T2D (P<0.001) cases compared to the control subjects. However, no significant difference was found between the pre-T2D and T2D group (P<0.05). Likewise, the difference in the expression of miR-222 was also statistically significant among these three groups. miR-222 expression was found to be higher in the T2D and pre-T2D in comparison with the healthy group (P<0.001), while it was no statistically significant difference between the T2D and pre-T2D groups (P<0.05).
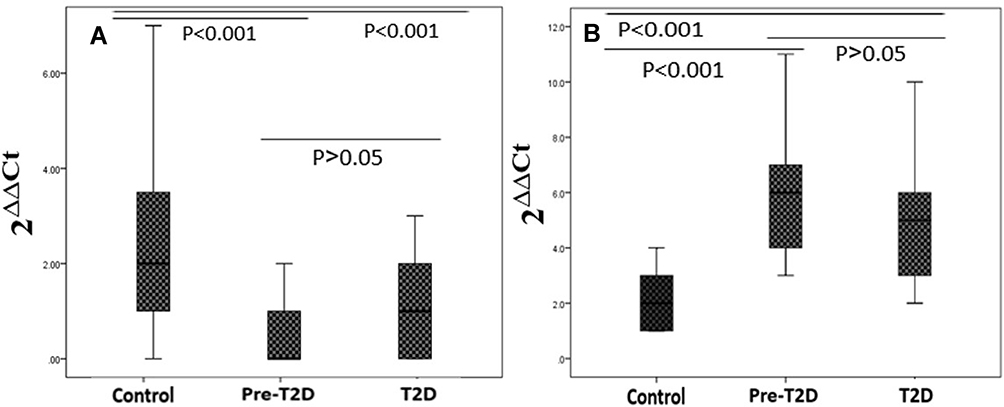 |
Figure 1 Relative expression of (A) miR-15a and (B) miR-222. Data are represented as median (interquartile range). One way-ANCOVA test was applied to compare the adjusted means of miRs expression among three groups. Data are depicted by box-and-whisker plots. Boxes indicate the 25th and 75th percentiles, with a solid line within the box that indicates the median. |
The diagnostic assessment of miR-15a and miR-222 expressions was conducted based on the AUC, specificity, and sensitivity by drawing the ROC curve. To discriminate against the healthy individuals from the pre-T2D subjects, in the case of miR-15a, the optimal cutoff point was 1.12 with 85% (95% CI 0.865–0.912; P<0.001), 84%, and 85% of AUC, sensitivity, and specificity, respectively. Concerning miR-222, the optimal cutoff point of 4.03 and AUC of 86% (95% CI 0.875–0.943; P<0.001) with the sensitivity and specificity of 86% and 87% were calculated (Figure 2), respectively. As indicated in Table 1, AUC relevant to the combinations of miRs was 73% (95% CI 0.822–0.903) with the sensitivity and specificity of 73% and 70% by comparing the healthy and pre-diabetic groups, respectively. By comparing between the healthy and pre-diabetic groups, AUC for FG, BMI, TG, and HbA1c were 94%, 62%, 67%, and 85%, respectively.
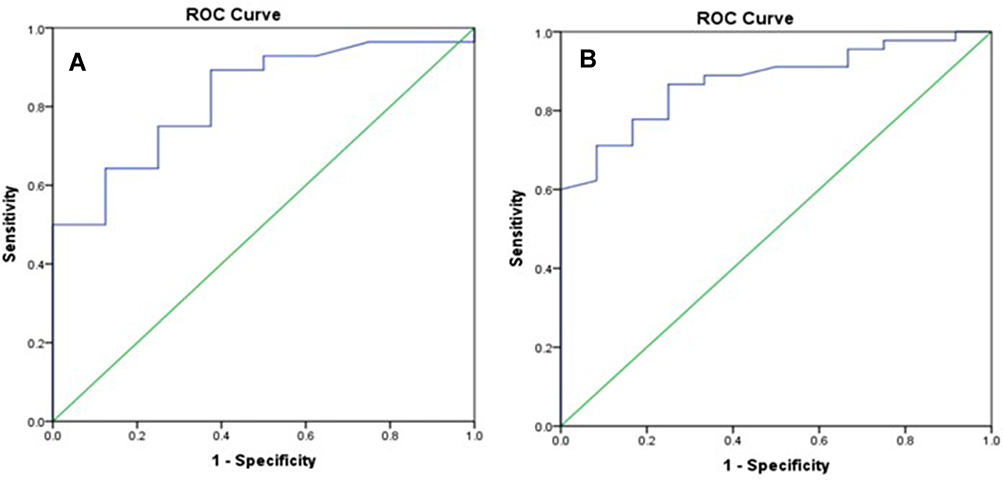 |
Figure 2 Receiver operating characteristic (ROC) curves of (A) miR-15a and (B). miR-222 expressions. ROC curves and corresponding AUCs for pre-T2D. The AUC in an established conventional model was 85% (95% CI 0.865–0.912; P<0.001) and 86% (95% CI 0.875–0.943; P<0.001) for miR-15a and miR-222, respectively. |
Discussion
This study is the first experiment that evaluated the expressions of miR-15a and miR-222 in pre-T2D and T2D subjects among the Iranian population. Altogether, these results provide an association between miR-15a and miR-222 expression levels in diabetic subjects. Levels of miRs expression were also found to be significantly altered in the pre-T2D subjects. Besides, a significant association was also observed between various biochemical parameters and the expression levels of miR-15a and miR-222.
In a study performed by Zampetaki et al, which was conducted in caucasian Italian population, miR-15a has also significantly decreased in plasma before the manifestation of T2D.25 In this study, 92% of diabetic cases were correctly diagnosed using expression levels of miR-15a as well as the levels of the other miRs (miR-126, miR-320, miR-223, and miR-28-3p). In another study by Flowers et al on the Asian Indians population, a negative relationship was found between plasma miR-15a levels and glycemic progression.32 Also, an in vitro study revealed a significantly higher miR-15a level after 1-h of glucose exposure, which was declined upon long-term exposure.33 In a study by Houshmand et al in Denmark, the expression of miR-15a has increased in skeletal muscle of the gestational diabetic and type 1 diabetic subjects compared to healthy individuals. Besides, maternal 2 h post-OGTT glucose levels were significantly associated with miR-15a level.34 This study also indicated that hyperglycemia can increase offspring miR-15a expression. Moreover, a decreased miR-15a level was also reported in the skeletal muscle of hyperglycemic T2D patients in the Dutch population .34 Conversely, Wang et al reported the upregulation of miR-15a independent of the other risk factors among the odds of T2D in native Swedish samples.35
Concerning miR-222 expression, Shi et al found an increase in miR-222 expression in omental adipose tissues from the patients with gestational diabetes mellitus in Chinese population.36 Regarding the contribution of obesity to diabetes development, Ortega et al conducted a study on obese Spanish population and found a significant overexpression in miR-222 level.37 Accordingly, in this study, a discriminant function of miR-222 along with three other miRs (miR-15a, miR-520c-3p, and miR-423-5p) was specific for morbidly obese patients, with a 94% diagnostic accuracy. Furthermore, Li et al showed an upregulation in miR-222 serum levels of T2D Chinese women.38 On the contrary, investigation of miRs expression pattern in the Italian population performed by De Candia et al revealed a decline in miR-222 expression of T2D subjects, which was inversely correlated with glycated hemoglobin and modulated in the plasma samples of diabetic subjects.39
Inconsistent results concerning miR-15a and miR-222 expressions mentioned in previously performed studies can be attributed to different factors. Also, it was obvious that different studies with different population backgrounds (ie, genetic and environmental factors) can affect miRs expression. For example, in a study by Wang et al, it was identified that the expression of several miRs including miR-15a have had different expression patterns in Iraqis and Swedes living in a similar environment.35,40 On the other hand, the high sequence similarity of miRs family members and the accuracy of various miRs measurement platforms are the other factors accounting for some of the disparities. Additional challenges could also result in more inconsistency such as the definition of disease’s stages and specific tissue expression in which the miRs quantification was conducted. As an example, various miRs expression results could be obtained by investigating plasma, serum, and whole blood in a group of T2D subjects with the same ethnicity.41,42
Totally, regardless of the high number of studies aimed to identify miRs involvement in diabetes, only a few number of them repeatedly discovered a subset of promising miRNAs. Indeed, most of the reported studies cannot be reproduced using the other sets of specimens. Thus, further studies are required to specify the diagnostic and prognostic potentials of miRs, as a T2D biomarker. So far, several studies have proposed various miRs such as miR-23a, miR-15a, and miR-375 as potential biomarkers for detecting T2D in the general population.28,43,44 Merely, miR-126 has been repeatedly reported in different studies as a potential predictor of both pre-T2D and T2D individuals.45,46 Herein, we reported a remarkable difference between expression values of miR-15a and miR-222 in pre-T2D subjects compared to healthy individuals. ROC analysis demonstrated considerable sensitivity and specificity of plasma miR-15a and miR-222 in distinguishing pre-T2D subjects and healthy individuals. AUC pertinent to the combination of miR-15a and miR-222 was 73%, which shows a lower stratification power compared to miR-15a and miR-222. Although AUC of HbA1c is comparable with miR-15a and miR-222; and also, AUCs for BMI and TG have lower values than AUCs of miRs. We also observed an association among miR-15a and miR-222 and FG, OGTT, and LDL-C, which candidates these miRs in diabetes development, while more studies are needed to further clarify these miRs roles.
Concerning miR-222 role in the pathophysiology of diabetes, it has been identified that miR-222 regulates estrogen receptor (ER) and glucose transporter 4 (GLUT4) protein levels in 3T3-L1 adipocytes cells. Moreover, using antisense oligonucleotides of miR-222 to silent miR-222 can lead to an increment in ER expression, GLUT4 translocation from cytoplasm to the cell membrane, glucose uptake, and an improvement in insulin sensitivity.36 Furthermore, Tsukita et al showed that bone marrow-secreted miR-222 following the bone marrow transplantation in streptozotocin-induced diabetic rats led to β-cell regeneration as well as amelioration of hyperglycemia.47 Additionally, overexpression of miR-222 in normal human liver cell line inhibited Coenzyme A oxidase 1, which is the key enzyme in fatty acid β- oxidation, and prevented β-oxidation of fatty acids and remarkably augmenting the triglyceride content.48
Alteration in miR-15a expression is associated with various biological processes. In this regard, some studies suggested a critical role for miR-15a in endothelial cell function and angiogenesis in peripheral vascular and cerebrovascular tissues.49 Upregulation of miR-15a reduces the angiogenesis in pro-angiogenic cells in vitro by targeting vascular endothelial growth factor A (VEGFA), which is associated with myocardial ischemia/reperfusion injury in mice. Moreover, the inhibition of miR-15 in cerebral vascular endothelial cells boosts the pro-angiogenic activity in animal models and in vitro studies.50 Besides, the downregulation of miR-15a has been found to be correlated with genomic instability and postnatal mitotic arrest of cardiomyocytes, as reported in several studies.51 Long-term glucose exposure results in the decreased miR-15a expression, which is associated with the decreased insulin expression and biosynthesis. In the same study, miR-15a upregulation led to the promotion of insulin gene expression in mouse insulinoma cells.33
Notably, the conventional biochemical indicators for T2D including levels of glucose and HbA1c may predict the initiation of T2D a few years prior to disease emergence. However, these biomarkers are not specific for T2D, which make them impractical to evaluate disease predisposition in the general population. Hence, the discovery of new biomarkers could be helpful in the identification of those people who are at risk leading to an appropriate management of T2D if necessary. The present clinical biomarkers can predict the development of diverse medical disorders such as myocardial infarctions, diabetes, and cancer.46 The most recent trend in biomarker discovery is searching for sensitive biomarkers applicable for the differentiation of the affected individuals from their healthy counterparts as well as specifying different stages of the disease. Another anticipated merit of these biomarkers is their availability, so that they can be readily attained from body fluids such as saliva, urine, or blood. Moreover, the stability of circulating miRs is remarkable in different situations such as tolerance to ribonucleases and freezing/thawing cycles.52 For example, plasma or serum specimens can be kept at −80°C for several months with no remarkable degradation.53
Conclusions
Overall, this study investigated the expression patterns of miR-15a and miR-222 for possible discernment among healthy, pre-T2D, and healthy subjects. The results revealed different expression patterns for miR-15a and miR-222 in the Iranian population, which can be considered as a valuable cornerstone for upcoming studies on the biomarker capability of these miRs for T2D.
Acknowledgment
The authors thank all the patients and individuals who attended this study. The current article is a part of Ph.D. thesis of Salman Sadeghzadeh from the Medical Biotechnology Research Center, of Islamic Azad University, Ashkezar Branch (Yazd, Iran).
Disclosure
The authors declare that they have no conflicts of interests.
References
1. Schuster DP. Metabolic syndrome, targets o, therapy. Obesity and the development of type 2 diabetes: the effects of fatty tissue inflammation. Diabetes Metab Syndr Obes. 2010;3:253.
2. Olokoba AB, Obateru OA, Olokoba LB. Type 2 diabetes mellitus: a review of current trends. Oman Med J. 2012;27(4):269.
3. Chen L, Magliano DJ, Zimmet P. The worldwide epidemiology of type 2 diabetes mellitus—present and future perspectives. Nat Rev Endocrinol. 2012;8(4):228.
4. Guariguata L, Whiting DR, Hambleton I, Beagley J, Linnenkamp U, Shaw JE. Global estimates of diabetes prevalence for 2013 and projections for 2035. Diabetes Res Clin Pract. 2014;103(2):137–149. doi:10.1016/j.diabres.2013.11.002
5. Esteghamati A, Larijani B, Aghajani MH, et al. Diabetes in Iran: prospective analysis from first nationwide diabetes report of National Program for Prevention and Control of Diabetes (NPPCD-2016). Sci Rep. 2017;7(1):1–10. doi:10.1038/s41598-017-13379-z
6. Ambros V. microRNAs: tiny regulators with great potential. Cell. 2001;107(7):823–826. doi:10.1016/S0092-8674(01)00616-X
7. Bartel DP. MicroRNAs: target recognition and regulatory functions. Cell. 2009;136(2):215–233. doi:10.1016/j.cell.2009.01.002
8. Dumortier O, Hinault C, Van Obberghen E. MicroRNAs and metabolism crosstalk in energy homeostasis. Cell Metab. 2013;18(3):312–324. doi:10.1016/j.cmet.2013.06.004
9. Bartel DP. MicroRNAs: genomics, biogenesis, mechanism, and function. Cell. 2004;116(2):281–297. doi:10.1016/S0092-8674(04)00045-5
10. Taylor DD, Gercel-Taylor C. MicroRNA signatures of tumor-derived exosomes as diagnostic biomarkers of ovarian cancer. Gynecol Oncol. 2008;110(1):13–21. doi:10.1016/j.ygyno.2008.04.033
11. Tanaka M, Oikawa K, Takanashi M, et al. Down-regulation of miR-92 in human plasma is a novel marker for acute leukemia patients. PLoS One. 2009;4(5):e5532. doi:10.1371/journal.pone.0005532
12. Fernández-Hernando C, Ramírez CM, Goedeke L, Suárez Y. MicroRNAs in metabolic disease. Arterioscler Thromb Vasc Biol. 2013;33(2):178–185. doi:10.1161/ATVBAHA.112.300144
13. Wang G-K, Zhu J-Q, Zhang J-T, et al. Circulating microRNA: a novel potential biomarker for early diagnosis of acute myocardial infarction in humans. Eur Heart J. 2010;31(6):659–666. doi:10.1093/eurheartj/ehq013
14. Fichtlscherer S, De Rosa S, Fox H, et al. Circulating microRNAs in patients with coronary artery disease. Circ Res. 2010;107(5):677–684. doi:10.1161/CIRCRESAHA.109.215566
15. Schulze MB, Weikert C, Pischon T, et al. Use of multiple metabolic and genetic markers to improve the prediction of type 2 diabetes: the EPIC-Potsdam Study. Diabetes Care. 2009;32(11):2116–2119. doi:10.2337/dc09-0197
16. Müller G. Microvesicles/exosomes as potential novel biomarkers of metabolic diseases. Diabetes Metab Syndr Obes. 2012;5:247. doi:10.2147/DMSO.S32923
17. Dehghani MR, Zarch SMA, Mehrjardi MYV, et al. Evaluation of miR-181b and miR-126-5p expression levels in T2DM patients compared to healthy individuals: relationship with NF-κB gene expression. Endocrinol Diabetes Nutr. 2020;67(7):454–460. doi:10.1016/j.endinu.2019.09.009
18. Kolberg JA, Jørgensen T, Gerwien RW, et al. Development of a type 2 diabetes risk model from a panel of serum biomarkers from the Inter99 cohort. Diabetes Care. 2009;32(7):1207–1212. doi:10.2337/dc08-1935
19. Mitchell PS, Parkin RK, Kroh EM, et al. Circulating microRNAs as stable blood-based markers for cancer detection. Proc Natl Acad Sci. 2008;105(30):10513–10518. doi:10.1073/pnas.0804549105
20. Chen X, Ba Y, Ma L, et al. Characterization of microRNAs in serum: a novel class of biomarkers for diagnosis of cancer and other diseases. Cell Res. 2008;18(10):997–1006. doi:10.1038/cr.2008.282
21. Alevizos I, Illei GG. MicroRNAs as biomarkers in rheumatic diseases. Nat Rev Rheumatol. 2010;6(7):391. doi:10.1038/nrrheum.2010.81
22. Sebastiani G, Nigi L, Grieco G, Mancarella F, Ventriglia G, Dotta F. Circulating microRNAs and diabetes mellitus: a novel tool for disease prediction, diagnosis, and staging? J Endocrinol Invest. 2017;40(6):591–610. doi:10.1007/s40618-017-0611-4
23. Lagos-Quintana M, Rauhut R, Lendeckel W, Tuschl T. Identification of novel genes coding for small expressed RNAs. Science. 2001;294(5543):853–858. doi:10.1126/science.1064921
24. Aghaei M, Khodadadian A, Elham K-N, Nazari M, Babakhanzadeh E. Major miRNA involved in insulin secretion and production in beta-cells. Int J Gen Med. 2020;13:89.
25. Zampetaki A, Kiechl S, Drozdov I, et al. Plasma microRNA profiling reveals loss of endothelial miR-126 and other microRNAs in type 2 diabetes. Circ Res. 2010;107(6):810–817. doi:10.1161/CIRCRESAHA.110.226357
26. Kong L, Zhu J, Han W, et al. Significance of serum microRNAs in pre-diabetes and newly diagnosed type 2 diabetes: a clinical study. Acta Diabetol. 2011;48(1):61–69. doi:10.1007/s00592-010-0226-0
27. Karolina DS, Tavintharan S, Armugam A, et al. Circulating miRNA profiles in patients with metabolic syndrome. J Clin Endocrinol Metab. 2012;97(12):E2271–E2276. doi:10.1210/jc.2012-1996
28. Yang Z, Chen H, Si H, et al. Serum miR-23a, a potential biomarker for diagnosis of pre-diabetes and type 2 diabetes. Acta Diabetol. 2014;51(5):823–831.
29. Chamberlain JJ, Rhinehart AS, Shaefer CF, Neuman A. Diagnosis and management of diabetes: synopsis of the 2016 American Diabetes Association Standards of Medical Care in Diabetes. Ann Intern Med. 2016;164(8):542–552. doi:10.7326/M15-3016
30. World Medical Association. Declaration of Helsinki. Law Medicine Healthc. 1991;19(3–4):264.
31. Natali A, Baldi S, Bonnet F, et al. Plasma HDL-cholesterol and triglycerides, but not LDL-cholesterol, are associated with insulin secretion in non-diabetic subjects. Metabolism. 2017;69:33–42. doi:10.1016/j.metabol.2017.01.001
32. Flowers E, Gadgil M, Aouizerat BE, Kanaya AM. Circulating microRNAs associated with glycemic impairment and progression in Asian Indians. Biomarker Res. 2015;3(1):22. doi:10.1186/s40364-015-0047-y
33. Sun -L-L, Jiang B-G, Li W-T, Zou -J-J, Shi Y-Q, Liu Z-M. MicroRNA-15a positively regulates insulin synthesis by inhibiting uncoupling protein-2 expression. Diabetes Res Clin Pract. 2011;91(1):94–100. doi:10.1016/j.diabres.2010.11.006
34. Houshmand-Oeregaard A, Schrölkamp M, Kelstrup L, et al. Increased expression of microRNA-15a and microRNA-15b in skeletal muscle from adult offspring of women with diabetes in pregnancy. Hum Mol Genet. 2018;27(10):1763–1771. doi:10.1093/hmg/ddy085
35. Wang X, Sundquist J, Zöller B, et al. Determination of 14 circulating microRNAs in Swedes and Iraqis with and without diabetes mellitus type 2. PLoS One. 2014;9(1):e86792.
36. Shi Z, Zhao C, Guo X, et al. Differential expression of microRNAs in omental adipose tissue from gestational diabetes mellitus subjects reveals miR-222 as a regulator of ERα expression in estrogen-induced insulin resistance. Endocrinology. 2014;155(5):1982–1990. doi:10.1210/en.2013-2046
37. Ortega FJ, Mercader JM, Catalán V, et al. Targeting the circulating microRNA signature of obesity. Clin Chem. 2013;59(5):781–792. doi:10.1373/clinchem.2012.195776
38. Li M, Pan S, Qiu A. Roles of microRNA-221/222 in type 2 diabetic patients with post-menopausal breast cancer. Genet Mol Res. 2016;15(2).
39. De Candia P, Spinetti G, Specchia C, et al. A unique plasma microRNA profile defines type 2 diabetes progression. PLoS One. 2017;12(12):e0188980. doi:10.1371/journal.pone.0188980
40. Meerson A, Najjar A, Saad E, Sbeit W, Barhoum M, Assy N. Sex differences in plasma microRNA biomarkers of early and complicated diabetes mellitus in Israeli Arab and Jewish Patients. Non-Coding RNA. 2019;5(2):32. doi:10.3390/ncrna5020032
41. He Y, Ding Y, Liang B, et al. A systematic study of dysregulated microRNA in type 2 diabetes mellitus. Int J Mol Sci. 2017;18(3):456. doi:10.3390/ijms18030456
42. Wang K, Yuan Y, Cho J-H, McClarty S, Baxter D, Galas DJ. Comparing the MicroRNA spectrum between serum and plasma. PLoS One. 2012;7(7):e41561.
43. Al-Kafaji G, Al-Mahroos G, Alsayed NA, Hasan ZA, Nawaz S, Bakhiet M. Peripheral blood microRNA-15a is a potential biomarker for type 2 diabetes mellitus and pre-diabetes. Mol Med Rep. 2015;12(5):7485–7490. doi:10.3892/mmr.2015.4416
44. Higuchi C, Nakatsuka A, Eguchi J, et al. Identification of circulating miR-101, miR-375 and miR-802 as biomarkers for type 2 diabetes. Metabolism. 2015;64(4):489–497. doi:10.1016/j.metabol.2014.12.003
45. Zhang T, Li L, Shang Q, Lv C, Wang C, Su B. Circulating miR-126 is a potential biomarker to predict the onset of type 2 diabetes mellitus in susceptible individuals. Biochem Biophys Res Commun. 2015;463(1–2):60–63. doi:10.1016/j.bbrc.2015.05.017
46. Rezk NA, Sabbah NA, Saad MS. Role of microRNA 126 in screening, diagnosis, and prognosis of diabetic patients in Egypt. IUBMB Life. 2016;68(6):452–458. doi:10.1002/iub.1502
47. Tsukita S, Yamada T, Takahashi K, et al. MicroRNAs 106b and 222 improve hyperglycemia in a mouse model of insulin-deficient diabetes via pancreatic β-cell proliferation. EBioMedicine. 2017;15:163–172. doi:10.1016/j.ebiom.2016.12.002
48. Wang -J-J, Zhang Y-T, Tseng YJ, Zhang J. miR-222 targets ACOX1, promotes triglyceride accumulation in hepatocytes. Hepatobiliary Pancreat Dis Int. 2019;18(4):360–365. doi:10.1016/j.hbpd.2019.05.002
49. Liu L-F, Liang Z, Lv Z-R, et al. MicroRNA-15a/b are up-regulated in response to myocardial ischemia/reperfusion injury. J Geriatr Cardiol. 2012;9(1):28. doi:10.3724/SP.J.1263.2012.00028
50. Yin K-J, Olsen K, Hamblin M, Zhang J, Schwendeman SP, Chen YE. Vascular endothelial cell-specific microRNA-15a inhibits angiogenesis in hindlimb ischemia. J Biol Chem. 2012;287(32):27055–27064. doi:10.1074/jbc.M112.364414
51. Gallagher IJ, Scheele C, Keller P, et al. Integration of microRNA changes in vivo identifies novel molecular features of muscle insulin resistance in type 2 diabetes. Genome Med. 2010;2(2):9. doi:10.1186/gm130
52. Leong A, Porneala B, Dupuis J, Florez JC, Meigs JB. Type 2 diabetes genetic predisposition, obesity, and all-cause mortality risk in the US: a multiethnic analysis. Diabetes Care. 2016;39(4):539–546. doi:10.2337/dc15-2080
53. Association AD. 4. Lifestyle management: standards of medical care in diabetes—2018. Diabetes Care. 2018;41(Supplement 1):S38–S50. doi:10.2337/dc18-S004
 © 2020 The Author(s). This work is published and licensed by Dove Medical Press Limited. The full terms of this license are available at https://www.dovepress.com/terms.php and incorporate the Creative Commons Attribution - Non Commercial (unported, v3.0) License.
By accessing the work you hereby accept the Terms. Non-commercial uses of the work are permitted without any further permission from Dove Medical Press Limited, provided the work is properly attributed. For permission for commercial use of this work, please see paragraphs 4.2 and 5 of our Terms.
© 2020 The Author(s). This work is published and licensed by Dove Medical Press Limited. The full terms of this license are available at https://www.dovepress.com/terms.php and incorporate the Creative Commons Attribution - Non Commercial (unported, v3.0) License.
By accessing the work you hereby accept the Terms. Non-commercial uses of the work are permitted without any further permission from Dove Medical Press Limited, provided the work is properly attributed. For permission for commercial use of this work, please see paragraphs 4.2 and 5 of our Terms.