Back to Journals » Diabetes, Metabolic Syndrome and Obesity » Volume 16
Circulating MicroRNA-30a, Beclin1 and Their Association with Different Variables in Females with Metabolically Healthy /Unhealthy Obesity
Authors Naguib M ![]() , Magdy M
, Magdy M ![]() , Yousef OAE
, Yousef OAE ![]() , Ibrahim W, Gharib DM
, Ibrahim W, Gharib DM
Received 5 July 2023
Accepted for publication 26 September 2023
Published 3 October 2023 Volume 2023:16 Pages 3065—3074
DOI https://doi.org/10.2147/DMSO.S428844
Checked for plagiarism Yes
Review by Single anonymous peer review
Peer reviewer comments 4
Editor who approved publication: Prof. Dr. Juei-Tang Cheng
Mervat Naguib,1 Mohamed Magdy,1 Omar Ahmed Elsayed Yousef,2 Walaa Ibrahim,3 Doaa Mostafa Gharib3
1Diabetes and Endocrinology Unite, Internal Medicine Department, Faculty of Medicine, Cairo University, Cairo, Egypt; 2Faculty of Medicine, University of Debrecen, Debrecen, Hungary; 3Medical Biochemistry and Molecular Biology Department, Faculty of Medicine, Cairo University, Cairo, Egypt
Correspondence: Mervat Naguib, Diabetes and Endocrinology Unite, Internal Medicine Department, Faculty of Medicine, Cairo University, 41 Manial Street, Cairo, 11451, Egypt, Tel +20 25729584, Fax +20 2628884, Email [email protected]; [email protected]
Background: Obesity is associated with metabolic and cardiovascular co-morbidities. It is important to determine the factors associated with metabolic derangement in obesity. Autophagy plays a major role in the pathogenesis of metabolic syndrome. MicroRNA-30a targets beclin1, the main regulator of autophagy.
Purpose: We assess circulating microRNA-30a and serum beclin1 in women with metabolically unhealthy obesity (MUO), women with metabolically healthy obesity (MHO) and non-obese healthy control and determine their relationship with different clinical and metabolic variables in women with obesity.
Patients and Methods: This cross-sectional study included 34 women with MHO, 34 with MUO, and 20 healthy non-obese women. Blood pressure, body mass index (BMI), and waist circumference were recorded. Glycemic and lipid indices, urinary albumin-to-creatinine ratio, ALT, AST, microRNA-30a expression in serum were measured using real-time polymerase chain reaction and beclin1 by enzyme-linked immunosorbent assay were measured.
Results: The expression of microRNA-30a was significantly higher, and beclin1 level was significantly lower in women with MUO compared to those in women with MHO (P< 0.001; for both). People with MUO were significantly older (P< 0.001) and had higher TSH (P=0.006), HbA1c (P< 0.001), triglyceride (P< 0.001), and ALT (P< 0.001) compared to women with MHO. However, there was no significant difference between the two groups in any anthropometric measurements, HDL-C or LDL-C. In univariate analyses, age, ALT, TSH, microRNA-30a, and beclin1 were significantly correlated with the MUO phenotype (P< 0.001; for all). Significance was confirmed in the multivariate analysis for microRNA-30a (95% CI 1.317– 28.252; P=0.021).
Conclusion: MicroRNA-30a, beclin1, age, and ALT and TSH levels were significantly associated with the MUO phenotype, among which microRNA-30a was the best indicator of metabolic syndrome in women with obesity.
Keywords: metabolic syndrome, microRNA-30a, beclin1, obesity
Introduction
Obesity is a major global health concern. Obesity is associated with a group of metabolic complications, including atherogenic dyslipidemia, abnormalities in glucose metabolism, and non-alcoholic fatty liver disease that can progress to diabetes and cardiovascular diseases.1 Nevertheless, not all individuals with obesity have metabolic disorders, making them a distinct category of people with obesity defined as metabolically healthy obesity (MHO). There are different criteria to classify obesity as MHO and metabolically healthy obesity (MUO). These criteria are partly similar to the criteria for the diagnosis of metabolic syndrome. Although obesity is a major risk factor for the development of metabolic syndrome and its components, this relationship is not fully unequivocal and there are non-obese people who meet the criteria for the diagnosis of metabolic syndrome.2
The exact mechanism underlying metabolic health retention in patients with MHO remains unclear. Studies have demonstrated the importance of body fat distribution, genetic and epigenetic factors, oxidative stress, inflammatory state, microRNA expression, and autophagy disruptions in the pathogenesis of metabolic disorders.3–6
Autophagy, an autodigestion process, is essential for clearing aggregated proteins and senile organelles, particularly during stress or injury condition that involves intra lysosomal hydrolysis and degradation of damaged cellular components.7 There is mounting evidence that autophagy imbalance is associated with metabolic diseases such as diabetes and metabolic syndrome.7 Beclin1, an adaptor protein, is a key regulator of autophagy and could have a role in metabolic syndrome.8 Different factors affect the genes that are involved in autophagy and its effect in various disease conditions.
MicroRNAs are minute noncoding RNAs that play important roles in various biological processes including autophagy.9 Also, there is growing evidence supporting the role of microRNAs in the pathogenesis of metabolic syndrome and its related complications.10 However, microRNAs that are dysregulated and their target pathways require further evaluation. MicroRNA-30a has been reported to target the autophagy-promoting gene beclin1 in some biological processes such as cardiomyopathy and atherosclerosis.11,12 Recently, an experimental study has shown that microRNA-30a modulates metabolic inflammation in adipose tissue macrophages, suggesting the role of this microRNA in obesity-associated inflammation.10 Yet, the circulating level of microRNA-30a and beclin1 in obesity need further evaluation. The main purpose of the current study was to verify the circulating level of MicroRNA-30a and beclin1 in women with MUO, MHO, and non-obese healthy women, and to explore their relationship with different clinical and metabolic indicators of metabolic syndrome in women with obesity.
Materials and Methods
Study Design
This cross-sectional study was conducted at Kasr Al-Ainy Hospital, a tertiary medical center in Cairo.
Sample Size
Setting the power=0.80 and α=0.05 with using PASS 11th release,13 each group should have a minimal sample size of three cases to get statistical significance between assumed beclin1 level 1.28±0.51(ng/mL) in patients with type 2 diabetes mellitus (T2DM) and 5.24±1.22(ng/mL) and healthy subjects, respectively.14 We included 34 women with MHO and 34 women with MUO and 20 healthy controls for further analysis.
Study Population
This study included 34 MHO and 34 MUO women, and 20 healthy non-obese women as controls. All participants were recruited from among those who attended the Internal Medicine and Diabetes, Endocrinology, and Nutrition outpatient clinics, Kasr Al-Ainy Hospital, Cairo University from December 2022 to April 2023. Patients with (1) secondary obesity (genetic syndromes, drug-induced, and endocrine diseases), (2) autoimmune diseases, (3) malignancy, (4) liver cirrhosis, (5) chronic renal disease, or (6) pregnancy were excluded. All participants underwent thorough medical assessment, including measurements of blood pressure, weight, height, body mass index (BMI), and waist circumference. All participants were tested for fasting plasma glucose (FPG), glycated hemoglobin (HbA1c) levels, lipid profiles, urine albumin creatinine ratio (ACR), alanine aminotransferase (ALT), and aspartate aminotransferase (AST). Real-time polymerase chain reaction (PCR) was used to measure microRNA-30a gene expression in the serum of obese and healthy subjects. Serum beclin1 levels were assessed using an enzyme-linked immunoassay (ELISA). Patients were classified into MHO and MUO groups based on the presence or absence of metabolic syndrome, as defined in the NCEP 2005 consensus report.15
Biochemical Assay
Venous samples were taken at the enrolment visit after the participants had 8-hr overnight fasting. FPG was done using enzymatic colorimetric method (glucose oxidase method).16
Estimation of Gene Expression of MicroRNA-30a in Serum by RT-PCR
The GeneJET RNA Purification Kit (Thermo Fisher Scientific, Inc.) was used for total RNA extraction from the serum according to the manufacturer’s instructions. RNA quality was evaluated using a NanoDrop 1000 spectrophotometer (NanoDrop Technologies, Inc. Wilmington, USA). High-Capacity cDNA Reverse Transcription Kits (Thermo Fisher Page 5/15 Scientific) were used to synthesize complementary DNA, following the manufacturer’s instructions. Amplification of microRNA-30a gene expression was performed using Real time-qPCR and SYBR Premix Ex TaqTM II (Perfect Real Time, TaKaRa, Japan). The PCR conditions were as follows: 95°C for 5 min, followed by 40 cycles of 95°C for 15s and 60°C for 60s. To quantitatively examine the data, the RQ of each target gene was measured by normalization against U6 as internal reference gene to calculate the 2 − ΔΔCt. The primer sequences for the studied genes were as follows:
- MicroRNA-30a forward 5’-ACACTCCAGCTGGGTGTAAACATCCTCGAC-3’; reverse5’-CAGTGCGTGTCGTGGAGT-3’
- U6 forward 5’-GCTTCGGCAGCACATATACTAAAAT-3’; reverse5’-CGCTTCACGAATTTGCGTGTCAT-3’
Relative quantitation was performed using the Applied Biosystems software. The cycle threshold (Ct) values were graphically obtained for U6 and different target genes. The Ct values of all the target genes were first normalized to U6 in the same sample and expressed as ΔCt values. Subsequently, ΔΔCt values were determined by subtracting the ΔCt values of the control samples from those of the treated samples, and the 2−ΔΔCt values were determined to represent different target gene amounts. The final values are expressed as ratios to the control cells.
Detection of Beclin1 Level by ELISA
Serum separator tubes were used, and the samples were allowed to clot for 2 h at room temperature or overnight at 2–8°C. Centrifuge at approximately 1000 × g (3000 rpm) for 15 min. The serum was removed, and the samples were stored at −80°C. ELISA kit applies the quantitative sandwich enzyme immunoassay technique (MyBioSource, Inc., California, USA) and was used to quantify serum beclin1 level in ng/mL. The assay was performed according to the manufacturer’s instructions.
Statistical Analysis
Data were summarized using mean for central tendency and SD for dispersion. Analysis of variance (ANOVA) with multiple comparisons post hoc test was used to examine normally distributed quantitative variables. Data was double-checked for normality using Shapiro Wilk test and normality plots. To compare categorical data, the chi-square (χ2) test was used; when the expected frequency was <5, the exact test was performed instead. Correlations between quantitative variables were done using Spearman correlation coefficient. Logistic regression analysis was performed to detect independent predictors of MUO. P < 0.05 was considered statistically significant. All statistical analyses were performed using statistical package for the Social Sciences (SPSS) version 28 (IBM Corp., Armonk, NY, USA).
Results
Comparison of the Clinical and Metabolic Characteristics Between Women with MUO and MHO
Women with MUO were significantly older (36.47±7.50 years) compared to those with MHO (28.35±7.02 years) (P<0.001). FPG, HbA1c, and triglyceride levels were significantly higher in the MUO group with MUO compared to the group with MHO (P≤0.001). ALT, AST, and TSH levels were also significantly higher in females with MUO than in those with MHO (P<0.001, P=0.013, P=0.006). However, there were no significant differences in SBP (P=0.317), BMI (P=0.239), or waist circumference (P=1.000) between the MHO and MUO groups (Table 1).
 |
Table 1 Comparison of Clinical and Metabolic Characteristics of Women with MHO and MUO |
Serum MicroRNA-30a and Beclin1 Levels in Women with MUO, MHO, and Normal Non-Obese Control
The expression levels of microRNA-30a showed a stepwise rise in the healthy non-obese (1.03±0.05), MHO (3.01±1.30), and MUO (6.84±1.97) groups. MicroRNA-30a was significantly upregulated in women with MHO compared to healthy women (P<0.001) and in women with MUO compared to MHO (P<0.001) (Figure 1). Serum beclin1 was significantly lower in the group with MHO (7.19±1.69 ng/mL) compared to normal non-obese women (12.61±1.84 ng/mL) (P<0.001). But, women with MUO had significantly lower beclin1 level (4.34±1.16 ng/mL) compared to those with MHO (P<0.001) (Figure 2).
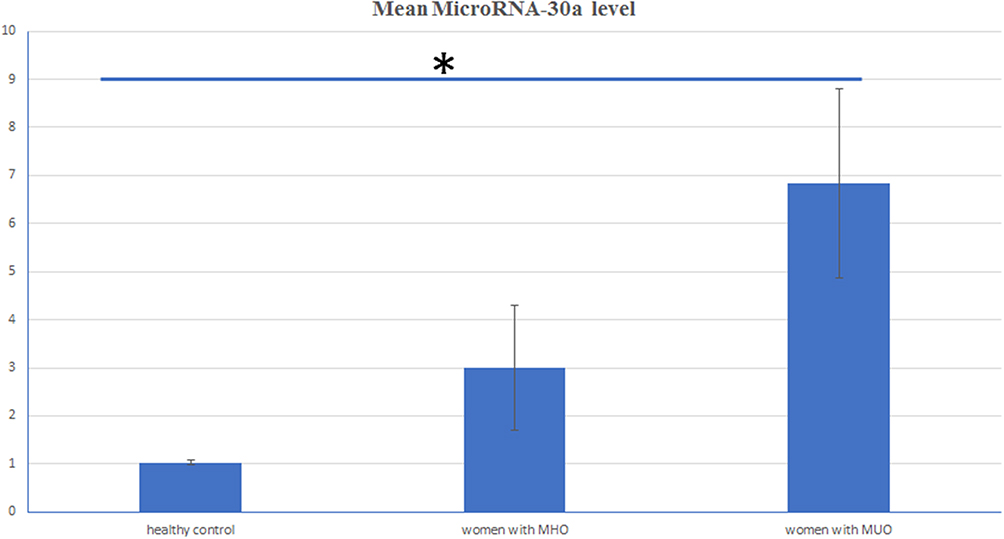 |
Figure 1 Mean MicroRNA-30a expression level in healthy controls, women with MHO and MUO. Notes: Women with metabolically healthy obesity (MHO) had significantly higher microRNA-30a (3.01±1.30) than healthy controls (1.03±0.05) (*P<0.001), but significantly lower microRNA-30a compared to women with metabolically unhealthy obesity (MUO) (6.84±1.97) (*P<0.001). |
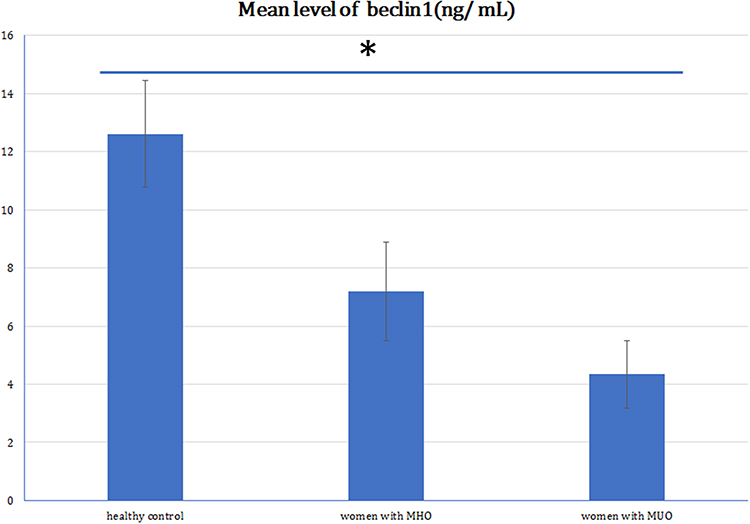 |
Figure 2 Mean beclin1 level in healthy controls, women with MHO and MUO. Notes: Women with metabolically healthy obesity (MHO) had significantly lower serum beclin 1 (7.19±1.69 ng/dL) compared to healthy controls (12.61±1.84 ng/mL) (*P<0.001), but significantly higher serum beclin 1 compared to women with metabolically unhealthy obesity (MUO) (4.34±1.16 ng/dL) (*P<0.001). |
Correlations of Serum MicroRNA-30a and Beclin1 Levels with Different Variables in Patients with Obesity
MicroRNA-30a expressions showed a moderate positive correlation with various metabolic syndrome components (BMI, waist circumference, triglycerides, plasma glucose, and blood pressure) (Table 2). Moreover, MicroRNA-30a expressions showed a strong negative correlation with serum beclin1 (r=−0.654; P<0.001) (Table 2).
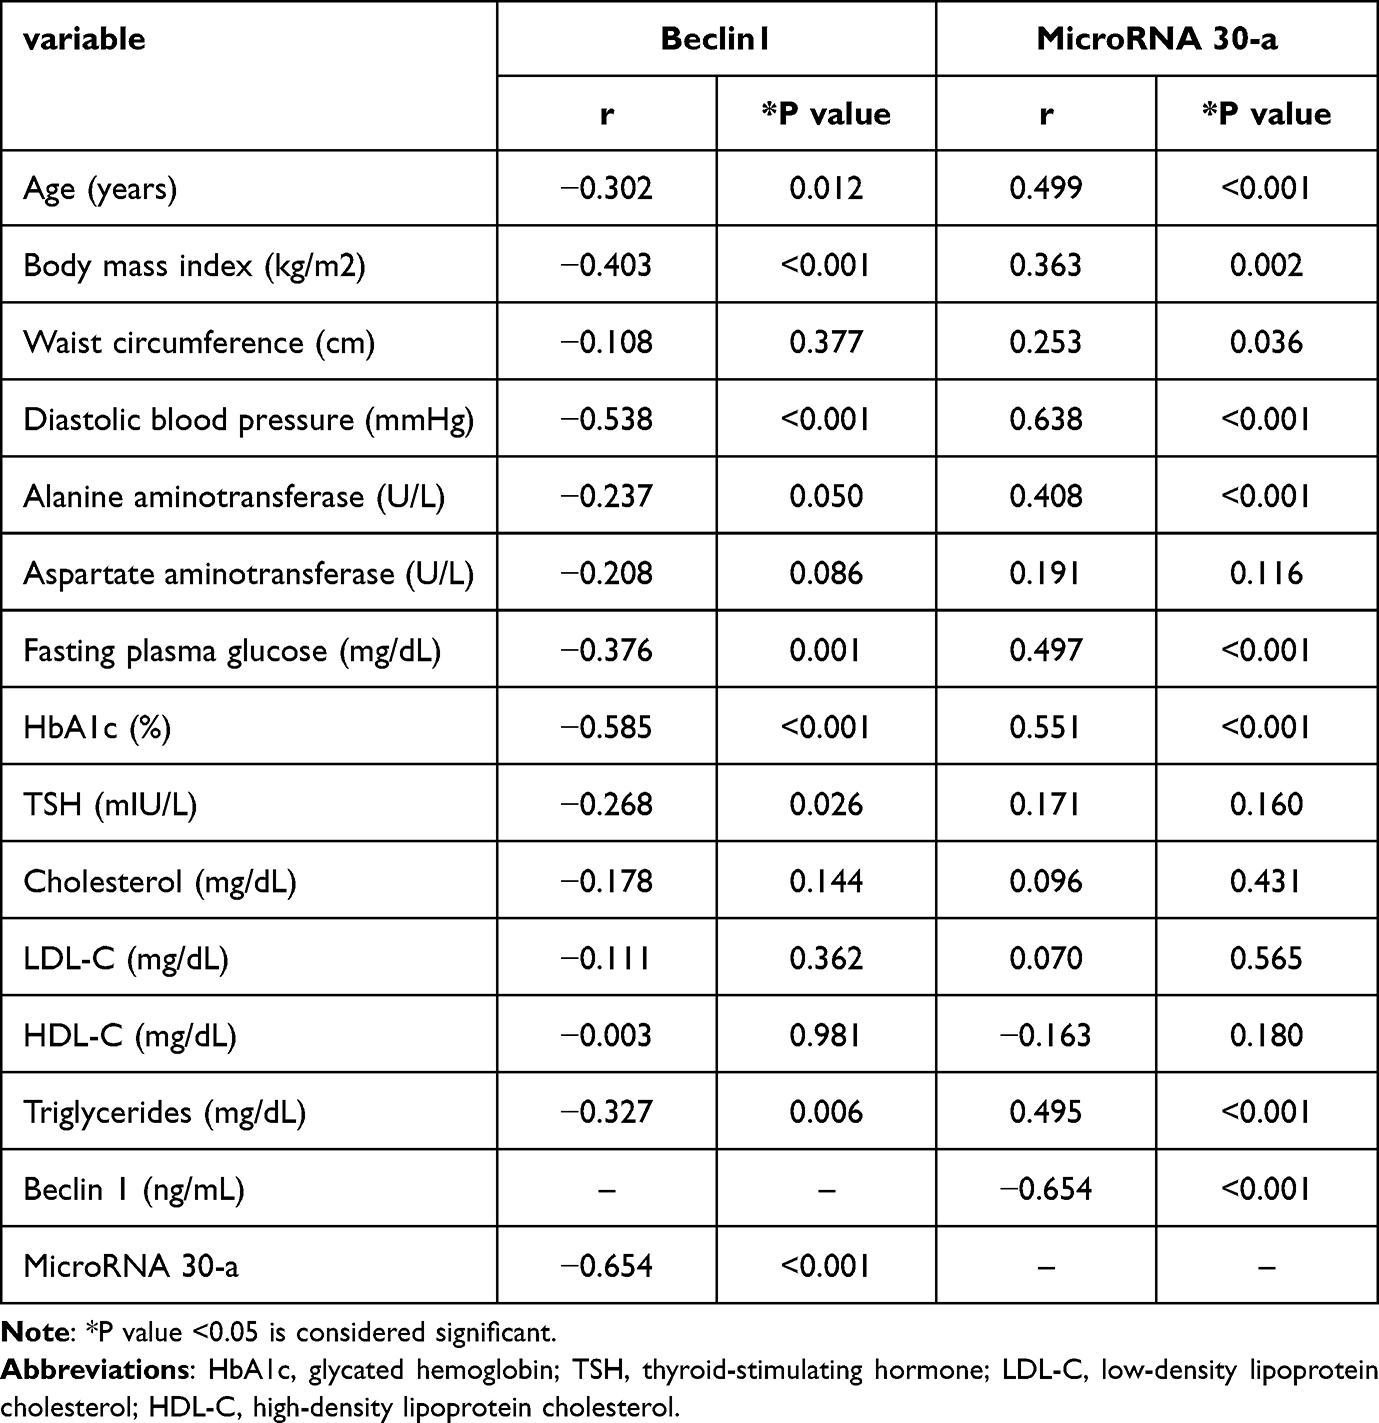 |
Table 2 Correlations of Serum beclin1 and microRNA-30a with Different Variables in Women with Obesity |
Correlations between the different variables and beclin1 were also examined (Table 2). Serum beclin1 levels were negatively correlated with age (r=−0.302; P=0.012), BMI (r=−0.403; P<0.001), FPG (r=−0.376; P=0.001), HbA1c (r=−0.585; P<0.001), triglycerides (r=−0.327; P=0.026), and microRNA 30-a (r=−0.654; P<0.001). However, no significant correlations were found between beclin1 and waist circumference and ALT, AST, LDL, or HDL levels.
Regression Analysis of Factors Associated with MUO
Univariate logistic regression was used to analyze the effects of the five most significant variables that were closely associated with MUO. The results showed that the risk of MUO was 1.1‐fold higher in women with advanced age and higher ALT levels than in women without advanced age and high ALT levels (OR:1.177, 95% CI:1.079–1.284, P<0.001). The risk of MUO was 1.98‐fold higher in participants with high TSH levels than in those without TSH levels (OR: 1.981, 95% CI: 1.211–3.243, P=0.007). The risk of MUO was higher in females with low beclin1 level than in females without low beclin1 (OR: 0.299, 95% CI: 0.177–0.506, P<0.001).
Additionally, increased serum microRNA-30a levels were associated with a 3.965 risk of MUO (Table 3). To adjust for confounding factors, multivariate regression analysis was performed using the forward stepwise method, and the results showed that microRNA-30a was the only factor independently associated with MUO (OR:0.89, 95% CI:0.83–0.96, P=0.003) (Table 4).
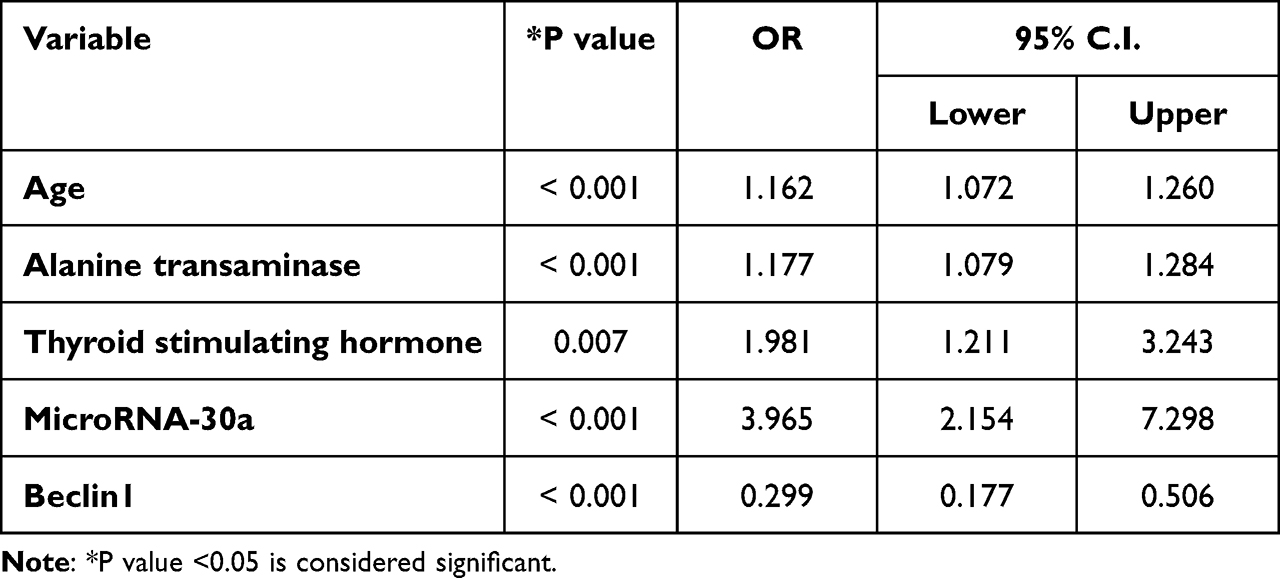 |
Table 3 Univariate Analysis of Factors Associated with Metabolically Unhealthy Obesity |
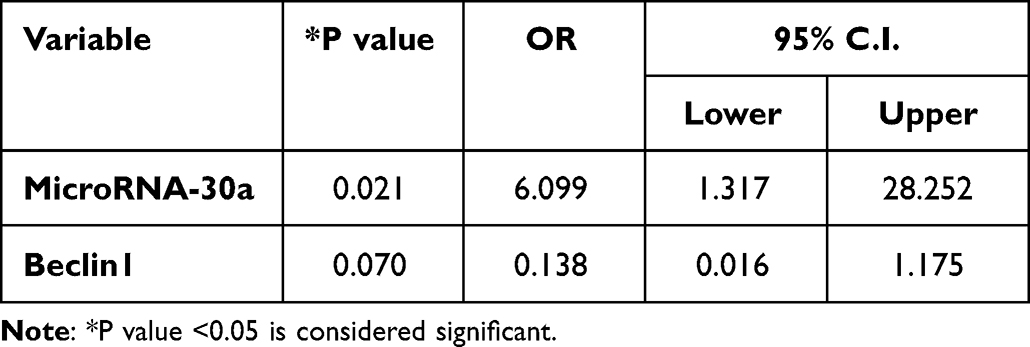 |
Table 4 Multivariate Regression Analysis of Factors Associated with Metabolically Unhealthy Obesity |
Discussion
Individuals with MHO have a lower risk of developing cardiovascular disease than those with metabolic syndrome.17 However, factors associated with MHO and MUO remain unclear. Autophagy plays an important role in maintaining adipocyte function and structure, and impaired autophagy in obesity causes metabolic derangement, causing metabolic syndrome.18 While some studies showed reduced autophagy activity in obesity,19,20 others revealed activation of autophagy in obesity.21,22 The present study showed a decrease in serum beclin1 in women with MUO compared to women with MHO. Beclin1 plays a crucial role in the maintenance of lipid metabolism and mitochondrial function in adipocytes.8 Jin et al demonstrated that mice deficient in beclin gene showed severe fat cell inflammation, hepatocyte fatty infiltration, and insulin resistance, pointing to its important role in development of metabolic syndrome.8 Furthermore, beclin1 was found to function in adipose tissue and facilitates the secretion of adiponectin to systemically regulate energy metabolism.6
MicroRNA-30a is the main regulator of autophagy and has been found to inactivate autophagy by targeting beclin1 in many types of cancer.23 Data from a functional study revealed that miR-30a-5p directly interacts with the 3′-UTR of beclin1 and that beclin1 enhances cell autophagy by increasing ATG16 levels.24 However, little is known about the contribution of microRNA-30a to metabolic syndrome in obesity. What was evident in our study was the higher expression of microRNA-30a in women with MUO than in women with MHO. Furthermore, there was a significant negative correlation between microRNA-30a and beclin1 levels in patients with obesity. Similar to our results microRNA-30a levels were elevated in men with one or more risk factors for metabolic syndrome.5 Likewise, a prospective study reported raised levels of microRNA-30a in people with prediabetes compared to normal subjects, and this rise occurred many years before the occurrence of diabetes.25 Also, Koh et al illustrated that the expression of microRNA-30a protected adipose tissue from the harmful effects of inflammatory mediators, leading to a reduction in insulin resistance in obese mice.26 Conversely, the suppression of microRNA-30a was found to have a protective effect on pancreatic beta cells and enhanced glucose metabolism.27 This contradiction might be explained by the early rise of microRNA-30a in obesity, protecting adipose tissue from damage by inflammatory cytokines and improving insulin sensitivity; however, long-standing elevation leads to beta-cell dysfunction and development of metabolic derangement.
MicroRNA-30a but not beclin1 was significant and positively correlated with waist circumference in this study. Conversely, Weale et al found a negative correlation between microRNA-30a and waist circumference in people with prediabetes.28 Although, indicators of fat distribution, such as waist circumference, have been associated with MUO,29 our results showed no significant difference between women with MHO and MUO regarding BMI or waist circumference. Similarly, these obesity measures were not associated with MHO in a previous study by Wan et al in children, which may indicate other pathogenic factors that promote MUO development.30
In the present study, the MUO phenotype was associated with higher blood glucose, LDL cholesterol, triglyceride, hepatic transaminase, and TSH levels. A previous study showed that a high-glucose environment could induce autophagy and increase the level of beclin1 in diabetes.31 However, in our study, there was a negative correlation between beclin1 and blood glucose in women with obesity. Consistent with our results, Zhang et al found that MicroRNA-30a reduced beclin1-mediated autophagy induced by high glucose in lens epithelial cells.32
Our results revealed that microRNA-30a is positively correlated with the elements of metabolic syndrome. The association between microRNA-30a and cardiovascular diseases has been formerly described.14,32 The microRNA-30 has been shown to affect endothelial cell function and arteriolar branching and consequently development of hypertension.33 Furthermore, microRNA-30a was found to be associated with an atherogenic lipid profile.14 Also, autophagy has important regulatory role in lipid metabolism and autophagy dysfunction is associated with atherogenic lipid profile and development of atherosclerosis.34 Furthermore, our previous work has demonstrated significant relationship between beclin1 and atherosclerosis and LDL-C, HDL-C, and triglycerides in patients with T2DM.18
The prevalence of metabolic syndrome increases with age.35 In this study, women with MUO were older than those with MHO were. In addition, age was a significant factor associated with MUO. There is increasing evidence that autophagic activity is disturbed during the ageing process.36 In confluence, this study showed a negative correlation between age and beclin1, but a positive correlation with MicroRNA-30a.
Interestingly, TSH levels were significantly associated with MUO in this study. Additionally, TSH levels were significantly elevated in women with MUO compared to those in women with MHO. Thyroid dysfunction has recently been reported in women with metabolic syndrome.37 Recently, the expression of the autophagic marker beclin1 was reduced in TSH-stimulated chondrocytes, accompanied by impaired autophagic flux.38 Correspondingly, we found a significant negative correlation between beclin1 and TSH in women with obesity, which could be meaningful in understanding the effects of increased TSH levels on autophagy and its role in metabolic syndrome.
NAFLD is strongly associated with obesity and metabolic syndrome.39 In this context, the present study showed increased aminotransferase levels in women with MHO compared to normal non-obese subjects, and in MUO compared to MHO. In addition, we found a significant negative correlation between beclin1 and aminotransferases in women with obesity. Previous studies have shown that autophagy is negatively affected by the development of fatty liver disease and that activation of autophagy may resolve steatosis.40 In line with our finding, others also reported autophagy deterioration in non-alcoholic fatty liver diseases.41 Multiple circulating microRNAs including miR-34a, miR-122, miR-192, and miR-200a has been linked to the development and severity of NAFLD.42 However, no previous study investigated the relation of MicroRNA-30a to NAFLD. The current study revealed that microRNA-30a might contribute to the development of NAFLD in patients with obesity and MicroRNA-30a was significantly correlated with ALT in women with obesity.
The current study has some limitations. First, despite the significant correlation between microRNA-30a and beclin1 that proposes a molecular pathway in patients with obesity, the study lacked functional analyses. Second, this is a cross-sectional study. Further prospective studies are needed to confirm the dynamic changes in beclin1 levels and microRNA-30a in patients with obesity progressing from MHO to MUO. Third, beclin1 levels were measured in the serum, and adipocyte-specific beclin1 gene expression as marker of autophagy at cellular level was not performed which makes the serum source of beclin1 unclear. However, according to published autophagy guidelines, monitoring changes in the expressed proteins of autophagy genes could reflect changes in autophagy regulation.43 Fourth, ultrasound was not done to confirm the diagnosis of NAFLD, so further studies are needed for confirming the relation between NAFLD and microRNA-30a. Fifth, because of limited published data of beclin1 and microRNA-30a in MHO and MHO sample size calculation was based on studies comparing patients with diabetes and healthy control. Lastly, the participants were recruited from one area; therefore, the results cannot be generalized to people from other geographic regions. Further studies in different ethnicities are required to validate our results.
Conclusion
This study provides clinical evidence of increased expression of microRNA-30a and decreased expression of beclin1, the key regulator of autophagy, in patients with obesity and metabolic syndrome. In addition, it demonstrated a significant negative correlation of beclin1 and a positive correlation of microRNA-30a with the clinical and metabolic variables of metabolic syndrome. Furthermore, microRNA-30a might be an important marker of MUO.
Data Sharing Statement
The data supporting the findings of this study are available from the corresponding author upon reasonable request.
Ethics Approval and Informed Consent
This was approved by the ethics committee of Kasr Al-Ainy Hospital, Faculty of Medicine, Cairo University. All the participants provided informed consent. The study protocol and procedures were in accordance with the ethical guidelines of the 1975 Declaration of Helsinki.
Acknowledgment
All authors acknowledge their appreciation to the staff of the Endocrinology Clinic of Kasr Al-Ainy Hospital for their assistance.
Funding
This research did not receive any funding.
Disclosure
The authors report no conflicts of interest in this work.
References
1. Afshin A, Forouzanfar MH. GBD 2015 Obesity Collaborators. Health effects of overweight and obesity in 195 countries over 25 years. N Engl J Med. 2017;377(1):13–27. doi:10.1056/NEJMoa1614362
2. Jakubiak GK, Osadnik K, Lejawa M, et al. “Obesity and insulin resistance” is the component of the metabolic syndrome most strongly associated with oxidative stress. Antioxidants. 2021;11(1):79. PMID: 35052583; PMCID: PMC8773170. doi:10.3390/antiox11010079
3. Kwon H, Kim D, Kim JS. Body fat distribution and the risk of incident metabolic syndrome: a longitudinal cohort study. Sci Rep. 2017;7(1):10955. doi:10.1038/s41598-017-09723-y
4. Fathi Dizaji B. The investigations of genetic determinants of the metabolic syndrome. Diabetes Metab Syndr. 2018;12(5):783–789. doi:10.1016/j.dsx.2018.04.009
5. Jiménez-Lucena R, Camargo A, Alcalá-Diaz JF, et al. A plasma circulating miRNAs profile predicts type 2 diabetes mellitus and prediabetes: from the CORDIOPREV study. Exp Mol Med. 2018;50(12):1–12. doi:10.1038/s12276-018-0194-y
6. Kuramoto K, He C. The secretory function of BECN1 in metabolic regulation. Autophagy. 2021;17(10):3262–3263. doi:10.1080/15548627.2021.1953849
7. Gonzalez CD, Lee MS, Marchetti P, et al. The emerging role of autophagy in the pathophysiology of diabetes mellitus. Autophagy. 2011;7(1):2–11. doi:10.4161/auto.7.1.13044
8. Jin Y, Ji Y, Song Y, et al. Depletion of adipocyte Becn1 leads to lipodystrophy and metabolic dysregulation. Diabetes. 2021;70(1):182–195. doi:10.2337/db19-1239
9. Akkoc Y, Gozuacik D. MicroRNAs as major regulators of the autophagy pathway. Biochim Biophys Acta Mol Cell Res. 2020;1867(5):118662. doi:10.1016/j.bbamcr.2020.118662
10. Miranda K, Yang X, Bam M, Murphy EA, Nagarkatti PS, Nagarkatti M. MicroRNA-30 modulates metabolic inflammation by regulating Notch signaling in adipose tissue macrophages. Int J Obes. 2018;42(6):1140–1150. doi:10.1038/s41366-018-0114-1
11. Zhang T, Tian F, Wang J, Jing J, Zhou SS, Chen YD. Endothelial cell autophagy in atherosclerosis is regulated by miR-30-mediated translational control of ATG6. Cell Physiol Biochem. 2015;37(4):1369–1378. doi:10.1159/000430402
12. Zhang X, Dong S, Jia Q, et al. The microRNA in ventricular remodeling: the miR-30 family. Biosci Rep. 2019;39(8):BSR20190788. doi:10.1042/BSR20190788
13. Hintze J. PASS 11. NCSS, LLC. Kaysville, Utah, USA; 2011. Available from: www.ncss.com.
14. Naguib M, Tarabay A, ElSaraf N, Rashed L, ElMeligy A. Beclin1 circulating level as predictor of carotid intima-media thickness in patients with type 2 diabetes mellitus. Medicine. 2021;100(28):e26630. doi:10.1097/MD.0000000000026630
15. Alberti KG, Zimmet P, Shaw J. IDF Epidemiology Task Force Consensus Group. The metabolic syndrome--a new worldwide definition. Lancet. 2005;366(9491):1059–1062. PMID: 16182882. doi:10.1016/S0140-6736(05)67402-8
16. Washko ME, Rice EW. Determination of glucose by an improved enzymatic procedure. Clin Chem. 1961;7(5):542–545. PMID: 14005104. doi:10.1093/clinchem/7.5.542
17. Lassale C, Tzoulaki I, Moons KGM, et al. Separate and combined associations of obesity and metabolic health with coronary heart disease: a pan-European case-cohort analysis. Eur Heart J. 2018;39(5):397–406. PMID: 29020414; PMCID: PMC6198928. doi:10.1093/eurheartj/ehx448
18. Xu J, Kitada M, Ogura Y, Koya D. Relationship between autophagy and metabolic syndrome characteristics in the pathogenesis of atherosclerosis. Front Cell Dev Biol. 2021;9:641852. doi:10.3389/fcell.2021.641852
19. Liu HY, Han J, Cao SY, et al. Hepatic autophagy is suppressed in the presence of insulin resistance and hyperinsulinemia: inhibition of FoxO1-dependent expression of key autophagy genes by insulin. J Biol Chem. 2009;284(45):31484–31492. PMID: 19758991; PMCID: PMC2781544. doi:10.1074/jbc.M109.033936
20. Ignacio-Souza LM, Bombassaro B, Pascoal LB, et al. Defective regulation of the ubiquitin/proteasome system in the hypothalamus of obese male mice. Endocrinology. 2014;155(8):2831–2844. doi:10.1210/en.2014-1090
21. Kovsan J, Blüher M, Tarnovscki T, et al. Altered autophagy in human adipose tissues in obesity. J Clin Endocrinol Metab. 2011;96(2):E268–E277. doi:10.1210/jc.2010-1681
22. Kim KH, Jeong YT, Oh H, et al. Autophagy deficiency leads to protection from obesity and insulin resistance by inducing Fgf21 as a mitokine. Nat Med. 2013;19(1):83–92. doi:10.1038/nm.3014
23. Yang X, Bai F, Xu Y, Chen Y, Chen L. Intensified beclin-1 mediated by low expression of mir-30a-5p promotes chemoresistance in human small cell lung cancer. Cell Physiol Biochem. 2017;43(3):1126–1139. doi:10.1159/000481754
24. Fang Y, Zou L, He W. miR-30a-5p mitigates autophagy by regulating the Beclin-1/ATG16 pathway in renal ischemia/reperfusion injury. Int J Mol Med. 2021;48(1):144. doi:10.3892/ijmm.2021.4977
25. Brandão-Lima PN, de Carvalho GB, Payolla TB, et al. Circulating microRNAs showed specific responses according to metabolic syndrome components and sex of adults from a population-based study. Metabolites. 2022;13(1):2. doi:10.3390/metabo13010002
26. Koh EH, Chernis N, Saha PK, et al. miR-30a remodels subcutaneous adipose tissue inflammation to improve insulin sensitivity in obesity. Diabetes. 2018;67(12):2541–2553. doi:10.2337/db17-1378
27. Kim JW, You YH, Jung S, et al. MiRNA-30a-5p-mediated silencing of beta2/neurod expression is an important initial event of glucotoxicity-induced beta cell dysfunction in rodent models. Diabetologia. 2013;56(4):847–855. doi:10.1007/s00125-012-2812-x
28. Weale CJ, Matshazi DM, Davids SFG, et al. Circulating miR-30a-5p and miR-182-5p in prediabetes and screen-detected diabetes mellitus. Diabetes Metab Syndr Obes. 2020;13:5037–5047. doi:10.2147/DMSO.S286081
29. Rocha EPAA, Vogel M, Stanik J, et al. Serum uric acid levels as an indicator for metabolically unhealthy obesity in children and adolescents. Horm Res Paediatr. 2018;90(1):19–27. doi:10.1159/000490113
30. Wan Mohd Zin RM, Jalaludin MY, Yahya A, et al. Prevalence and clinical characteristics of metabolically healthy obese versus metabolically unhealthy obese school children. Front Endocrinol. 2022;13:971202. doi:10.3389/fendo.2022.971202
31. Zhang P, Liao J, Wang X, Feng Z. High glucose promotes apoptosis and autophagy of MC3T3-E1 osteoblasts. Arch Med Sci. 2020;19(1):138–150. doi:10.5114/aoms.2020.101307
32. Zhang L, Cheng R, Huang Y. MiR-30a inhibits BECN1-mediated autophagy in diabetic cataract. Oncotarget. 2017;8(44):77360–77368. PMID: 29100392; PMCID: PMC5652784. doi:10.18632/oncotarget.20483
33. Jiang Q, Lagos-Quintana M, Liu D, et al. miR-30a regulates endothelial tip cell formation and arteriolar branching. Hypertension. 2013;62(3):592–598. doi:10.1161/HYPERTENSIONAHA.113.0176723
34. Saito T, Kuma A, Sugiura Y, et al. Autophagy regulates lipid metabolism through selective turnover of NCoR1. Nat Commun. 2019;10(1):1567. doi:10.1038/s41467-019-08829-3
35. Sumner AD, Sardi GL, Reed JF. Components of the metabolic syndrome differ between young and old adults in the US population. J Clin Hypertens. 2012;14(8):502–506. doi:10.1111/j.1751-7176.2012.00647.x
36. Leidal AM, Levine B, Debnath J. Autophagy and the cell biology of age-related disease. Nat Cell Biol. 2018;20(12):1338–1348. PMID: 30482941. doi:10.1038/s41556-018-0235-8
37. Deshmukh V, Farishta F, Bhole M. Thyroid dysfunction in patients with metabolic syndrome: a cross-sectional, epidemiological, Pan-India study. Int J Endocrinol. 2018;2018:2930251. PMID: 30675157; PMCID: PMC6323507. doi:10.1155/2018/2930251
38. Xin W, Yu Y, Ma Y, et al. Thyroid-stimulating hormone stimulation downregulates autophagy and promotes apoptosis in chondrocytes. Endocr J. 2017;64(7):749–757. doi:10.1507/endocrj.EJ16-0534
39. Paschos P, Paletas K. Non alcoholic fatty liver disease and metabolic syndrome. Hippokratia. 2009;13(1):9–19. PMID: 19240815; PMCID: PMC2633261.
40. Galle-Treger L, Helou DG, Quach C, et al. Autophagy impairment in liver CD11c+ cells promotes non-alcoholic fatty liver disease through production of IL-23. Nat Commun. 2022;13(1):1440. doi:10.1038/s41467-022-29174-y
41. Khambu B, Yan S, Huda N, Liu G, Yin XM. Autophagy in non-alcoholic fatty liver disease and alcoholic liver disease. Liver Res. 2018;2(3):112–119. PMID: 31123622; PMCID: PMC6528826. doi:10.1016/j.livres.2018.09.004
42. Hochreuter MY, Dall M, Treebak JT, Barrès R. MicroRNAs in non-alcoholic fatty liver disease: progress and perspectives. Mol Metab. 2022;65:101581. PMID: 36028120; PMCID: PMC9464960. doi:10.1016/j.molmet.2022.101581
43. Soussi H, Clément K, Dugail I. Adipose tissue autophagy status in obesity: expression and flux--two faces of the picture. Autophagy. 2016;12(3):588–589. PMID: 26565777; PMCID: PMC4835957. doi:10.1080/15548627.2015.1106667
 © 2023 The Author(s). This work is published and licensed by Dove Medical Press Limited. The
full terms of this license are available at https://www.dovepress.com/terms
and incorporate the Creative Commons Attribution
- Non Commercial (unported, 3.0) License.
By accessing the work you hereby accept the Terms. Non-commercial uses of the work are permitted
without any further permission from Dove Medical Press Limited, provided the work is properly
attributed. For permission for commercial use of this work, please see paragraphs 4.2 and 5 of our Terms.
© 2023 The Author(s). This work is published and licensed by Dove Medical Press Limited. The
full terms of this license are available at https://www.dovepress.com/terms
and incorporate the Creative Commons Attribution
- Non Commercial (unported, 3.0) License.
By accessing the work you hereby accept the Terms. Non-commercial uses of the work are permitted
without any further permission from Dove Medical Press Limited, provided the work is properly
attributed. For permission for commercial use of this work, please see paragraphs 4.2 and 5 of our Terms.
Recommended articles
Understanding the Role of Metabolic Syndrome as a Risk Factor for Hepatocellular Carcinoma
Chavez-Tapia NC, Murúa-Beltrán Gall S, Ordoñez-Vázquez AL, Nuño-Lambarri N, Vidal-Cevallos P, Uribe M
Journal of Hepatocellular Carcinoma 2022, 9:583-593
Published Date: 5 July 2022
Omentin as an Independent Predictor of Metabolic Syndrome and Obesity Among Adolescents in Northeast China
Sun X, Li T, Tian Y, Ren S, Li L, Li P
Diabetes, Metabolic Syndrome and Obesity 2022, 15:3913-3922
Published Date: 15 December 2022
Criteria in the Diagnosis of Metabolic Syndrome in Children: A Scoping Review

Díaz-Ortega JL, Yupari-Azabache IL, Caballero Vidal JA, Conde-Parada NE, Rojas Gamboa AF
Diabetes, Metabolic Syndrome and Obesity 2023, 16:3489-3500
Published Date: 3 November 2023
Evaluating Glycemic Control Efficacy and Safety of the Oral Small Molecule Glucagon-Like Peptide 1 Receptor Agonist Danuglipron in Type 2 Diabetes Patients: A Systemic Review and Meta-Analysis
Fatima H, Rangwala HS, Mustafa MS, Shafique MA, Abbas SR, Rizwan A, Fadlalla Ahmed TK, Arshad A
Diabetes, Metabolic Syndrome and Obesity 2023, 16:3567-3578
Published Date: 7 November 2023
Metabolic Syndrome and Tendon Disease: A Comprehensive Review
Lai C, Li R, Tang W, Liu J, Duan XD, Bao D, Liu H, Fu S
Diabetes, Metabolic Syndrome and Obesity 2024, 17:1597-1609
Published Date: 9 April 2024