Back to Journals » Drug Design, Development and Therapy » Volume 16
Chrysin Attenuates High Glucose-Induced BMSC Dysfunction via the Activation of the PI3K/AKT/Nrf2 Signaling Pathway
Received 24 August 2021
Accepted for publication 30 December 2021
Published 13 January 2022 Volume 2022:16 Pages 165—182
DOI https://doi.org/10.2147/DDDT.S335024
Checked for plagiarism Yes
Review by Single anonymous peer review
Peer reviewer comments 3
Editor who approved publication: Prof. Dr. Tin Wui Wong
Yu Li,1,2 Ximei Wang1
1Department of Plastic and Reconstructive Surgery, The First Affiliated Hospital of Zhengzhou University, Zhengzhou, People’s Republic of China; 2Department of Hand, Plastic and Reconstructive Surgery, Burn Center-Hand and Plastic Surgery, University of Heidelberg, BG Trauma Center Ludwigshafen, Ludwigshafen, Germany
Correspondence: Ximei Wang
Department of Plastic and Reconstructive Surgery, The First Affiliated Hospital of Zhengzhou University, No. 1 Longhu Middle Ring Road, Zhengzhou, 450018, People’s Republic of China
Tel +86 371-66278102
Email [email protected]
Purpose: High glucose environment in diabetes mellitus induces the dysfunction of bone marrow-derived mesenchymal stromal cells (BMSCs) and impairs bone regeneration. Chrysin is a natural polyphenol with outstanding anti-inflammation and anti-oxidation ability. However, whether and how chrysin affects BMSCs in high glucose conditions remain poorly understood. The present study aimed to explore the effects and underlying mechanisms of chrysin on the BMSCs exposed to high glucose environment.
Materials and Methods: Cell viability was detected by cell counting kit 8 assay and 5-ethynyl-2’-deoxyuridine staining, while cell apoptosis was determined through flow cytometry using Annexin V-FITC/PI kit. The oxidative stress in BMSCs was evaluated by detecting the reactive oxygen species production, malondialdehyde content, and superoxide dismutase activity. Alkaline phosphatase staining, Alizarin Red staining, and quantitative real-time PCR were performed to determine the osteogenic differentiation. Western blot was used to examine the expression of the PI3K/ATK/Nrf2 signaling pathway. Furthermore, chrysin was injected into calvarial defects of type 1 diabetic SD rats to assess its in vivo bone formation capability.
Results: Chrysin reduced oxidative stress, increased cell viability, and promoted osteogenic differentiation in BMSCs exposed to high glucose. Blocking PI3K/ATK/Nrf2 signaling pathway weakened the beneficial effects of chrysin, indicating that chrysin at least partly worked through the PI3K/ATK/Nrf2 pathway.
Conclusion: Chrysin can protect BMSCs from high glucose-induced oxidative stress via the activation of the PI3K/AKT/Nrf2 pathway, and promote bone regeneration in type 1 diabetic rats.
Keywords: chrysin, type 1 diabetes mellitus, hyperglycemia, bone regeneration
Introduction
Type 1 diabetes mellitus (T1DM) is a metabolic disorder characterized by insufficient insulin secretion and increased blood glucose levels, primarily due to the destruction of pancreatic β cells, as a result of an autoimmune reaction. T1DM is a common disease, and its incidence worldwide is increasing. In 2019, more than 40 million individuals were diagnosed with T1DM, and this number is estimated to hit more than 50 million by 2030.1 The high blood sugar level disrupts cell metabolism and lead to a series of pathological changes in the bones, including decreased bone turnover, glycation of type I collagen, and deposition of lipids, which greatly decrease the structural and material integrity of bone.2,3 Compared with nondiabetic individuals, patients with T1DM exhibit lower whole-body bone mineral density, poorer bone mechanical strength, and a higher risk of osteoporosis and fracture.3,4 Moreover, the decreased bone turnover and osteopenia in T1DM patients often result in impaired bone regeneration, making bone repair in these patients challenging.5 The establishment of novel treatment regimens to improve bone formation under T1DM conditions is a matter of pressing concern.
The specific mechanism through which T1DM impairs bone regeneration is unclear as of yet. However, one primary manifestation in the T1DM diabetic process is that the increased oxidative stress in T1DM induces the dysfunction of mesenchymal stromal cells (MSCs).6 MSCs are mesoderm-derived cells with a self-renewing ability and the potential to differentiate into multiple cells, they play a pivotal role in bone regeneration: they migrate to the defect area, secrete trophic factors, differentiate into osteoblasts, and form new bone tissue. Sustained hyperglycemia triggers cellular innate immune responses, increases mitochondrial oxygen consumption, and activates reactive oxygen species (ROS)-producing enzymes present outside the mitochondrion, leading to the overproduction of ROS.7 Excessive ROS results in oxidation of cysteine residues in functional proteins, activate alternative downstream signaling pathways, and cause cell dysfunction. In line with these findings, previous studies have demonstrated that antioxidants could significantly alleviate the adverse effects of diabetes on the viability, proliferation, migration, and osteogenic differentiation of the MSCs in vitro and promote bone regeneration in animal models.8,9
Chrysin (5,7-dihydroxy-2-phenyl-4H-chromen-4-one) is a natural polyphenol and the primary active component of various medicinal herbs, including Radix scutellariae and Salvadora persica.10 Based on its structural classification, chrysin belongs to the dihydroxyflavones category, characterized by the hydroxyl groups in the A aromatic ring. The free radical scavenging capacity of chrysin can be attributed to the absence of oxygenation in their B and C-rings as in the carbonyl group on C-4.11 It has been indicated that chrysin may activate antioxidant enzymes, increase mitochondrial permeability, regulate glutathione levels and restore mitochondrial dysfunction in diabetes mellitus, alleviating the complications of diabetes mellitus including neuropathy, retinopathy, and cardiomyopathy.11,12 Furthermore, recent studies showed that chrysin also exhibited osteogenic potential. Zeng et al found that chrysin treatment promoted the expression of osteogenesis genes as well as the formation of mineralized nodules in preosteoblast MC3T3-E1 cells via activation of ERK/MAPK pathway.13 Huo et al reported that chrysin could increase the osteogenic differentiation of human dental pulp stem cells via upregulation of the Smad3 pathway and promoted bone regeneration in a rat calvarial defect model.14 Besides, chrysin was reported to protect ovariectomized rats against bone loss through enhancing bone mineral contents and inhibiting bone resorption.15 However, the effect of chrysin on bone regeneration under T1DM conditions is still unclear as of yet.
The PI3K/Akt pathway is a common pathway and modulates multiple cellular biological processes, including energy metabolism, cellular biosynthesis, proliferation and differentiation. The PI3K/Akt pathway is an important upstream regulator of Nrf2, a master regulator of the antioxidant response.16 Nrf2 activation protects cells from oxidative stress manner by increasing the expressions of a wide array of antioxidant enzymes, including heme oxygenase-1 (HO-1) and superoxide dismutase (SOD).17 It was reported that chrysin could activate the PI3K/Akt pathway in neuroblastic cells treated with oxygen-glucose deprivation and recovery, as well as attenuate high-fat-diet-induced myocardial oxidative through via upregulating Nrf2.18 It may be possible that chrysin could protect stem cells from high glucose-induced oxidative stress through activating the PI3K/ATK/Nrf2 signaling pathway.
The present study aimed to investigate whether chrysin could attenuate the dysfunction of bone marrow-derived mesenchymal stem cells (BMSCs) caused by high glucose levels. The effects of chrysin on the proliferation, apoptosis and osteogenic differentiation of BMSCs cultured in a high glucose culture medium were first evaluated. Furthermore, the impacts of chrysin on ROS production and PI3K/ATK/Nrf2 signaling pathway were also examined in an attempt to explore the possible mechanism. Moreover, chrysin was injected into critical-sized calvarial defects in T1DM rats to assess its capability of enhancing bone regeneration in vivo.
Materials and Methods
Components of Culture Media
Low glucose culture media was composed of low glucose Dulbecco’s Modified Eagle’s media (DMEM, 5.5 mM/L), 10% fetal bovine serum, and 1% penicillin‑streptomycin (All Sigma-Aldrich, St Louis, MO, USA). The components of high glucose culture media were the same as those of low glucose culture media except for the glucose concentration (25 mM/L). Low glucose osteogenesis inducing media was composed of low glucose DMEM, 10% fetal bovine serum, 1% penicillin‑streptomycin, 50 mg/mL of ascorbic acid, 10 mM β‑glycerophosphate, and 100 nM dexamethasone. The components of high glucose osteogenesis inducing media were the same as those of low glucose osteogenesis inducing media except for the glucose concentration.
Isolation and Culture of BMSCs
BMSCs were collected from the bone marrow of the femurs of SD rats. All procedures were approved by the Animal Care and Use Committee of the First Affiliated Hospital of Zhengzhou University (no. 2021-024). Briefly, both ends of the femurs were cut off by sterile operation scissors, and the bone marrow was flushed out with low glucose culture media. The resultant suspension was centrifuged at 300 g for 5 min, and the cell pellet was diluted with low glucose culture media. The cells were cultured in T-75 flasks at 37 °C in a humidified incubator containing 5% CO2, and culture media were changed every three days. The reported optimum concentration of chrysin for osteogenic differentiation varied from 0.01 µM to 25 µM.13,14,19 We decided to investigate the effects of chrysin at 0.2 µM – 5 µM based on our pre-experiments.
Experiment Groups for the in vitro Study
Diabetic BMSCs were used in the LG (D), HG (D), HG+0.2 (D), HG+1 (D), HG+5 (D), and HG+chrysin (D) groups; in the other groups, experiments were performed on normal BMSCs. In the LG and LG (D) groups, cells were cultured in low glucose media, while cells in the HG and HG (D) groups were treated with high glucose media. In the HG+0.2, HG+1, HG+5, and HG+chrysin groups, cells were incubated in high glucose media supplemented with 0.2 μM, 1 μM, 5 μM, and 5 μM chrysin, respectively. Diabetic BMSCs in HG+0.2 (D), HG+1 (D), HG+5 (D), and HG+chrysin (D) groups received the same treatment with the cells in HG+0.2, HG+1, HG+5, and HG+chrysin groups, respectively.
Cell Viability Assay
BMSCs viability was evaluated using the CCK‑8 assay and EdU incorporation assay (Both Beyotime Institute of Biotechnology, Shanghai, China). For the CCK‑8 assay, BMSCs were seeded on 96‑well plates at a density of 3×10³ cells/well. Following cell adhesion to the plates, wells were randomly treated with different reagents. At predetermined time points (3 days or 5 days), the culture media was removed and cells were washed with PBS. After that, 100 μL fresh culture media and 10 μL CCK‑8 solution were added to each well. Subsequently, the plates were incubated at 37°C for 30 min. Then, absorbance was detected at 450 nm by a microplate reader (Thermo, MA, USA). For the EdU assay, BMSCs were seeded on 24‑well plates at a density of 2.5×10⁴ cells/well and randomly treated with different reagents for 3 days. After 60% confluence, cells were incubated with 50 μM EdU media for 2 h in dark, fixed in 4% paraformaldehyde for 30 min, and then stained by DAPI (Beyotime) for 30 min. The EdU-stained cells were photoed by a fluorescence microscope (Carl Zeiss Meditec, Jena, Germany). The cell positive rate of each well was calculated by counting the EdU-positive nuclei (red) and blue fluorescent nuclei in five random microscopic fields.
Cell Apoptosis Assay
An Annexin V-FITC/PI apoptosis detection kit (Dojindo, Kumamoto, Japan) was used to detect cell apoptosis according to the manufacturer’s protocols. Briefly, after 3 days of incubation, BMSCs were harvested by trypsin digestion, washed two times with ice‑cold PBS, and resuspended with binding buffer. 5 µL of Annexin V solution and 5 µL of PI solution were added to 100 µL of cell suspension, and the mixture was incubated in darkness for 15 min. The percentage of apoptotic cells was detected by A FACSCalibur flow cytometer (BD Biosciences, NJ, USA).
Alkaline Phosphatase Staining
BMSCs were seeded on 24‑well plates at a density of 2.5×10⁴ cells/well. After 80% confluence of cells, wells were randomly divided into different groups. After 14 days of osteogenic induction, BMSCs were washed three times with PBS, fixed with 4% paraformaldehyde for 30 min, and incubated with alkaline phosphatase (ALP) staining solution (Beyotime) for 10 min. The stained mineralized nodules were desorbed with 10% (w/v) cetylpyridinium chloride (Aladdin, Shanghai, China), and the absorbance was measured at 570 nm.
Alizarin Red Staining
BMSCs were seeded on 24‑well plates at a density of 2.5×10⁴ cells/well. After 80% confluence of cells, wells were randomly divided into different groups. After 21 days of osteogenic induction, BMSCs were washed three times with PBS, fixed with 4% paraformaldehyde for 30 min, and incubated with Alizarin Red S (ARS) solution (Beyotime) for 10 min. The ARS staining was extracted with 10% (w/v) cetylpyridinium chloride, and the OD value was measured at 570 nm.
mRNA Extraction and Real-Time Polymerase Chain Reaction (PCR)
BMSC were seeded on 6‑well plates at a density of 1×10⁵ cells/well. After 80% confluence of cells, BMSCs were randomly treated with different reagents. After 14 days of osteogenic induction, 0.5 mL of TRIzol® reagent (Aladdin) was added to each well and the plates were shaken gently for one minute. Furthermore, mRNA dissolved in the TRIzol® reagent was isolated via centrifugation (12,000 x g/min) at 4°C for 15 min. cDNA will be synthesized from mRNA using an RT kit (Beyotime). Primers for ALP, runt-related transcription factor 2 (RUNX2), osteopontin (OPN), osteocalcin (OCN), collagen type I (COL1), bone morphogenetic protein 2 (BMP2), and GAPDH were purchased from BioTNT (BioTNT, Shanghai, China) and listed in Table 1. The thermocycling conditions are as follows: Initial denaturation at 95°C for 5 min, 40 cycles of denaturation at 95°C for 30 sec, annealing at 58°C for 30 sec and extension at 72°C for 45 sec. The relative mRNA expression was calculated using the 2‑ΔΔCq method. The GADPH gene will be used as the internal control.
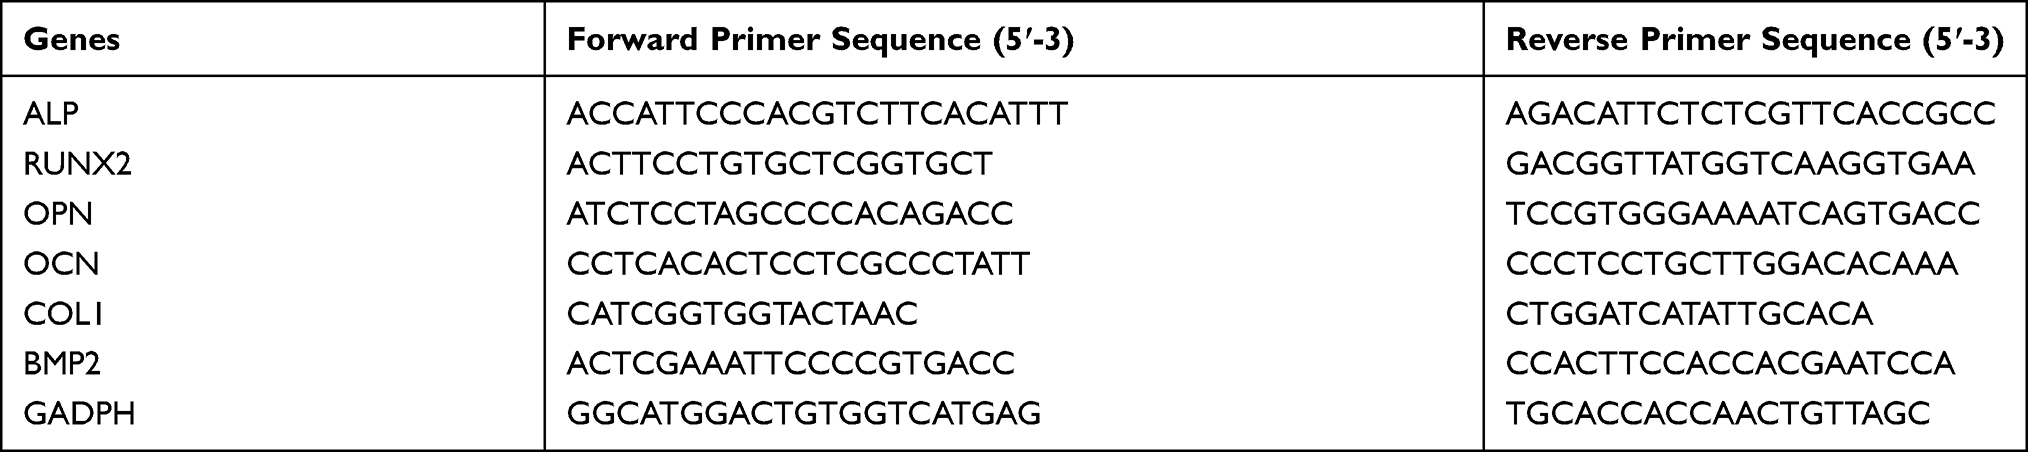 |
Table 1 Primer Sequences for RT-qPCR |
ROS, MDA, and SOD Assays
Intracellular ROS level was detected using a fluorescent dye DCFH-DA according to the manufacturer’s protocols (Beyotime). Briefly, after 3 days of incubation, BMSCs were washed with warm PBS, incubated in 10 uM DCFH-DA for 30 min at 37 °C, and washed twice with PBS. Then, the fluorescence (excitation 488 nm, emission 525 nm) was examined by a fluorescence plate reader (Molecular Devices, Sunnyvale, CA). As reliable markers of oxidative stress, malondialdehyde (MDA) level and superoxide mutase (SOD) activity in BMSCs were also measured using commercial kits according to the manufacturer’s protocols (Beyotime) after 3 days of incubation.
Western Blot
BMSC were seeded on 6‑well plates at a density of 1×10⁵ cells/well. After 80% confluence of cells, BMSCs were randomly treated with different reagents. The incubation time for the PI3K/AKT/Nrf2 pathway was 3 days, while for osteogenic differentiation, it was 14 days. Briefly, BMSCs were lysed by radio-immunoprecipitation assay (RIPA) lysis buffer containing 1% protease inhibitors, and the protein concentration was quantified by using an Enhanced BCA Protein Assay Kit (all Beyotime). Equal amounts of protein (20 μg/lane) were resolved on sodium dodecyl sulfate-polyacrylamide gel electrophoresis and transferred onto 0.22 μm PVDF membranes. Then, the transferred membranes were blocked in 5% BSA at room temperature for 2 h and incubated with primary antibodies (Santa Cruz Biotechnology, CA, USA) overnight at 4°C. The membranes were washed with PBST containing 0.05% Tween (Aladdin) three times followed by incubation with the corresponding horseradish peroxidase‑conjugated secondary antibody for 1 h at 37°C. Protein bands were visualized using ECL reagents and then scanned with the Image Quant LAS4000 system (Cytiva, USA). Protein expression levels were semi‑quantified using Gel‑Pro Analyzer software (version 4.0; Media Cybernetics, Inc.), with the expression of GAPDH as the control.
Block of PI3K/AKT Pathway
A PI3K/AKT signaling inhibitor, LY294002, was used to verify the involvement of the PI3K/AKT signaling pathway according to the manufacturer’s instructions (Sigma). BMSCs in the HG+chrysin+LY294002 group were continuously incubated in 10 µM LY294002 until the end of the related experiments.20,21
Preparation of DBM
Decalcified bone matrix (DBM) was made from bovine limbs, which were decalcified and deproteinized as previously described.22 DBM was cut into a cylindrical shape (diameter 5 mm, thickness 2 mm) before being used for the animal experiment.
Establishment of the Rat T1DM Model
All animal experiments were approved by the Animal Care and Use Committee of the First Affiliated Hospital of Zhengzhou University (no. 2021–024) and performed according to the Guidelines for the Use of Laboratory Animals by the National Institutes of Health. Animal studies are performed and reported in compliance with the ARRIVE guidelines.23 8-week-old male Sprague Dawley rats (totally n = 40) weighing 280–310 g were purchased from the Animal Center of Zhengzhou University. Rats were housed separately in a stable environment (temperature: 20~25 °C; humidity: 50%~60%) with a 12:12 hour light-dark cycle and were fed with water and a standard rodent diet (fat: 10% of calories; protein 20% of calories; carbohydrate: 70% of calories). All animal experiments were performed and analyzed by blinded experimenters. 30 randomly selected rats were used for establishing the type 1 diabetic model, which was induced by intraperitoneal injections of streptozotocin (Sigma; 65 mg/kg). After 1 and 2 weeks, the blood glucose of these rats was examined. The rats, whose blood glucose concentration was higher than 16.7 mM/L, were diagnosed with T1DM. Eighteen T1DM rats were randomly assigned to a blank group (no scaffold, n=6), a scaffold group (DBM scaffold seeded with BMSCs), and a scaffold + chrysin group (DBM scaffold seeded with BMSCs + chrysin). Six normal rats and six T1DM rats were randomly selected for BMSCs isolation.
Animal Surgical Procedures
The rats were anesthetized with intraperitoneal injections of a mixture of ketamine (80 mg/kg; Bayer Korea, Seoul, Korea)–xylazine (8 mg/kg; Bayer Korea). After the rats were anesthetized, a longitudinal skin incision was made on their scalp and their parietal bones were separated from the muscles by blunt dissection. Then, a circular calvarial defect with a 5 mm diameter was created using a trephine drill under copious saline solution, and materials were gently implanted into the bone defect. After the skin was sutured, the defect area was found by gently touching the edge of the calvaria. Then, the skin above the defect area was marked. Chrysin solution or PBS was injected under the central area of the marked skin. 100 µL of chrysin solution was injected into the defect area in the scaffold + chrysin group every 3 days in the first month after surgery, while rats in the two other groups received 100 µL of PBS. Eight weeks after surgery, rats were euthanized with sodium pentobarbital solution (Bayer Korea) via intraperitoneal injection at a dose of 250 mg/kg. The bone tissues in the defect area were collected and washed 3 times with PBS.
Micro-CT Measurements
The specimens were scanned using a micro-CT system (GEe Xplore Locus SP Micro-CT: GE Healthcare, Milwaukee, WI, USA), and the scan resolution was 10 μm. 3D reconstruction and morphometric parameters were analyzed using the CTAn software (Bruker Corporation, Kontich, Belgium).
Histological Analysis
After being fixed in 4% paraformaldehyde for 3 days, the specimens were immersed in 10% EDTA (Beyotime) and gently shaken for 4 weeks for decalcification at room temperature. Following the decalcification, the specimens were dehydrated with an increasing gradient concentration of ethanol (50, 70, 80, 90, and 100%) and embedded in paraffin (Aladdin). Sections of 5-μm thickness were cut using a schistosome, incubated overnight at 60°C, stained with hematoxylin and eosin (H&E) (Beyotime), and examined by light microscopy.
Statistical Analysis
Data are presented as the mean ± standard deviation. The Shapiro–Wilk test was used to check the normality of the data using GraphPad Prism 9 (GraphPad Software, USA). The data obeyed normal distribution was examined for statistical significance by one‑way or two-way ANOVA with Tukey’s post-hoc using GraphPad Prism 9. P<0.05 was considered to indicate a statistically significant difference.
Results
Chrysin Promoted the Proliferation but Decreased the Apoptosis of BMSCs Exposed to High Glucose
The proliferation of BMSCs receiving different treatments was assessed using EdU staining (Figure 1A). The LG group showed the most EdU-positive cells among the five groups, whereas the HG+5 group exhibited much more EdU-positive cells than the HG HG+0.2 and HG+1 groups. The EdU-positive rate of the HG+1 group was slightly higher than that of the HG group, but there was no significant difference (Figure 1C). Furthermore, the CCK-8 assay was performed to detect the cell viability. Figure 1D showed that high glucose greatly inhibited the proliferation of BMSCs on days 3 and 5. The OD value of the HG+0.2 group was a bit higher than the LG group on days 3 and 5, but no significant differences were observed. The HG+5 groups showed a significantly higher OD value than the HG group on both days 3 and 5. However, the OD value of the HG+5 group was still significantly lower than that of the LG group on day 5.
 |
Figure 1 Chrysin improved proliferation but decreased apoptosis in BMSCs exposed to high glucose. (A) Cell proliferation was checked by EdU staining. Scale bar: 50 μm. (B) Cell apoptosis was evaluated by the Annexin V/PI assay. (C) The semi-quantitative result of EdU staining. (D) Cell viability was examined by the CCK-8 assay. (E) Quantitative analysis of cell apoptosis rate. Notes: *p<0.05 vs the LG group. #p<0.05 vs the HG group. |
As shown in Figure 1B, the proportion of apoptotic cells was significantly increased in the high glucose-treated group. However, there were considerably fewer apoptotic cells in the HG+1 and HG+5 groups compared with the HG group. Moreover, the quantitative analysis also indicated that 1 µM and 5 µM chrysin notably decreased the percentage of apoptotic BMSCs (Figure 1E). In general, chrysin reversed the negative effects of high glucose on cell survival in a dose‑dependent manner.
Chrysin Improved the Osteogenic Differentiation of BMSCs Exposed to High Glucose
Reduced ALP activity (ALP staining) and mineralized nodule formation (ARS staining) were observed in the HG group compared with the LG group, in which cells were treated with low glucose culture media (Figure 2A). However, the impaired ALP activity and mineralized nodule formation of BMSCs caused by high glucose were partially reversed by chrysin treatment: both the amount of ALP and ARS staining was increased by chrysin treatment in a dose-dependent manner (Figure 2B and C).
 |
Figure 2 Chrysin promoted osteogenesis in BMSCs exposed to high glucose. (A) ALP staining was performed to detect early-stage osteogenesis and Alizarin Red staining was performed to evaluate calcium deposition in BMSCs. (B) The semi-quantitative result of ALP staining. (C) The semi-quantitative result of Alizarin Red staining. The gene expressions of ALP (D), RUNX2 (E), OPN (F), OCN (G), COL1 (H), and BMP2 (I) in BMSCs were checked by PCR. Notes: *p<0.05 vs the LG group. #p<0.05 vs the HG group. |
Figure 2D–I showed that high glucose media greatly inhibited the mRNA expression levels of ALP, RUNX2, OPN, OCN, COL1, and BMP2 compared with low glucose media after a 14-day incubation period. BMSCs treated with 0.2 µM chrysin showed considerably higher expression levels of ALP and RUNX2 than BMSCs in the HG group. However, no significant differences in OPN, OCN, COL1, and BMP2 expression were found between the HG and HG+0.2 groups. Treatment with 1 µM chrysin significantly reversed the inhibitory effects of high glucose on the expressions of ALP, RUNX2, OPN, COL1, and BMP2, while 5 µM significantly increased the expression levels of all the aforementioned genes.
Chrysin Relieved High Glucose-Mediated ROS Overproduction and Activated the PI3K/AKT/Nrf2 Signaling Pathway in BMSCs Exposed to High Glucose
The fluorescence intensity of BMSCs treated with different reagents was detected to examine the ROS overproduction. As shown in Figure 3A, the fluorescence intensity of the LG group was much lower than that of the HG group. The fluorescence intensity of both the HG+1 and HG+5 groups was significantly lower than that of the HG group. Although the fluorescence intensity of the HG+0.2 group was lower than that of the HG group, no significant differences were found between the two groups. Alterations in MDA contents were similar to those observed with the DCFH fluorescence intensity analysis (Figure 3B). Chrysin at 1 and 5 µM significantly alleviated the increase of MDA contents caused by high glucose. Furthermore, chrysin reversed the inhibition effects of high glucose on the SOD activity in a dose-dependent manner (Figure 3C).
 |
Figure 3 Chrysin decreased ROS production in BMSCs by activating the PI3K/Akt/Nrf2 pathway. (A) The ROS levels in BMSCs exposed to high glucose were detected by flow cytometry. (B) MDA contents in BMSCs were checked. (C) SOD levels in BMSCs were examined. (D) The effect of chrysin on the PI3K/ATK pathway was examined by Western blotting. (E) The effect of chrysin on the Nrf2/HO-1 pathway was examined by Western blotting. Semi-quantitative analysis of contents of PI3K (F), Nrf2 (G), and HO-1 (H). Notes: *p<0.05 vs the LG group. #p<0.05 vs the HG group. |
The effects of high glucose on the PI3K/AKT signaling pathway in BMSCs are shown in Figure 3D. High glucose media significantly decreased p-AKT levels in BMSCs, but the p-AKT expression levels were increased by chrysin in a dose‑dependent manner. Both the HG+1 and HG+5 groups showed significantly higher p-AKT levels than the HG group (Figure 3F). Furthermore, the effects of treatment with various concentrations of chrysin on the Nrf2/HO-1 pathway were evaluated (Figure 3E). Similar to the results of the PI3K/AKT pathway, chrysin reversed the inhibitory effects of high glucose on the Nrf2 and HO-1 levels in a dose-dependent manner. The quantitative analysis indicated that both the HG+1 and HG+5 groups showed significantly higher Nrf2 and HO-1 levels than the HG groups (Figure 3G–H).
The Enhanced Viability of BMSCs Treated with Chrysin Was Partially Inhibited by Inhibition of the PI3K/AKT Pathway
To verify the involvement of the PI3K/AKT signaling pathway, BMSCs were incubated with the inhibitor of PI3K (LY294002). As shown in Figure 4A, the increased proliferation induced by chrysin treatment (5 µM) in BMSCs was significantly decreased by LY294002. Although the average positive rate of the LY294002-treated group was higher than that of the HG group, but there was no significant difference (Figure 4C), the CCK-8 assay also showed the LY294002 greatly decreased the cell viability (Figure 4D). The OD value of the HG+Chrysin+LY294002 group was significantly lower than that of the HG+chrysin group on days 3 and 5; its OD value was significantly higher than the HG group on day 5, but no significant differences were found between the two groups on day 3. Moreover, the protective effects of chrysin on cells from apoptosis were also offset by LY294002 (Figure 4B). The cell apoptotic rate in the LY294002 treated group was slightly lower than that in the HG group; however, no significant difference was found between the two groups (Figure 4E).
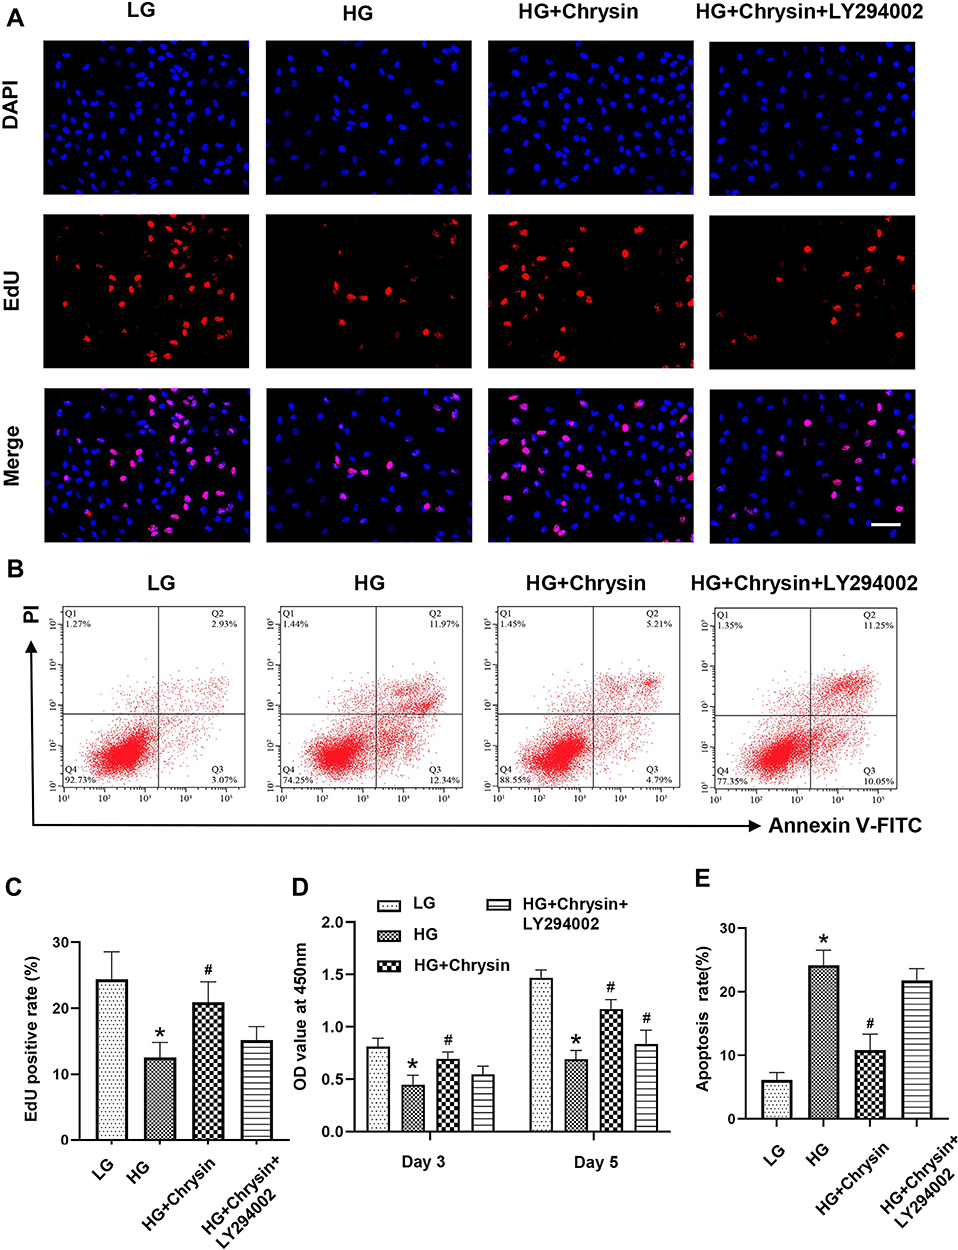 |
Figure 4 The beneficial effects of Chrysin on cell proliferation and survival were partially blocked by LY294002. (A) Cell proliferation was checked by EdU staining. Scale bar: 50 μm. (B) Cell apoptosis was evaluated by the Annexin V/PI assay. (C) The semi-quantitative result of EdU staining. (D) Cell viability was examined by the CCK-8 assay. (E) Quantitative analysis of cell apoptosis rate. Notes: *p<0.05 vs the LG group. #p<0.05 vs the HG group. |
PI3K/AKT Signaling Inhibitor Partially Offset the Enhanced Osteogenic Differentiation of BMSCs Induced by Chrysin
The levels of ALP activity and mineralized nodule formation in BMSCs treated with LY294002 were significantly decreased compared with those of the HG+chrysin group (Figure 5A–C). However, the ALP activity of the HG+chrysin+LY294002 group was still significantly higher than that of the HG group, and its mineralization was also slightly better than the HG group. Moreover, LY294002 significantly reversed the beneficial effects of chrysin on the gene expression levels of ALP, BMP2, COL1, OCN, OPN, and RUNX2 in BMSCs exposed to high glucose (Figure 5D–I). Interestingly, cells in the LY294002-treated group still exhibited significantly higher gene expression levels of ALP and RUNX2.
 |
Figure 5 The beneficial effects of Chrysin on osteogenesis were partially blocked by LY294002. (A) ALP staining was performed to detect early-stage osteogenesis and Alizarin Red staining was performed to evaluate calcium deposition in BMSCs. (B) The semi-quantitative result of ALP staining. (C) The semi-quantitative result of Alizarin Red staining.The gene expressions of ALP (D), RUNX2 (E), OPN (F), OCN (G), COL1 (H), and BMP2 (I) in BMSCs were checked by PCR. Notes: *p<0.05 vs the LG group. #p<0.05 vs the HG group. |
PI3K/AKT Signaling Inhibitor Partially Offset the Decreased ROS Generation Induced by Chrysin
As shown in Figure 6A, the fluorescence intensity of the BMSCs treated with LY294002 and chrysin was considerably higher than that of the BMSCs treated only with chrysin. The quantitative analysis showed that the DCFH fluorescence intensity of the HG+ Chrysin+LY294002 group was notably higher than that of the HG+chrysin group but a bit lower than that of the HG group. The results of the MDA assay were in line with that of the flow cytometry analysis, LY294002 partly offset the inhibition effects of chrysin on MDA level in BMSCs (Figure 6B). The SOD level of the LY294002-treated group was significantly lower than that of the HG+chrysin group and similar to that of the HG group (Figure 6C). The HG+Chrysin+LY294002 group showed a significantly lower expression of AKT than the HG+Chrysin group (Figure 6D and F); however, no significant differences in the Nrf2 and HO-1 levels were observed among these two groups (Figure 6E, G, and H).
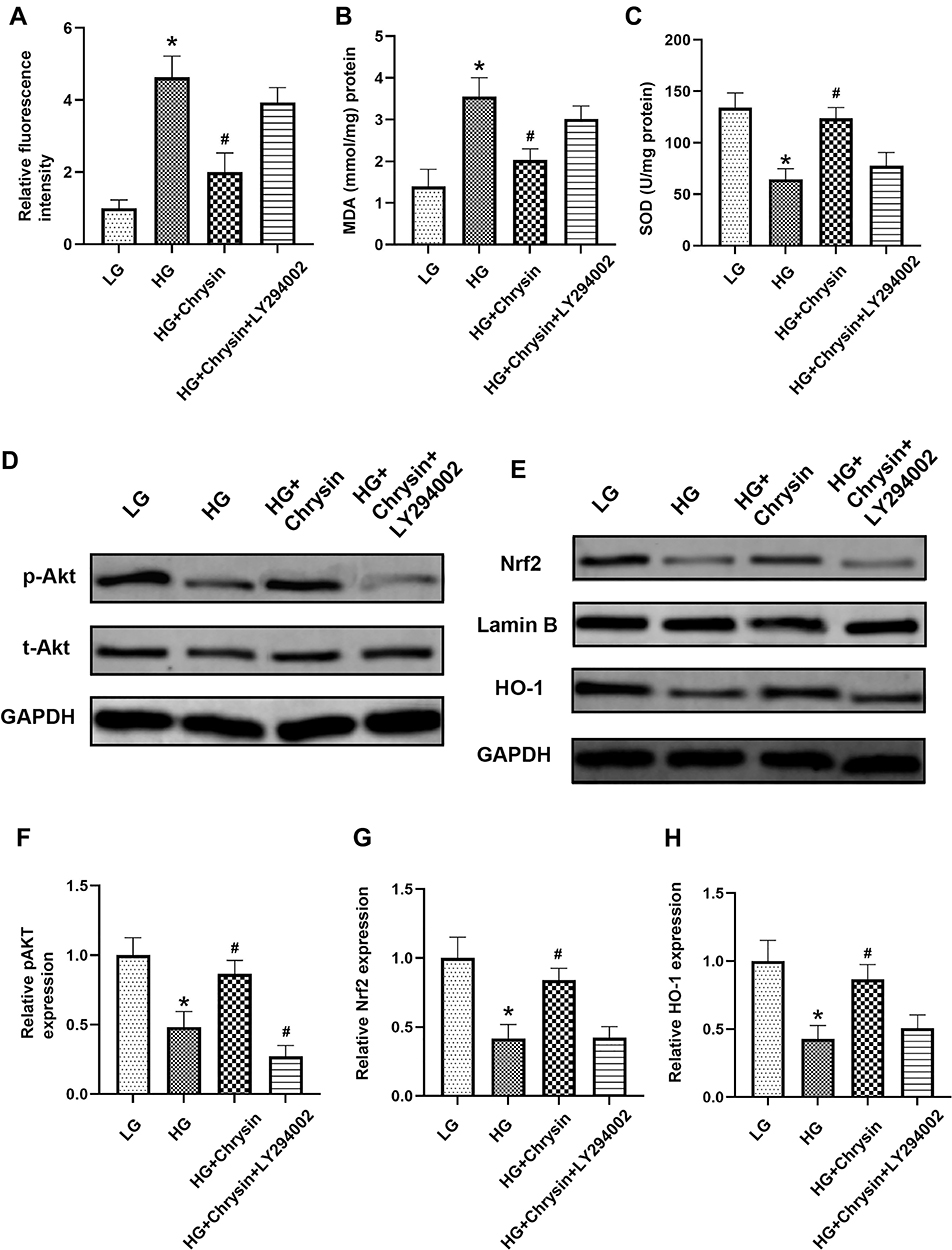 |
Figure 6 LY294002 increased ROS production and blocked the PI3K/Akt/Nrf2 pathway in BMSCs treated with chrysin. (A) The ROS levels in BMSCs exposed to high glucose were detected by flow cytometry. (B) MDA contents in BMSCs were checked. (C) SOD levels in BMSCs were examined. (D) The effect of chrysin on the PI3K/ATK pathway was examined by Western blotting. (E) The effect of chrysin on the Nrf2/HO-1 pathway was examined by Western blotting. Semi-quantitative analysis of contents of PI3K (F), Nrf2 (G), and HO-1 (H). Notes: *p<0.05 vs the LG group. #p<0.05 vs the HG group. |
Chrysin Accelerated Bone Healing in the Rat Calvarial Bone Defect Model
To evaluate the in vivo bone formation capability of chrysin, 5mm-sized calvarial bone defects were created in the T1DM rat model (Figure 7A). Micro-CT measurement showed that robust bone regeneration was found in the cells and cells+chrysin groups (Figure 7B). The quantitative analysis indicated that the cells+chrysin group had the biggest new bone tissue volume, thickest trabecular, and highest mineral density in the defect area among the three groups (Figure 7C). Besides, the trabecular number of the cells+chrysin was also much more than that of the blank group. Consistent with the micro-CT results, a large amount of eosin-stained newly formed bone tissue could be found in the cells+chrysin group, while only a small amount of newly formed bone tissue could be found in the blank group (Figure 7D). Furthermore, Western blot was performed to determine the expression of late-stage osteogenesis protein OCN (Figure 7E). The expression of OCN in the cells+chrysin group was much higher than that in the blank and cells group (Figure 7F).
 |
Figure 7 Local delivery of chrysin promoted in vivo bone regeneration in T1DM rats. (A) A 5-mm defect was made in rat calvaria. (B) The 3D reconstruction images of rat calvarial bone after 8 weeks of implantations. (C) Bone volume/total volume (BV/TV), trabecular thickness (Tb.Th), trabecular number (Tb.N), and bone mineral density (BMD) were calculated based on the micro-CT data. (D) H&E stained sections of bone tissues in the defect area. Scale bar: 250 μm. (E) The expression of OCN in the defect area was detected by Western blotting. (F) Semi-quantitative analysis of the content of OCN. Notes: *p<0.05 vs the blank group. #p<0.05 vs the cells group. |
Chrysin Improved the Osteogenic Potential of BMSCs from Type 1 Diabetic Rats
As shown in Figure 8A, chrysin increased the viability of diabetic BMSCs in a dose-dependent manner and Chysin at 5 µM could significantly alleviate the negative effects of high glucose. Compared with normal BMSCs, diabetic BMSCs exhibited lower viability under low glucose conditions but similar viability under high glucose conditions (Figure 8B). Chrysin could improve the viability of both normal and diabetic BMSCs under high glucose conditions, but the viability of diabetic BMSCs treated with chrysin was significantly lower than that of the normal BMSCs treated with chrysin after 5-day incubation. Diabetic BMSCs showed slightly higher intracellular ROS levels than normal BMSCs both under the low and high glucose conditions, but there were no significant differences (Figure 8C). The MDA content in normal BMSCs was significantly lower than that in the diabetic BMSCs in low glucose media, but they had no significant difference in MDA content when cultured in high glucose media (Figure 8D). Chrysin significantly decreased the ROS production and MDA content in diabetic BMSCs exposed to high glucose, but the oxidative stress in those cells was still much higher than the normal BMSCs in the HG+chrysin group. Diabetic BMSCs exhibited significantly lower protein levels of COL1 and OCN than normal BMSCs when they were incubated in low glucose media (Figure 8E and F). Interestingly, the levels of all the examined osteogenic proteins in the diabetic BSMCs were significantly lower than those in the normal BMSCs under high glucose condition. No matter cultured in the low or high glucose media, diabetic BMSCs exhibited significantly lower gene expression levels of ALP, RUNX2, and OCN than normal BMSCs (Figure 8G). Chrysin significantly elevated the protein and gene expressions of RUNX2 and OCN, as well as the ALP gene expression in the diabetic BMSCs exposed to high glucose. However, the expression levels of all the osteogenic proteins and genes in the HG+chrysin (D) group were significantly lower than those in the HG+chrysin group.
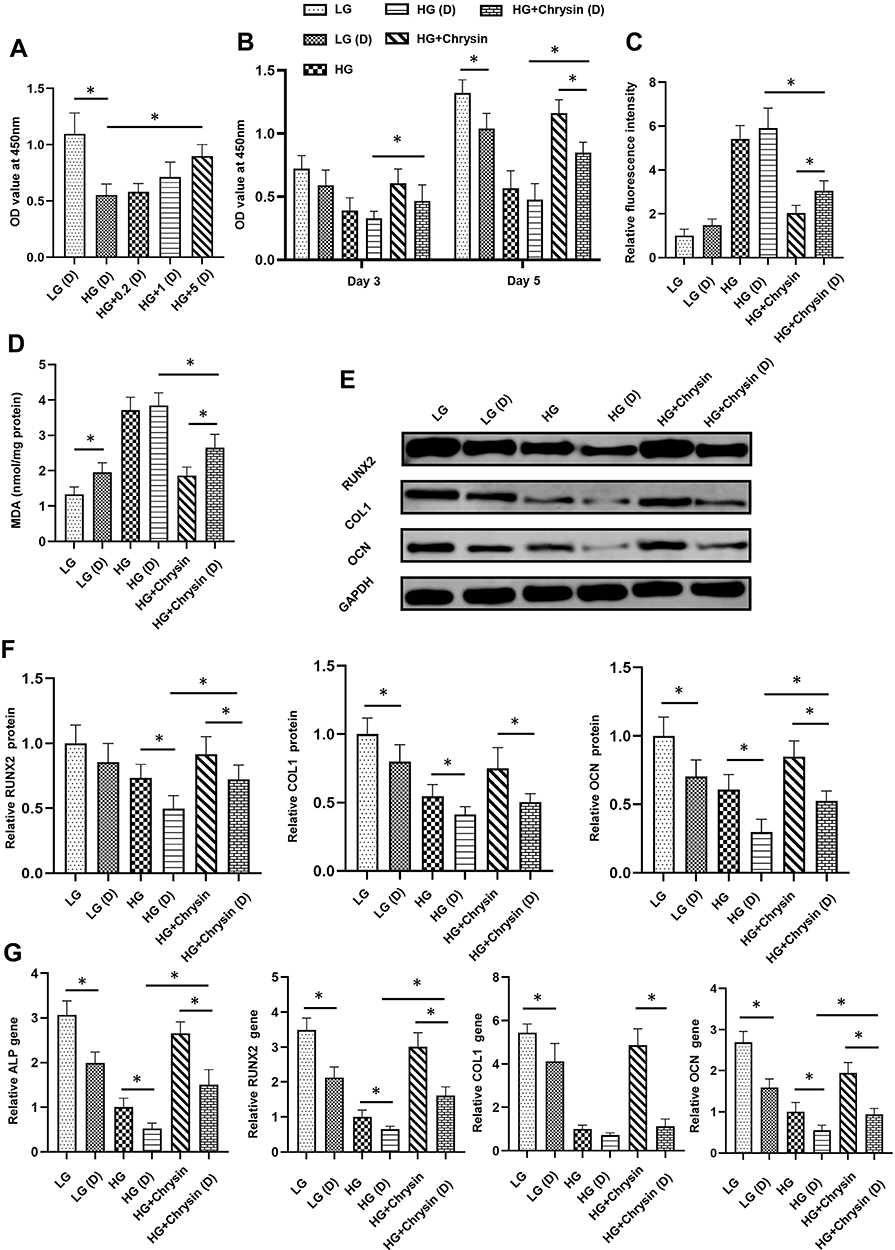 |
Figure 8 Chrysin improved the osteogenic potential of BMSCs from type 1 diabetic rats under high glucose conditions. (A) The effect of chrysin on the viability of diabetic BMSCs was examined by the CCK-8 assay. (B) The effects of chrysin on the viability of normal and diabetic BMSCs were examined by the CCK-8 assay. (C) The ROS levels in normal and diabetic BMSCs were detected by flow cytometry. (D) MDA contents in normal and diabetic BMSCs were checked. (E) The effects of chrysin on the osteogenic proteins in normal and diabetic BMSCs were examined by Western blotting. (F) Semi-quantitative analysis of contents of RUNX2, COL1, and OCN. (G) The effects of chrysin on the gene expressions of ALP, RUNX2, COL1, and OCN in normal and diabetic BMSCs were detected by PCR. Notes: *p<0.05 between two groups. |
Discussion
Tissue engineering has shown great potential in facilitating bone repair. However, the therapeutic effects of bone tissue engineering scaffold are significantly impaired under diabetic conditions. Given the rising number of diabetic patients worldwide, the development of suitable therapeutic approaches aimed at improving bone regeneration in diabetes mellitus has become a matter of pressing concern. In view of this, the effects of chrysin on the behavior of BMSCs exposed to high glucose and bone regeneration in T1DM rats were explored. Our results demonstrated that chrysin could improve proliferation and osteogenic differentiation but reduce apoptosis and ROS production in BMSCs exposed to high glucose through the activation of the PI3K/AKT/Nrf2 signaling pathway. Moreover, chrysin treatment significantly promotes bone regeneration in T1DM rats without any marked side effects.
Bone regeneration is a complicated physiological process involving an orchestrated number of histological and physiological changes. The bone healing process can be divided into three overlapping stages: inflammation, bone production, and bone remodeling. MSCs play multiple roles in the bone regeneration process; they differentiate into osteoblasts and secrete various growth factors and immune-regulatory cytokines.24 However, MSCs exhibit reduced viability and osteogenic capacity under diabetic conditions, severely impairing bone repair in diabetic patients.25 The specific mechanism underlying the dysfunction of MSCs in diabetic conditions is unclear as of yet. However, emerging evidence identified excessive ROS generation as the leading cause.6,12 Sustained hyperglycemia increases mitochondrial oxygen consumption and activates ROS-producing enzymes, leading to the overproduction of ROS. Surprisingly, we found that even when incubated in low glucose media, diabetic BMSCs still exhibited higher intracellular ROS levels and MDA content than the normal BMSCs. Excessive ROS interfere with cell signal transduction, cause cellular dysfunction and accelerate cellular senescence.26 Thus, controlling oxidative stress may be the key to repair bone defects in diabetic patients.
Chrysin is a natural ROS scavenger with good biocompatibility and wide availability. It was reported that daily chrysin dosages less than 3g were safe for human consumption.11 Moreover, chrysin is widely available in foods such as honey, vegetables, and fruits. For example, the content of chrysin in forest honey is up to 5.3 mg/kg.27 The excellent biocompatibility and wide availability of chrysin make it a preferred choice for clinical application. Previous studies indicated that diabetic MSCs exhibited impaired osteogenic potential as well as decreased angiogenic capability compared with MSCs from healthy donors.28,29 Besides, isolating and expanding autologous MSCs cost a long time, which is inconvenient for clinical use. Therefore, allogeneic MSCs from healthy donors may be more promising than autologous MSCs for diabetic bone repair. Thus, we implanted allogeneic normal BMSCs into the bone defects of diabetic rats in the present study. However, the diabetic BMSCs of host rats could migrate to the defect area and also play an important role in bone regeneration. Therefore, we tested the effects of chrysin on both the normal and diabetic BMSCs in this study.
Our results indicated that high glucose conditions induced excessive ROS generation, inhibited cell proliferation, and decreased expression of osteogenesis genes in both normal and diabetic BMSCs. However, chrysin relieved hyperglycemia-induced oxidative stress in a dose-dependent manner, and the chrysin-treated BMSCs also displayed a higher proliferative rate, increased ALP activity, and more mineralization deposition compared with BMSCs cultured in high glucose media without chrysin. The increased osteogenic differentiation of chrysin-treated BMSCs may be the cooperative effects of the antioxidant activity and osteoinductive potential of chrysin. Previous studies showed that chrysin promoted the osteogenic differentiation of adipose stromal cells via the ERK pathway, preosteoblast MC3T3-E1 cells through the ERK/MAPK pathway, and human dental pulp stem cells by the Smad3 pathway under low glucose conditions.13,14,19 It is possible that chrysin could also directly promote the osteogenic differentiation of BMSCs under high glucose conditions. However, chrysin-treated diabetic BMSCs still exhibited significantly lower viability and poorer osteogenesis than the chrysin-treated normal BMSCs, which is possible due to DNA damage and senescence caused by diabetes.28,30
The PI3K/AKT pathway plays a vital role in multiple physiological processes, including glucose uptake, glycolysis, lipid synthesis, nucleotide synthesis, and protein synthesis.31 Due to its critical role in cell metabolism, the PI3K/AKT pathway is intricately linked to multiple diseases, including cardiovascular disease, diabetes, and cancer.32,33 The activation of the PI3K/AKT pathway is essential for maintaining the physiological functions of MSCs; however, it is significantly suppressed under certain pathological situations. Accumulating evidence indicates that activating the PI3K/AKT pathway could protect MSCs from harmful factors and enhance their proliferation, migration, and differentiation.34,35 In this study, chrysin reversed the inhibition effects of high glucose on the PI3K/AKT pathway in a dose-dependent manner, indicating that chrysin may exert its beneficial effects through the PI3K/AKT pathway.
NRF2 is a downstream transcription factor of the PI3K/AKT pathway and an essential regulator of redox homeostasis. When exposed to oxidative stress, NRF2 dissociates from the Nrf2-Keap 1 complex, translocates into the nucleus, and activates a wide array of antioxidant genes.17 HO-1 is a downstream target of Nrf2 and an important endogenous antioxidant. HO-1 and its metabolites could combine with NADPH and cytochrome P450, scavenge ROS and protect cells from oxidative stress.36 Our results demonstrated that high glucose conditions suppressed the Nrf2/HO-1 pathway in BMSCs, but chrysin alleviated the effects of high glucose on the Nrf2/HO-1 pathway. These findings indicated that chrysin protects BMSCs from oxidative stress at least partly via activation of the PI3K/Akt/Nrf2 pathway. However, BMSCs treated with chrysin and LY294002 still exhibited much better osteogenic potential and a bit lower oxidative stress than BMSCs treated with PBS under high glucose conditions. LY294002 did not eliminate the increased osteogenic differentiation may be due to that chrysin can activate signaling pathways involved in osteogeneses, such as ERK/MAPK and Smad pathways.13,14 The slightly lower oxidative stress in the HG+chrysin+LY294002 group compared with the HG group perhaps because that chrysin can also inhibit ROS production through suppressing the JAK-STATs pathway.37 Despite the promising results, there were several limitations to this study. First, blocking the PI3K/ATK signaling pathway only partly offset the beneficial effects of chrysin; thus, the effects of chrysin on the other signaling pathways, such as the ERK/MAPK, Smad and JAK-STATs pathways, under high glucose conditions still need to be explored. Second, there is now overwhelming evidence indicating that BMSCs play a critical role in the inflammatory reaction following trauma, and are especially important in bone regeneration.38 Investigating the effect of chrysin on the immunomodulatory property of BMSCs is therefore also necessary. Third, only one drug administration mode was evaluated in the present study, and additional animal experiments are required to determine the optimal dosage and timing of administration.
Conclusion
Our research demonstrated that chrysin alleviated high glucose-induced BMSCs dysfunction both in vitro and in vivo. The beneficial effects of chrysin are partly due to the activation of the PI3K/Akt/Nrf2 signaling pathway. These findings indicated that the local delivery of chrysin might be a promising novel approach for the treatment of impaired bone regeneration in T1DM patients.
Data Sharing Statement
All data included in this study are available upon request by contact with the corresponding author.
Disclosure
The authors report no conflicts of interest in this work.
References
1. Standl E, Khunti K, Hansen TB, Schnell O. The global epidemics of diabetes in the 21st century: current situation and perspectives. Eur J Prev Cardiol. 2019;26(2_suppl):7–14. doi:10.1177/2047487319881021
2. El Amrousy D, El-Afify D, Shabana A. Relationship between bone turnover markers and oxidative stress in children with type 1 diabetes mellitus. Pediatr Res. 2021;89(4):878–881. doi:10.1038/s41390-020-01197-5
3. Lekkala S, Taylor EA, Hunt HB, Donnelly E. Effects of diabetes on bone material properties. Curr Osteoporos Rep. 2019;17(6):455–464. doi:10.1007/s11914-019-00538-6
4. Syversen U, Mosti MP, Mynarek IM, et al. Evidence of impaired bone quality in men with type 1 diabetes: a cross-sectional study. Endocr Connect. 2021;10(8):955–964. doi:10.1530/EC-21-0193
5. de Santana RB, Trackman PC. Effect of targeted delivery of bone morphogenetic protein-2 on bone formation in type 1 diabetes. Int J Oral Maxillofac Implants. 2015;30(3):707–714. doi:10.11607/jomi.3956
6. Mostafavinia A, Ahmadi H, Amini A, et al. The effect of photobiomodulation therapy on antioxidants and oxidative stress profiles of adipose derived mesenchymal stem cells in diabetic rats. Spectrochim Acta A Mol Biomol Spectrosc. 2021;262:120157. doi:10.1016/j.saa.2021.120157
7. Lee H, Jose PA. Coordinated contribution of NADPH oxidase- and mitochondria-derived reactive oxygen species in metabolic syndrome and its implication in renal dysfunction. Front Pharmacol. 2021;12:670076. doi:10.3389/fphar.2021.670076
8. Zhou R, Ma Y, Qiu S, Gong Z, Zhou X. Metformin promotes cell proliferation and osteogenesis under high glucose condition by regulating the ROS‑AKT‑mTOR axis. Mol Med Rep. 2020;22(4):3387–3395. doi:10.3892/mmr.2020.11391
9. Li Y, Zhang ZZ. Sustained curcumin release from PLGA microspheres improves bone formation under diabetic conditions by inhibiting the reactive oxygen species production. Drug Des Devel Ther. 2018;12:1453–1466. doi:10.2147/dddt.S154334
10. Patel RV, Mistry B, Syed R, et al. Chrysin-piperazine conjugates as antioxidant and anticancer agents. Eur J Pharm Sci. 2016;88:166–177. doi:10.1016/j.ejps.2016.02.011
11. Naz S, Imran M, Rauf A, et al. Chrysin: pharmacological and therapeutic properties. Life Sci. 2019;235:116797. doi:10.1016/j.lfs.2019.116797
12. Hong JS, Feng JH, Park JS, et al. Antinociceptive effect of chrysin in diabetic neuropathy and formalin-induced pain models. Anim Cells Syst (Seoul). 2020;24(3):143–150. doi:10.1080/19768354.2020.1765019
13. Zeng W, Yan Y, Zhang F, Zhang C, Liang W. Chrysin promotes osteogenic differentiation via ERK/MAPK activation. Protein Cell. 2013;4(7):539–547. doi:10.1007/s13238-013-3003-3
14. Huo JF, Zhang ML, Wang XX, Zou DH. Chrysin induces osteogenic differentiation of human dental pulp stem cells. Exp Cell Res. 2021;400(2):112466. doi:10.1016/j.yexcr.2020.112466
15. Ibrahim SO, Mada SB, Abarshi MM, Tanko MS, Babangida S. Chrysin alleviates alteration of bone-remodeling markers in ovariectomized rats and exhibits estrogen-like activity in silico. Hum Exp Toxicol. 2021;9603271211033777. doi:10.1177/09603271211033777
16. Yoon J-H, Youn K, Jun M. Protective effect of sargahydroquinoic acid against Aβ25–35-evoked damage via PI3K/Akt mediated Nrf2 antioxidant defense system. Biomed Pharmacother. 2021;144:112271. doi:10.1016/j.biopha.2021.112271
17. Loboda A, Damulewicz M, Pyza E, Jozkowicz A, Dulak J. Role of Nrf2/HO-1 system in development, oxidative stress response and diseases: an evolutionarily conserved mechanism. Cell Mol Life Sci. 2016;73(17):3221–3247. doi:10.1007/s00018-016-2223-0
18. Xingyue L, Shuang L, Qiang W, Jinjuan F, Yongjian Y. Chrysin ameliorates sepsis-induced cardiac dysfunction through upregulating Nfr2/Heme oxygenase 1 pathway. J Cardiovasc Pharmacol. 2021;77(4):491–500. doi:10.1097/fjc.0000000000000989
19. Kim YJ, Bae YC, Suh KT, Jung JS. Quercetin, a flavonoid, inhibits proliferation and increases osteogenic differentiation in human adipose stromal cells. Biochem Pharmacol. 2006;72(10):1268–1278. doi:10.1016/j.bcp.2006.08.021
20. Zhang J, Wang C, Kang K, et al. Loganin attenuates septic acute renal injury with the participation of AKT and Nrf2/HO-1 signaling pathways. Drug Des Devel Ther. 2021;15:501–513. doi:10.2147/DDDT.S294266
21. Li Y, Chen G, He Y, et al. Ebselen rescues oxidative-stress-suppressed osteogenic differentiation of bone-marrow-derived mesenchymal stem cells via an antioxidant effect and the PI3K/Akt pathway. J Trace Elem Med Biol. 2019;55:64–70. doi:10.1016/j.jtemb.2019.06.002
22. Ma Q, Liang M, Limjunyawong N, et al. Osteoclast-derived apoptotic bodies show extended biological effects of parental cell in promoting bone defect healing. Theranostics. 2020;10(15):6825–6838. doi:10.7150/thno.45170
23. Kilkenny C, Browne W, Cuthill IC, Emerson M, Altman DG. Animal research: reporting in vivo experiments: the ARRIVE guidelines. Br J Pharmacol. 2010;160(7):1577–1579. doi:10.1111/j.1476-5381.2010.00872.x
24. Venkatraman SK, Swamiappan S. Review on calcium- and magnesium-based silicates for bone tissue engineering applications. J Biomed Mater Res A. 2020;108(7):1546–1562. doi:10.1002/jbm.a.36925
25. Dong X, Wang X, Xing M, et al. Inhibition of the negative effect of high glucose on osteogenic differentiation of bone marrow stromal cells by silicon ions from calcium silicate bioceramics. Regen Biomater. 2020;7(1):9–17. doi:10.1093/rb/rbz030
26. Evangelista I, Nuti R, Picchioni T, Dotta F, Palazzuoli A. Molecular dysfunction and phenotypic derangement in diabetic cardiomyopathy. Int J Mol Sci. 2019;20(13). doi:10.3390/ijms20133264
27. Babangida S, Ibrahim S, Muhammad A, Arthur DE, Uzairu A, Garba A. The role of molecular modelling strategies in validating the effects of chrysin on sodium arsenite-induced chromosomal and DNA damage. Hum Exp Toxicol. 2018;37(10):1037–1047. doi:10.1177/0960327117751233
28. Filion TM, Skelly JD, Huang H, Greiner DL, Ayers DC, Song J. Impaired osteogenesis of T1DM bone marrow-derived stromal cells and periosteum-derived cells and their differential in-vitro responses to growth factor rescue. Stem Cell Res Ther. 2017;8(1):65. doi:10.1186/s13287-017-0521-6
29. Kim H, Han JW, Lee JY, et al. Diabetic mesenchymal stem cells are ineffective for improving limb ischemia due to their impaired angiogenic capability. Cell Transplant. 2015;24(8):1571–1584. doi:10.3727/096368914X682792
30. Ren S, Xiong H, Chen J, et al. The whole profiling and competing endogenous RNA network analyses of noncoding RNAs in adipose-derived stem cells from diabetic, old, and young patients. Stem Cell Res Ther. 2021;12(1):313. doi:10.1186/s13287-021-02388-5
31. Hoxhaj G, Manning BD. The PI3K-AKT network at the interface of oncogenic signalling and cancer metabolism. Nat Rev Cancer. 2020;20(2):74–88. doi:10.1038/s41568-019-0216-7
32. Huang X, Liu G, Guo J, Su Z. The PI3K/AKT pathway in obesity and type 2 diabetes. Int J Biol Sci. 2018;14(11):1483–1496. doi:10.7150/ijbs.27173
33. Li H, Prever L, Hirsch E, Gulluni F. Targeting PI3K/AKT/mTOR signaling pathway in breast cancer. Cancers (Basel). 2021;13(14). doi:10.3390/cancers13143517
34. Huang D, Yin L, Liu X, et al. Geraniin protects bone marrow‑derived mesenchymal stem cells against hydrogen peroxide‑induced cellular oxidative stress in vitro. Int J Mol Med. 2018;41(2):739–748. doi:10.3892/ijmm.2017.3276
35. Zhou H, Yang J, Xin T, et al. Exendin-4 protects adipose-derived mesenchymal stem cells from apoptosis induced by hydrogen peroxide through the PI3K/Akt-Sfrp2 pathways. Free Radic Biol Med. 2014;77:363–375. doi:10.1016/j.freeradbiomed.2014.09.033
36. Wu X, Xu J, Cai Y, Yang Y, Liu Y, Cao S. Cytoprotection against oxidative stress by methylnissolin-3-O-β-d-glucopyranoside from astragalus membranaceus mainly via the activation of the Nrf2/HO-1 pathway. Molecules. 2021;26(13). doi:10.3390/molecules26133852
37. Qi SM, Li Q, Jiang Q, Qi ZL, Zhang Y. [Chrysin inhibits lipopolysaccharide-induced inflammatory responses of macrophages via JAK-STATs signaling pathway]. Nan Fang Yi Ke Da Xue Xue Bao. 2018;38(3):243–250. Chinese. doi:10.3969/j.issn.1673-4254.2018.03.02
38. Newman H, Shih YV, Varghese S. Resolution of inflammation in bone regeneration: from understandings to therapeutic applications. Biomaterials. 2021;277:121114. doi:10.1016/j.biomaterials.2021.121114
 © 2022 The Author(s). This work is published and licensed by Dove Medical Press Limited. The
full terms of this license are available at https://www.dovepress.com/terms
and incorporate the Creative Commons Attribution
- Non Commercial (unported, 3.0) License.
By accessing the work you hereby accept the Terms. Non-commercial uses of the work are permitted
without any further permission from Dove Medical Press Limited, provided the work is properly
attributed. For permission for commercial use of this work, please see paragraphs 4.2 and 5 of our Terms.
© 2022 The Author(s). This work is published and licensed by Dove Medical Press Limited. The
full terms of this license are available at https://www.dovepress.com/terms
and incorporate the Creative Commons Attribution
- Non Commercial (unported, 3.0) License.
By accessing the work you hereby accept the Terms. Non-commercial uses of the work are permitted
without any further permission from Dove Medical Press Limited, provided the work is properly
attributed. For permission for commercial use of this work, please see paragraphs 4.2 and 5 of our Terms.