Back to Journals » Nature and Science of Sleep » Volume 10
Chronic treatment with dexamethasone alters clock gene expression and melatonin synthesis in rat pineal gland at night
Authors Meneses-Santos D, Buonfiglio DC, Peliciari-Garcia RA, Ramos-Lobo AM, Souza DN ![]() , Carpinelli AR, Carvalho CRO, Sertie RA, Andreotti S, Lima FB
, Carpinelli AR, Carvalho CRO, Sertie RA, Andreotti S, Lima FB ![]() , Afeche SC, Fioretto ET
, Afeche SC, Fioretto ET ![]() , Cipolla-Neto J
, Cipolla-Neto J ![]() , Marçal AC
, Marçal AC ![]()
Received 1 December 2017
Accepted for publication 21 February 2018
Published 17 July 2018 Volume 2018:10 Pages 203—215
DOI https://doi.org/10.2147/NSS.S158602
Checked for plagiarism Yes
Review by Single anonymous peer review
Peer reviewer comments 2
Editor who approved publication: Dr Steven Shea
Daniela Meneses-Santos,1 Daniella do Carmo Buonfiglio,2 Rodrigo Antonio Peliciari-Garcia,3 Angela Maria Ramos-Lobo,2 Divanízia do Nascimento Souza,1 Angelo Rafael Carpinelli,2 Carla Roberta de Oliveira Carvalho,2 Rogério Antônio Laurato Sertie,2 Sandra Andreotti,2 Fabio Bessa Lima,2 Solange Castro Afeche,4 Emerson Ticona Fioretto,1 José Cipolla-Neto,2 Anderson Carlos Marçal1
1Department of Morphology, Center of Biological Sciences and Health, Federal University of Sergipe, São Cristóvão, Brazil; 2Department of Physiology and Biophysics, Institute of Biomedical Sciences, University of São Paulo, São Paulo, Brazil; 3Morphophysiology & Pathology Sector, Department of Biological Sciences, Federal University of São Paulo, São Paulo, Brazil; 4Laboratory of Pharmacology, Butanta Institute, São Paulo, Brazil
Background: Melatonin is a neuroendocrine hormone that regulates many functions involving energy metabolism and behavior in mammals throughout the light/dark cycle. It is considered an output signal of the central circadian clock, located in the suprachiasmatic nucleus of the hypothalamus. Melatonin synthesis can be influenced by other hormones, such as insulin and glucocorticoids in pathological conditions or during stress. Furthermore, glucocorticoids appear to modulate circadian clock genes in peripheral tissues and are associated with the onset of metabolic diseases. In the pineal gland, the modulation of melatonin synthesis by clock genes has already been demonstrated. However, few studies have shown the effects of glucocorticoids on clock genes expression in the pineal gland.
Results: We verified that rats treated with dexamethasone (2 mg/kg body weight, intraperitoneal) for 10 consecutive days, showed hyperglycemia and pronounced hyperinsulinemia during the dark phase. Insulin sensitivity, glucose tolerance, melatonin synthesis, and enzymatic activity of arylalkylamine N-acetyltransferase, the key enzyme of melatonin synthesis, were reduced. Furthermore, we observed an increase in the expression of Bmal1, Per1, Per2, Cry1, and Cry2 in pineal glands of rats treated with dexamethasone.
Conclusion: These results show that chronic treatment with dexamethasone can modulate both melatonin synthesis and circadian clock expression during the dark phase.
Keywords: clock genes, glucocorticoids, pineal gland, nocturnal insulinemia, glycemia profile, AANAT activity
Introduction
The pineal gland is considered a light-modulated neuroendocrine organ.1 Light is detected by the ganglion cells in the retina and transmitted via the retinohypothalamic tract to the suprachiasmatic nucleus (SCN) of the hypothalamus.2 SCN is considered the master circadian clock (central clock), and also modulates the expression of peripheral circadian clocks, thus regulating homeostasis in mammals in a clock gene-dependent manner.3 Aside from the the central clock, clock genes are also expressed in several peripheral tissues, including the pineal gland, which appears to play an important role in controlling Aanat timing mRNA expression.4–11
Mammals’ circadian clock involves two transcriptional feedback loops that work seamlessly by positively or negatively regulating the expression of circadian clock components. Notable examples are circadian locomotor output cycles kaput (Clock) and brain and muscle ARNT-like (Bmal1), which belong to the family of basic–helix–loop–helix-PAS factors.10 These two molecules form a heterodimer that binds to the E-box of target genes known as periods (Per1, Per2, and Per3) and cryptochromes (Cry1 and Cry2).12,13 Upon activation of target genes by the CLOCK/BMAL1 heterodimer, PER and CRY form the PER/CRY complex which is then translocated to the nucleus, where it interacts with and negatively regulates the CLOCK/BMAL1 complex. A second loop of Bmal1 regulation involves the activation of nuclear receptors REV-ERBAα and RORα; these receptors inhibit or activate the transcription of Bmal1 by competing for binding to the ROR element (RORE) in the promoter region of Bmal1.14,15
In the pineal gland, melatonin synthesis acts as nocturnal output of received signals mediated by the master circadian clock.16 Melatonin is synthesized exclusively during the night. These events are dependent on noradrenaline release from synaptic endings of the postganglionic fibers, resulting in the activation of α1 and β1 adrenergic receptors located on the cell membrane of pinealocytes. Noradrenaline and β1 adrenergic receptor interaction mobilizes stimulatory G protein, which, in turn, stimulates adenylate cyclase, resulting in increased levels of cyclic adenosine monophosphate (cAMP).17 The consequent activation of cAMP-dependent protein kinase leads to the phosphorylation of protein binding to cAMP responsive elements (CREB), and this stimulates the transcription of enzymes involved in melatonin biosynthesis.18 Arylalkylamine N-acetyltransferase (AANAT) interacts with 14-3-3 protein, which stabilizes and protects activated AANAT from proteolytic degradation.19,20 AANAT is the rate-limiting enzyme in the synthesis of melatonin.21 However, 3 other enzymes, tryptophan hydroxylase, aromatic L-amino acid decarboxylase, and hydroxyindole-O-methyltransferase are also required.22,23
Melatonin synthesis can be modulated in pathological conditions; for example, in rats with type I diabetes induced by streptozotocin or alloxan.24,25 Furthermore, studies have shown that melatonin synthesis can be influenced by glucocorticoids, as exemplified by models of stress and elevated concentrations of glucocorticoids.26,27 On the other hand, in vitro and in vivo microdialysis studies, showed that corticosterone is able to enhance melatonin production through modulation of AANAT activity.28,29
Glucocorticoids are steroid hormones and both their synthesis and secretion are controlled by the hypothalamic–pituitary–adrenal (HPA) axis, which modulates various biological processes such as the homeostasis of the central nervous system, cardiovascular system, and mediates metabolic and immune/inflammatory responses.30–32 In this way, any putative alteration of melatonin synthesis due to systemic glucocorticoid treatment might be due to both global pathophysiological alterations and local action directly on the pineal gland.33,34
In addition, it should be considered that a functional interaction between the circadian clock and the HPA axis is present in mammals, which extends beyond the control of the adrenal gland circadian functions. The sympathetic nervous system and HPA axis (which are physiological systems responsible for the secretion of catecholamines and glucocorticoids) in unbalanced conditions may be related to maladaptive responses to stress.35 Specifically, glucocorticoids may modulate the circadian clock and output of other peripheral clocks.36–38 Furthermore, it has already been shown that the pineal circadian clock can modulate melatonin synthesis.39 Therefore, the aim of the present work was to evaluate how dexamethasone can modify physiological aspects of pineal gland function, including the modulation of the key enzyme of melatonin synthesis (AANAT) and the pineal clock through analysis of clock genes mRNA expression.
Materials and methods
Animals
All animals were treated in accordance with the National Research Council’s “Guide for the Care and Use of Laboratory Animals” as part of a protocol approved by the Committee of Ethics in Animal Experimentation of the Federal University of Sergipe. Male Wistar rats (weight, 200–250 g) were obtained from the Federal University of Sergipe, São Cristóvão, Sergipe, Brazil. The animals were maintained at 23±2°C on a 12-h light/dark (LD) cycle (lights on at 6 a.m.; Zeitgeber time [ZT] 0 and lights off at 6 p.m.; Zeitgeber time [ZT] 12). They received commercial chow (Ração Labina, São Paulo, Brazil) and water ad libitum. The rats were divided into 2 groups – the dexamethasone-treated (DEX) group, which received daily intraperitoneal (i.p.) injections (2 mg/kg body weight; Decadron®, Aché, Guarulhos, Brazil) for 10 consecutive days at ZT6, and the control group (Control), which received vehicle solution (0.9% NaCl) in the same protocol as the experimental group. Animals were weighed daily throughout the treatment.
The rats were euthanized by sodium thiopental anesthesia (Thiopentax®, Cristália, Itapira, Brazil) (40 mg/kg of animal body weight, i.p.). The animals (6 per time point) were sacrificed at ZT12, ZT14, ZT16-ZT22 and ZT24. The pineal glands were collected under red light (Kodak filter red 1A) and stored at −80°C for further processing. Blood was collected into individual tubes, immediately cooled (−20°C) and then centrifuged (Hettich Centrifuge 320; Andreas Hettich GmbH & Co., Tuttlingen, Germany) at 1500 rpm for 10 min at 4°C. Plasma samples were collected and stored (−80°C) for evaluation of plasma insulin levels.
Evaluation of glycemia daily profile and nocturnal insulinemia
Two drops of blood from the tip of the tail were collected from both groups at 1 h intervals (during a 24-h period).40 Glycemia was determined utilizing a glucometer (Accu-Chek® Active; Roche Diagnostics Brazil Ltda. São Paulo, Brazil). Plasma insulin levels from ZT17 to ZT22 were measured by radioimmunoassay (RIA).41 Rat 125I-labeled insulin was obtained from Amersham Pharmacia (São Paulo, Brazil). All other reagents were obtained from Sigma (St. Louis, MO, USA), unless otherwise mentioned. Insulin antibody was a gift from Dr Leclercq-Meyer, Université Libre de Bruxelles, Belgium.
Homeostasis model assessment (HOMA)
Animals were fasted for 12 h and their glycemia was measured at ZT2. Plasma aliquots for insulin dosage (determined by RIA) were harvested as previously described. The HOMA index was calculated to assess insulin sensitivity using the formula: HOMA = {insulin [µU/mL] × Glycemia [mMol]}/22.5.42
Glucose tolerance test (GTT)
GTT was performed at ZT2 of the LD cycle. To assess glucose tolerance, rats were fasted for 12 h and then anesthetized with sodium thiopental (Thiopentax®, Cristália) (40 mg/kg of animal body weight, i.p.). The animals received an injection of glucose solution (2 g/kg of body weight) (Isofarma; Isofarma Pharmaceutical Industrial Ltd, Eusebius) in the penile vein, as previous described.43 Tail blood samples were collected at 0 (baseline), 1, 5, 20, and 50 min after the glucose administration and measured with a glucometer (Accu-Chek® Active, Roche Diagnostics Brazil Ltda).
Short insulin tolerance test and glucose disappearance rate (KITT)
KITT was performed at ZT2. To assess insulin sensitivity, rats were anesthetized with thiopental sodium (Thiopentax®, Cristália) (40 mg/kg of animal weight), followed by an injection of regular insulin solution (750 mU/mL per kg of body weight) (Humulin R; Eli Lilly, Paris, France) in the penile vein. Blood samples from the tail were collected at 0 (baseline), 4, 8, 12, and 16 min after the insulin injection and measured using a glucometer (Accu-Chek Active, Roche Diagnostics Brazil Ltda.). The fractional disappearance for plasma glucose (KITT) was calculated by the formula 0.693/t½ (where t½ is the half-life of plasma glucose calculated from the slope of the curve obtained during the linear decay of plasma glucose).41,44
Measurement of melatonin levels
Pineal gland melatonin levels from ZT17 to ZT22 were measured by ultrahigh performance liquid chromatography (Dionex UHPLC Ultimate 3000) with electrochemical detection (ESA Coulochem III) and autosampler (WPS-3000TSL with sample thermostatting) running Chromeleon software and plotted as ng/200 µL of medium. Melatonin was separated on an Acclaim RSLC 120 C18 column (2.2 μm, 120 A, 100×2.1 mm). The chromatographic system was isocratically operated with the following mobile phase: 0.1 M sodium acetate, 0.1 M citric acid, 0.15 mM EDTA, 30% methanol, pH 3.7, at a flow rate of 0.135 mL/min. The electrochemical detector potential was adjusted to +750 mV in the guard cell and +700 mV in the 5041 analytical cell. The elution time for melatonin was about 7 min. Each gland was sonicated (Microson XL 2005; Heat System, Inc., Farmingdale, NY, USA) in a solution of 0.1 M perchloric acid (120 μL), containing 0.02% EDTA and 0.02% sodium bisulfate. After centrifugation (20 min, 14,000×g, Eppendorf 5415C Centrifuge; Brinkman Instruments Inc., Westbury, NY, USA), 40 μL of the supernatant was injected into the chromatographic system.45
Measurement of corticosterone levels
Blood samples were collected from both groups and centrifuged for serum extraction. Corticosterone levels were detected at ZT12, ZT14, ZT16–ZT22, and ZT24 by RIA commercial kit (Cloud-Clone Corp., Houston, TX, USA).
AANAT activity determination
AANAT activity at ZT12, ZT14, ZT16-ZT22 and ZT24 was measured by a radiometric assay.46,47 Briefly, 100 μL of 0.1 M sodium phosphate buffer (pH 6.8), containing 40 mM tryptamine and [3H]-acetyl coenzyme A (2 mM; final specific activity=4 mCi/mmol), was added to a microcentrifuge tube containing 1–3 pineals kept at 4°C. Pineal glands from both groups were sonicated and then incubated at 37°C for 20 min. The reaction product N-3[H]-acetyltriptamine was extracted with chloroform (1 mL). Samples of 500 μL were evaporated until dry in a scintillation vial, and radioactivity was determined (Tri-Carb 2100 Packard β-counter; GMI Inc., Ramsey, MN, USA).
Quantitative real-time polymerase chain reaction (qRT-PCR)
Total RNA from pineal glands collected from ZT17 to ZT22 was isolated using a guanidine isothiocyanate–based reagent (Trizol; Invitrogen Corp., Carlsbad, CA, USA), according to the manufacturer’s specifications. Total RNA was eluted in RNase-free water, treated with DNase genomic DNA remover (Turbo DNA-free; Ambion, Austin, TX, USA) according to the manufacturer’s specifications. Reverse transcriptase (200 U Superscript III; Invitrogen Corp.), DTT (10 nM), dNTP (10 mM each), RNase inhibitor (40 U), and random primers (150 ng) were used to reverse transcribe 1 μg of total RNA in a final reaction volume of 20 μL. qRT-PCR was performed (7500 Real-Time PCR System; Applied Biosystems, Inc. [ABI], Foster City, CA, USA) using 2 μL of cDNA (10 ng/μL), SYBR green (Power SYBR Green; ABI), and 400 nM specific intron-spanning primers (Table 1). The cycling parameters included an initial denaturation step at 95°C for 10 min, followed by 40 cycles of 95°C for 15 s and annealing and extension at 60°C for 1 min. For melting curve analyses (Tm), a set of 10-fold serial dilutions of each internal standard (102–106 copies/2 μL) was used to generate a standard curve, and all qRT-PCR assays were linear within this concentration range with correlation coefficients (r2>0.999). Transcript numbers were determined by the system software (Model 7500, ver. 2.0.3; ABI) and normalized using the geometric mean calculated from the reference genes Actb, Rpl37a, and Actg1, which were indicated as the most suitable ones by the software GeNorm.45–48
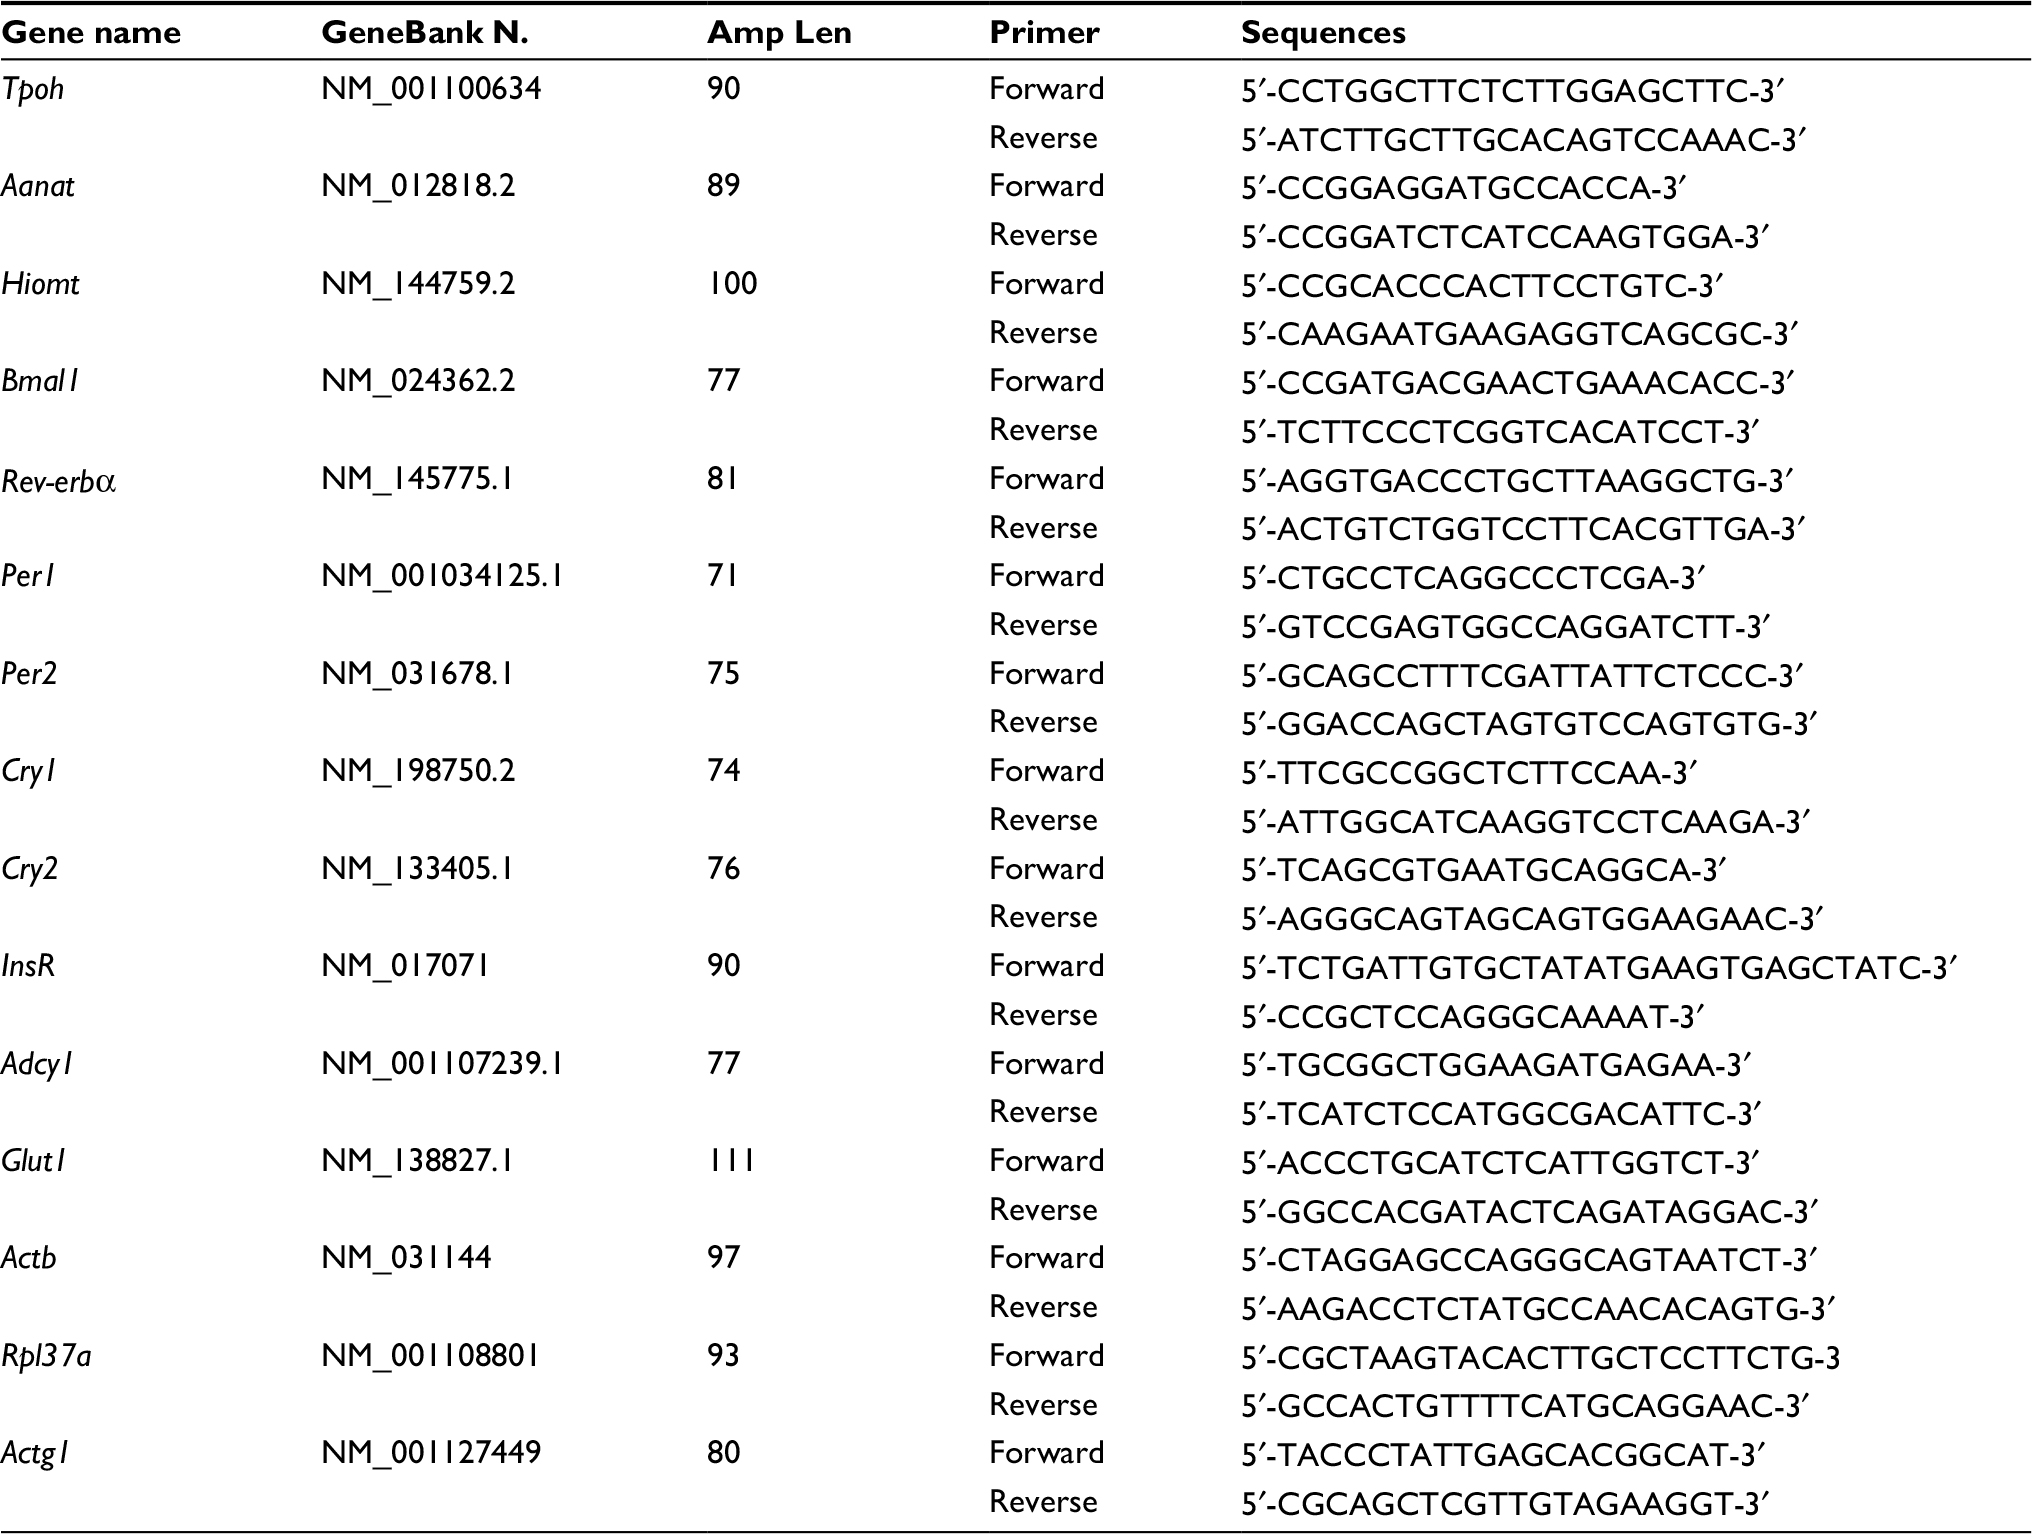 | Table 1 Primers sequences for real-time (quantitative) RT-PCR assays of rat mRNA samples |
Statistical analysis
All the results were plotted as the mean ± SEM. Two-way analysis of variance with Bonferroni’s post-test was used to compare the effects of time and treatment. The Student’s t-test was used when appropriate (all statistical tests and graphics: Prism, ver. 5.01 for Windows; GraphPad Software, San Diego, CA, USA). In all cases, the null hypothesis of no model effects was rejected at P<0.05.
Results
Body weight gain, periepididymal fat pad, glycemic profile
Both groups had similar baseline body weight (P>0.05, Table 2); after the treatment, the DEX group showed a 0.74-fold reduction in body weight (P<0.05) and a 1.35-fold increase in periepididymal adipose tissue, compared with the Control rats (P<0.05).
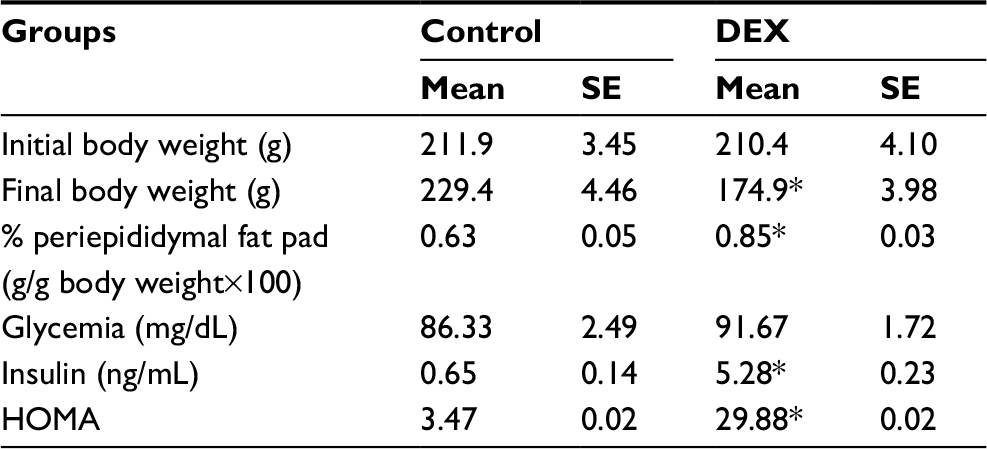 | Table 2 Effects of dexamethasone treatment on final body weight, the percentage of periepididymal fat pad, glycemia, insulin and HOMA. Eight rats were examined for each group Notes: Mean values were significantly different from those of the control group (*P<0.05; Student’s t-test). Abbreviations: DEX, dexamethasone; HOMA, homeostasis model assessment; SE, standard error. |
The plasma glucose hourly profile was assessed in vivo over the 24 h following the tenth day of treatment. Plasma glucose levels showed no significant difference between groups in any of the time points during the light phase and both groups showed an increase in plasma glucose at the beginning of the dark phase. However, the DEX group had higher levels of plasma glucose between ZT17 and ZT22 when compared with the Control rats (1.30, 1.28, 1.29, 1.29, 1.35, and 1.32 times, respectively) (P<0.05; Figure 1).
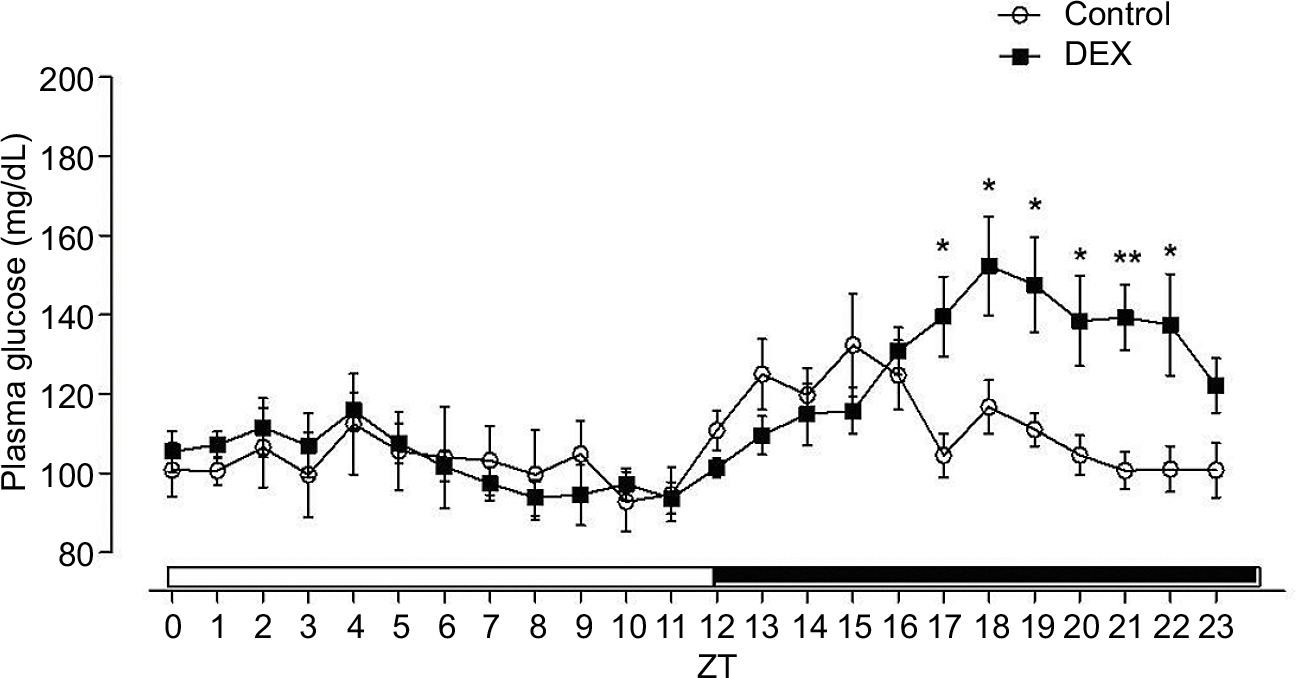 | Figure 1 L/D glucose cycle profile of control rats (lines with circles) and treated with dexamethasone (lines with squares). Notes: Animals were installed in 12 h L/D cycle, fed commercial Labina chow and water ad libitum. Blood drops were collected from the tail of the animal by capillarity in both experimental groups at 1 h intervals over a 24 h period. The ordinate values are expressed in mg/dL, and the white and black bars of the abscissa indicate the light and dark phases of the L/D cycle respectively. The results are represented as mean ± SEM. Two-way ANOVA, Bonferroni’s post-tests, *P<0.05, **P<0.01 (n=8 for both groups). Abbreviations: ANOVA, analysis of variance; DEX, dexamethasone; L/D, light/dark; ZT, Zeitgeber time. |
Dexamethasone induces hyperinsulinemia in the dark phase
Plasma insulin levels were assessed in the Control and the DEX rats during the dark phase, where the values of glucose were higher. DEX animals had higher plasma insulin levels than Control rats between ZT19 and ZT22 (1.69-, 1.70-, 2.44-, and 7.40-fold, respectively) (P<0.05; Figure 2), and lower insulin sensitivity, indicated by a 8.59-fold increase in the HOMA index relative to the Control rats at ZT2 (P<0.05; Table 2).
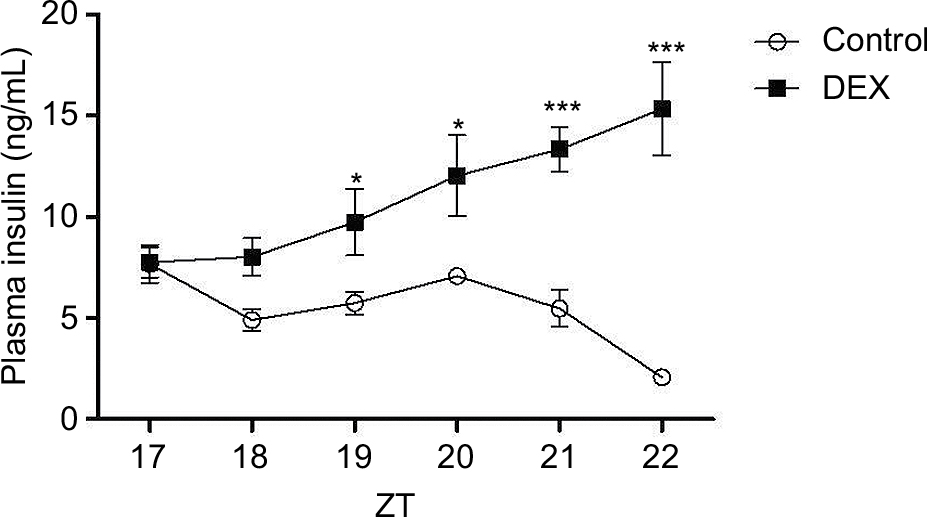 | Figure 2 Plasma insulin profile in control rats (white bar) and rats treated with dexamethasone (black bars). Notes: Animals were installed in 12 h light/12 h dark cycle, fed commercial Labina chow and water ad libitum. The animals were euthanized at the indicated times ZT (ZT17, ZT18, ZT19, ZT20, ZT21, and ZT22), and blood samples were collected and measured by radioimmunoassay (see Materials and methods section). The results are represented as mean ± SEM. Two-way ANOVA (with Bonferroni posttests), *P<0.05, ***P<0.001 (n=6 for both groups). Abbreviations: ANOVA, analysis of variance; DEX, dexamethasone; ZT, Zeitgeber time. |
Evaluation of glucose tolerance and glucose disposal rate (KITT)
DEX-treated rats had 1.41- (P<0.001), 1.28- (P<0.05), 1.46-fold (P<0.01) higher blood glucose levels than Control rats at 1, 5, and 20 min, respectively, during the GTT (Figure 3A) and their insulin sensitivity was reduced by 0.39-fold compared with Control rats (P<0.01; Figure 3B).
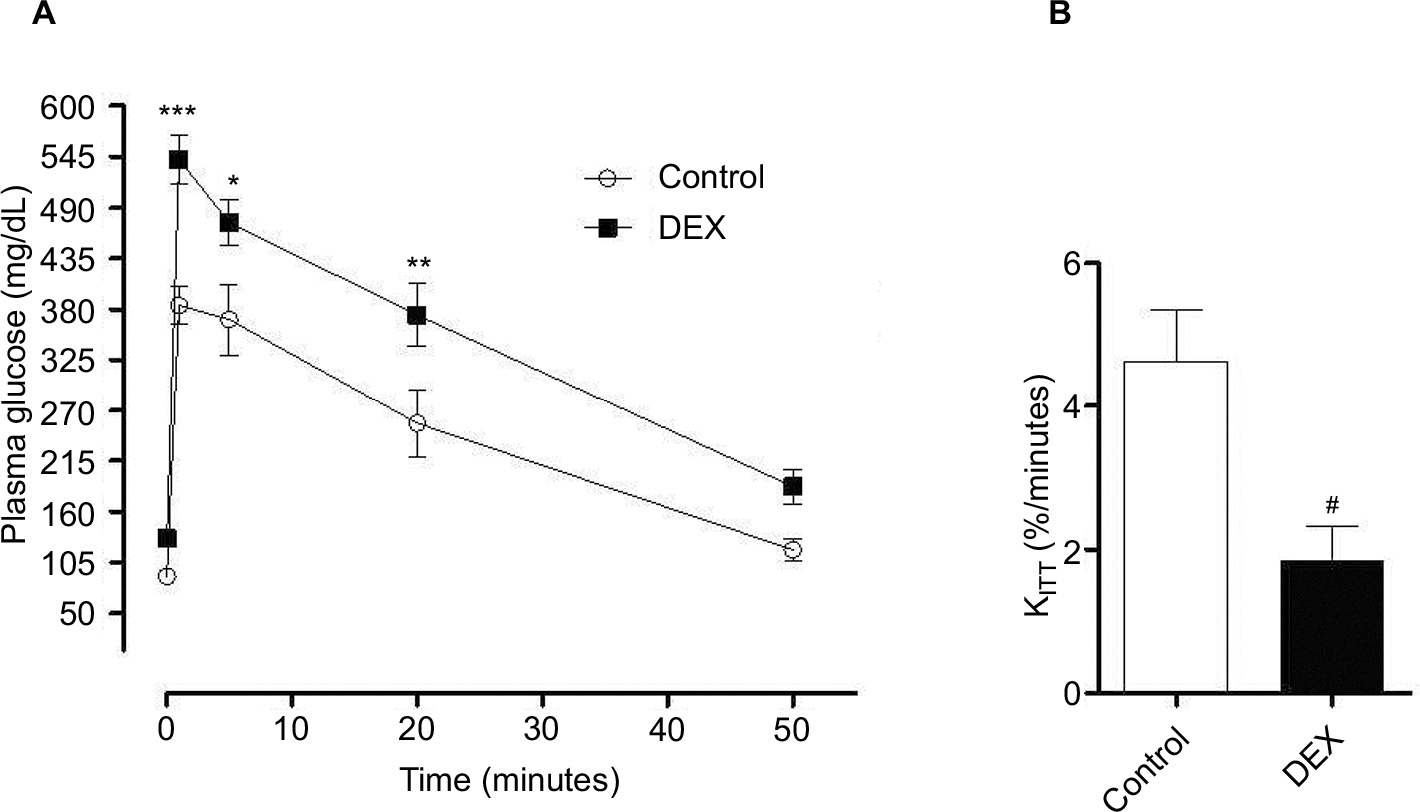 | Figure 3 (A) Evaluation of plasma glucose during the glucose tolerance test. Blood samples were collected from control and dexamethasone-treated rats at ZT2 at baseline (0 min) and at 1, 5, 20, and 50 min after glucose injection. The results are represented as mean ± SEM. Two-way ANOVA, Bonferroni’s post-tests *P<0.05, **P<0.01, ***P<0.001 (n=8 for both groups). (B) Evaluation of plasma glucose during the insulin tolerance test (KITT). Glucose was measured in control rats and rats treated with dexamethasone at ZT2 (0 min) and at 4, 8, 12, and 16 min after insulin injection. Student’s t-test #P<0.05. Notes: The plasma glucose values were calculated by the rate of decay of plasma glucose over time and KITT was calculated (n=8 for both groups). Abbreviations: ANOVA, analysis of variance; DEX, dexamethasone; ZT, Zeitgeber time. |
Reduction of melatonin in rats treated with dexamethasone is associated with reduced AANAT activity
Dexamethasone treatment led to a reduction by 0.49-fold at ZT12 and 0.36-fold at ZT21 of AANAT activity in the pineal gland (P<0.05; Figure 4A), and the overall nocturnal AANAT activity was also decreased by 0.64-fold in DEX rats compared with Control rats (P<0.05; Figure 4B). Melatonin content in the pineal gland was reduced in DEX rats by 0.59-fold at ZT21 and 0.54-fold at ZT22 (P<0.05; Figure 4C) and corticosterone blood levels were reduced by 0.72-fold in DEX rats compared with Control rats (P<0.05; Figure 4D).
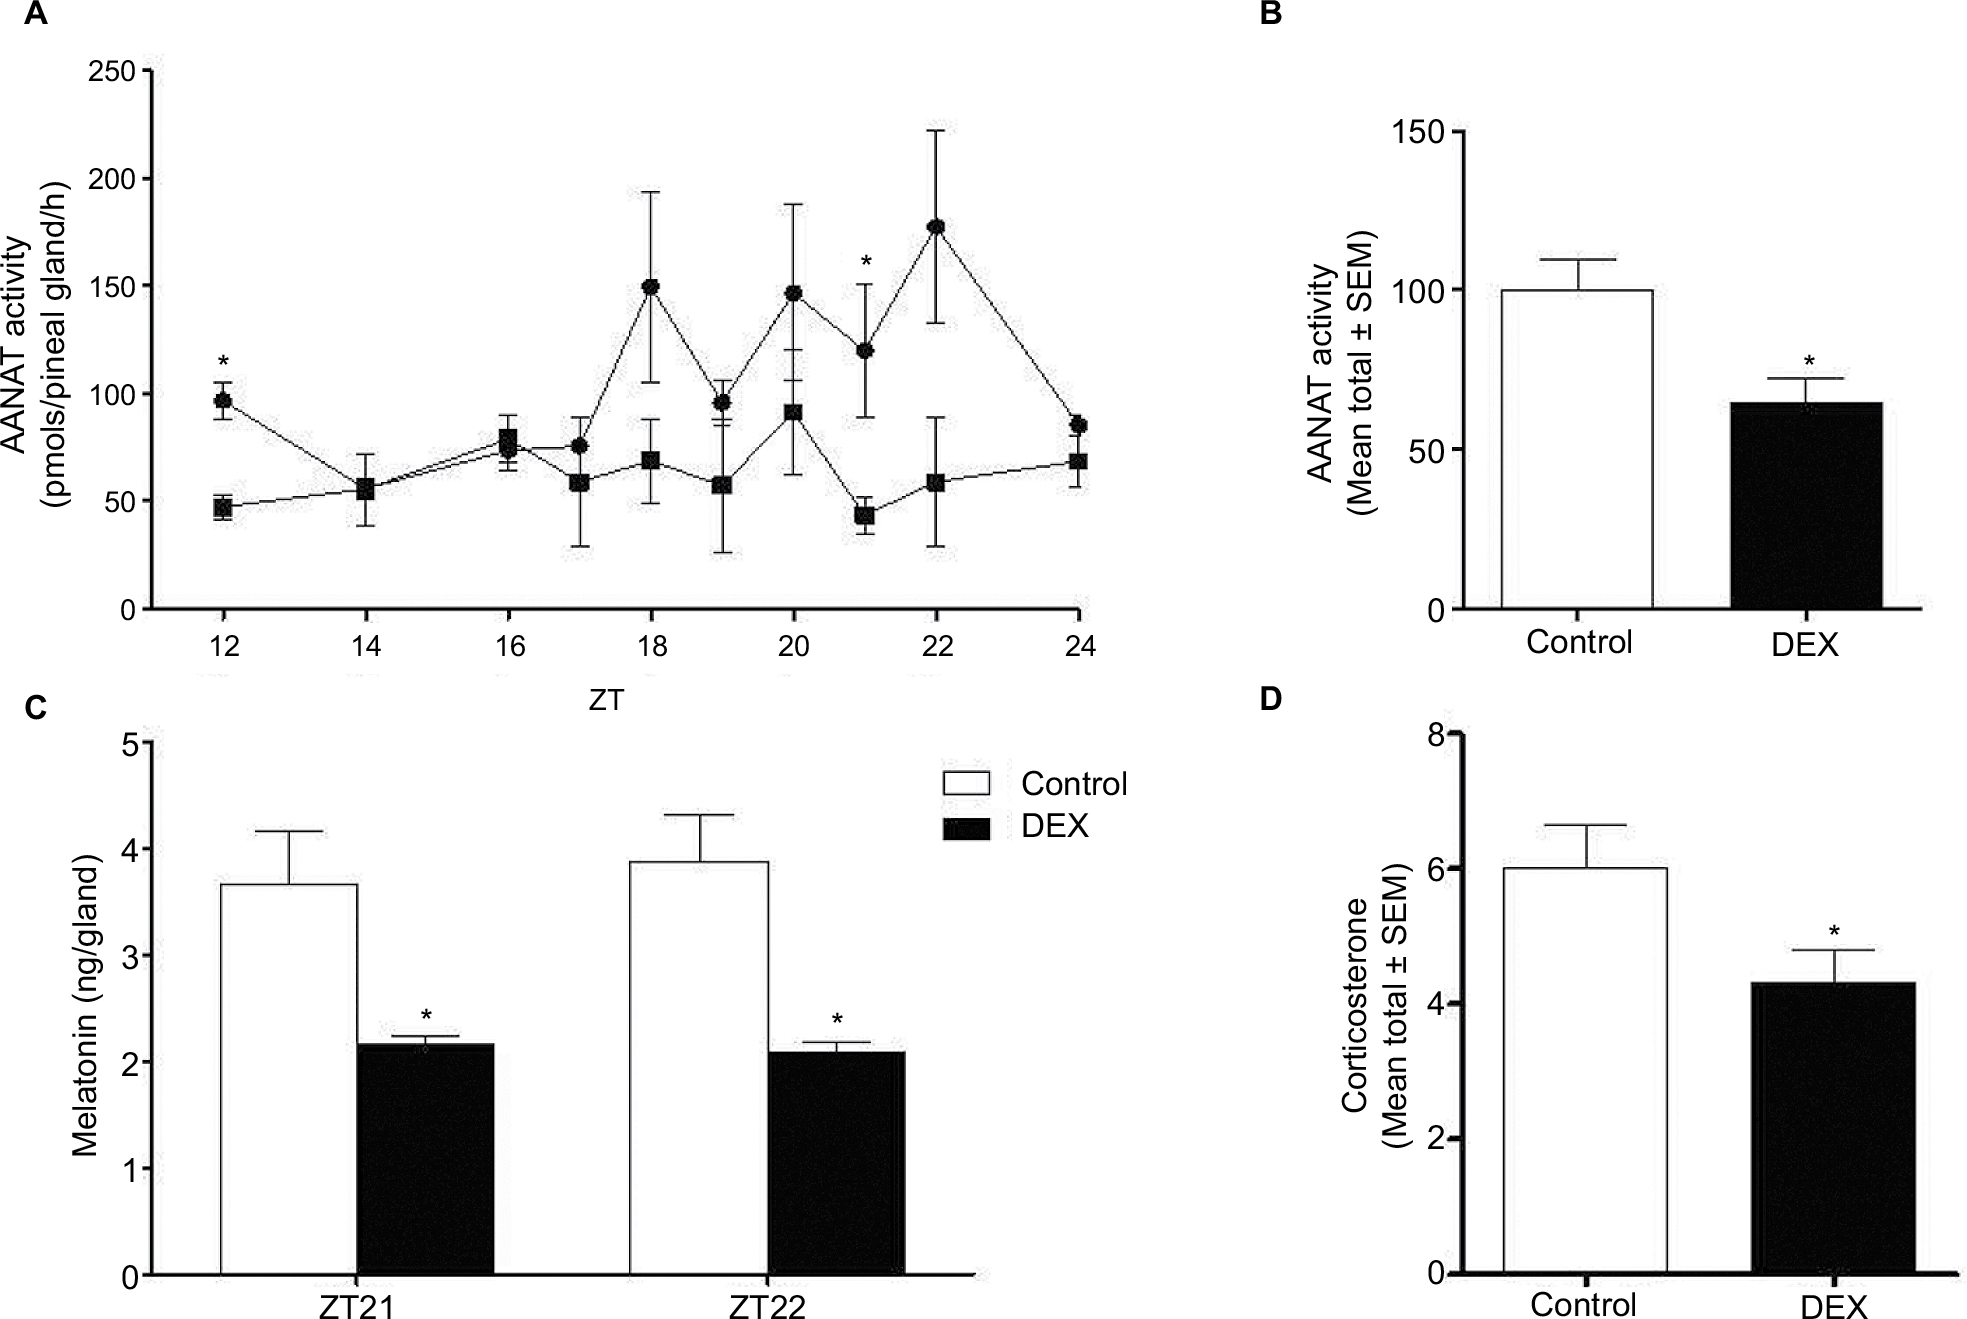 | Figure 4 AANAT activity, melatonin content, and plasma level of corticosterone were evaluated in Control and dexamethasone-treated rats (lines graph with circles and squares for Control and dexamethasone-treated rats, respectively). Notes: The results are represented as mean ± SEM. Quantification of AANAT activity, the values of AANAT activity over time were organized in the form of linear graph (A) at the indicated ZT (ZT12, ZT14, ZT16, ZT18, ZT20, ZT22, and ZT24), the results are represented as mean ± SEM (Student’s t-test *P<0.05), and bar graph (Control rats [white bars] and rats treated with dexamethasone [black bars]) by calculating the mean total of AANAT activity (the mean total of AANAT activity ± SEM) (Student’s t-test *P<0.05) (B) The values of melatonin quantification are expressed in nanograms/gland and represented as mean total of melatonin content (Student’s t-test *P<0.05) (C) at the indicated ZT (ZT21, and ZT22). Plasma levels of corticosterone are expressed in nanograms/mL (D) by calculating the mean total and represented as mean ± SEM (Student’s t-test *P<0.05) (n=6 for both groups). Abbreviations: AANAT, Arylalkylamine N-acetyltransferase; DEX, dexamethasone; ZT, Zeitgeber time. |
The effects of dexamethasone on the expression of enzymes involved in melatonin synthesis
The mRNA expression of Tph, Aanat, and Hiomt was assessed in pineal glands of Control and DEX rats at 6 time points (ZT17–ZT22). Tph- and Hiomt-mRNA expression was similar in both groups (Figure 5A, B), and Aanat expression decreased 0.60-fold at ZT19 in DEX rats (P<0.01; Figure 5C). Adenylate cyclase (Ac1) expression was similar in both groups at all points observed (Figure 5D); however, b1-adrenergic receptor decreased 0.47-fold at ZT18 in DEX rats (P<0.05; Figure 5E).
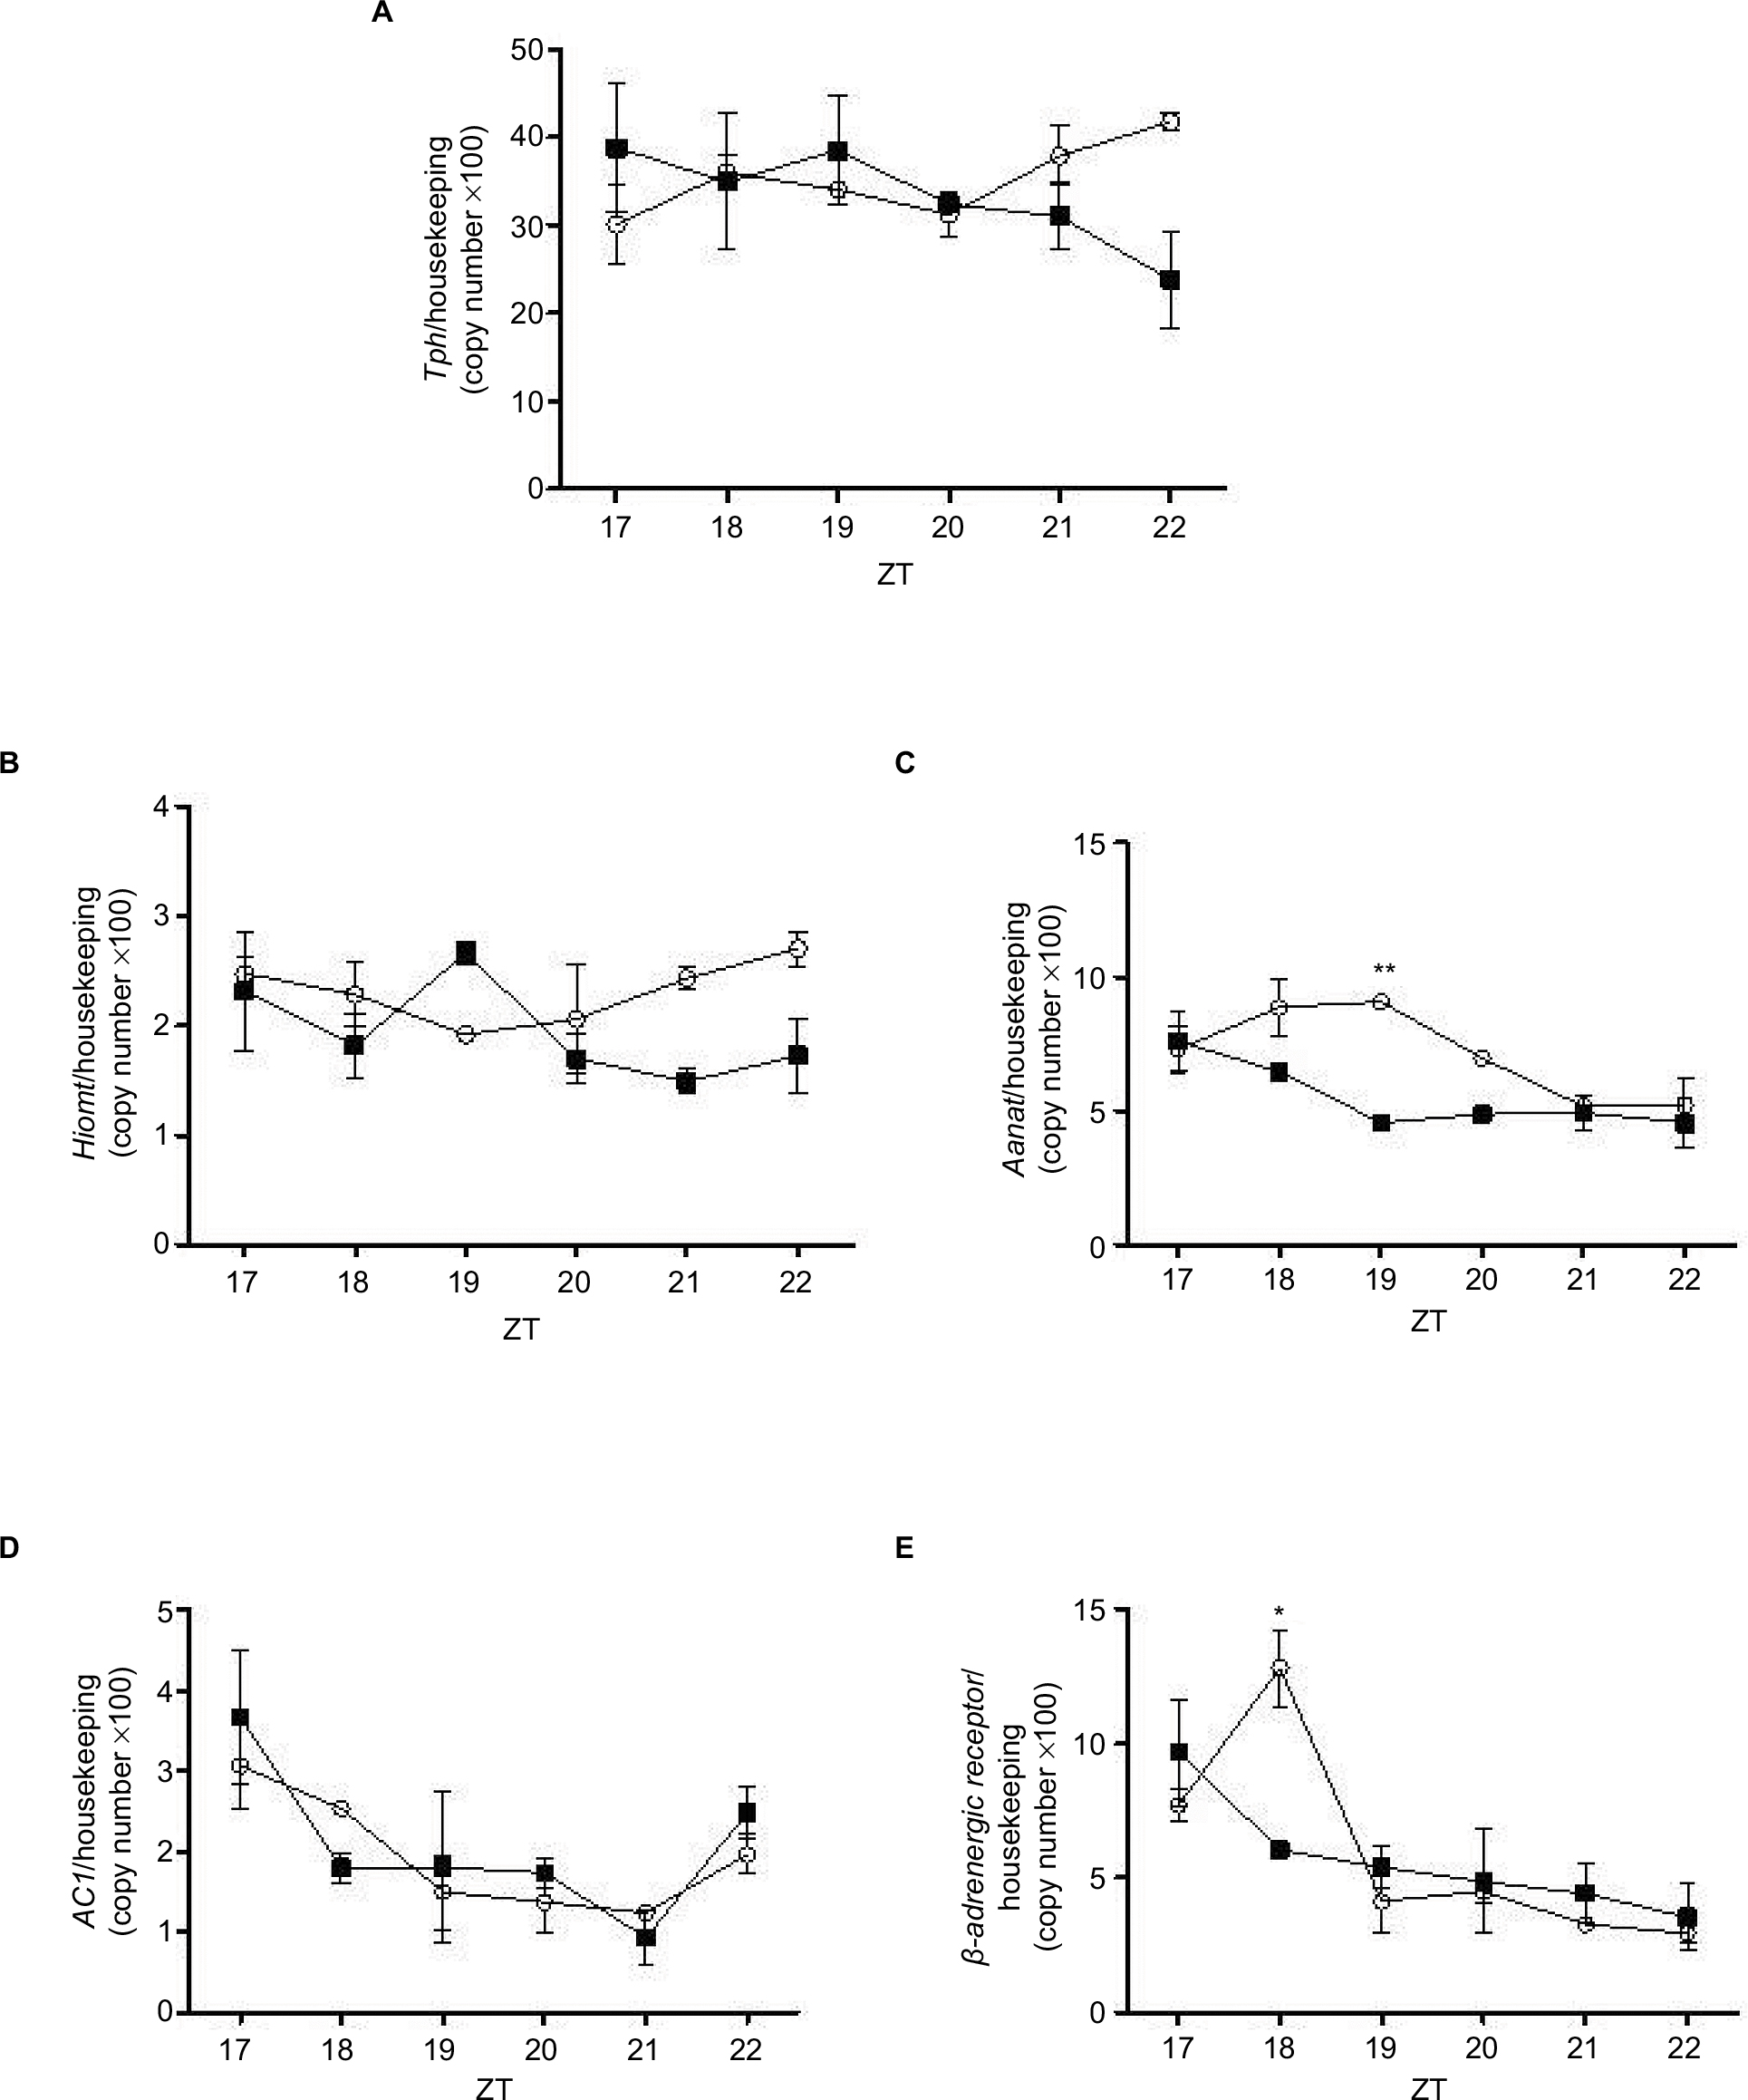 | Figure 5 Expression of Tph, Hiomt, Aanat, AC1, and B-adrenergic receptor in pineal glands isolated from control (line graph with circles) and treated with dexamethasone rats (line graph with squares). Notes: Animals were installed in 12 h light/dark cycle, fed with commercial Labina chow and water ad libitum. The animals were sacrificed at ZT17, ZT18, ZT19, ZT20, ZT21, and ZT22 and the pineal gland was collected and processed for extraction of total RNA and mRNA detection by real-time polymerase chain reaction of Tph (A), Hiomt (B), Aanat (C), AC1 (D), and β-adrenergic receptor (E). Gene expression values are represented as mean ± SEM. Two-way ANOVA (with Bonferroni posttests), *P<0.05, **P<0.01 (n=6 for both groups). Abbreviations: AANAT, Arylalkylamine N-acetyltransferase; AC1, Adenylate cyclase; ANOVA, analysis of variance; ZT, Zeitgeber time. |
Dexamethasone modulates the expression of clock genes in the pineal gland
Dexamethasone treatment led to alterations in the mRNA expression of several clock genes in the pineal gland. Bmal1 expression increased by 1.47-fold at ZT21 (P<0.05; Figure 6A). ReverbA expression increased by 1.70-fold at ZT17, and reduced by 0.58-fold at ZT18 (P<0.001; Figure 6B). Per1 mRNA expression was increased by 3.89-fold at ZT17 and by 7.50-fold at ZT21 (P<0.001; Figure 6C). Per2 mRNA expression increased by 2.11 at ZT17, decreased by 0.43-fold at ZT18 and increased by 5.77-fold again, at ZT21 (P<0.001; Figure 6D). Cry1 mRNA expression increased by 2.30-fold at ZT19 (P<0.05; Figure 6E) and Cry2 decreased by 0.42-fold at ZT18 when compared with the Control rats (P<0.001; Figure 6F).
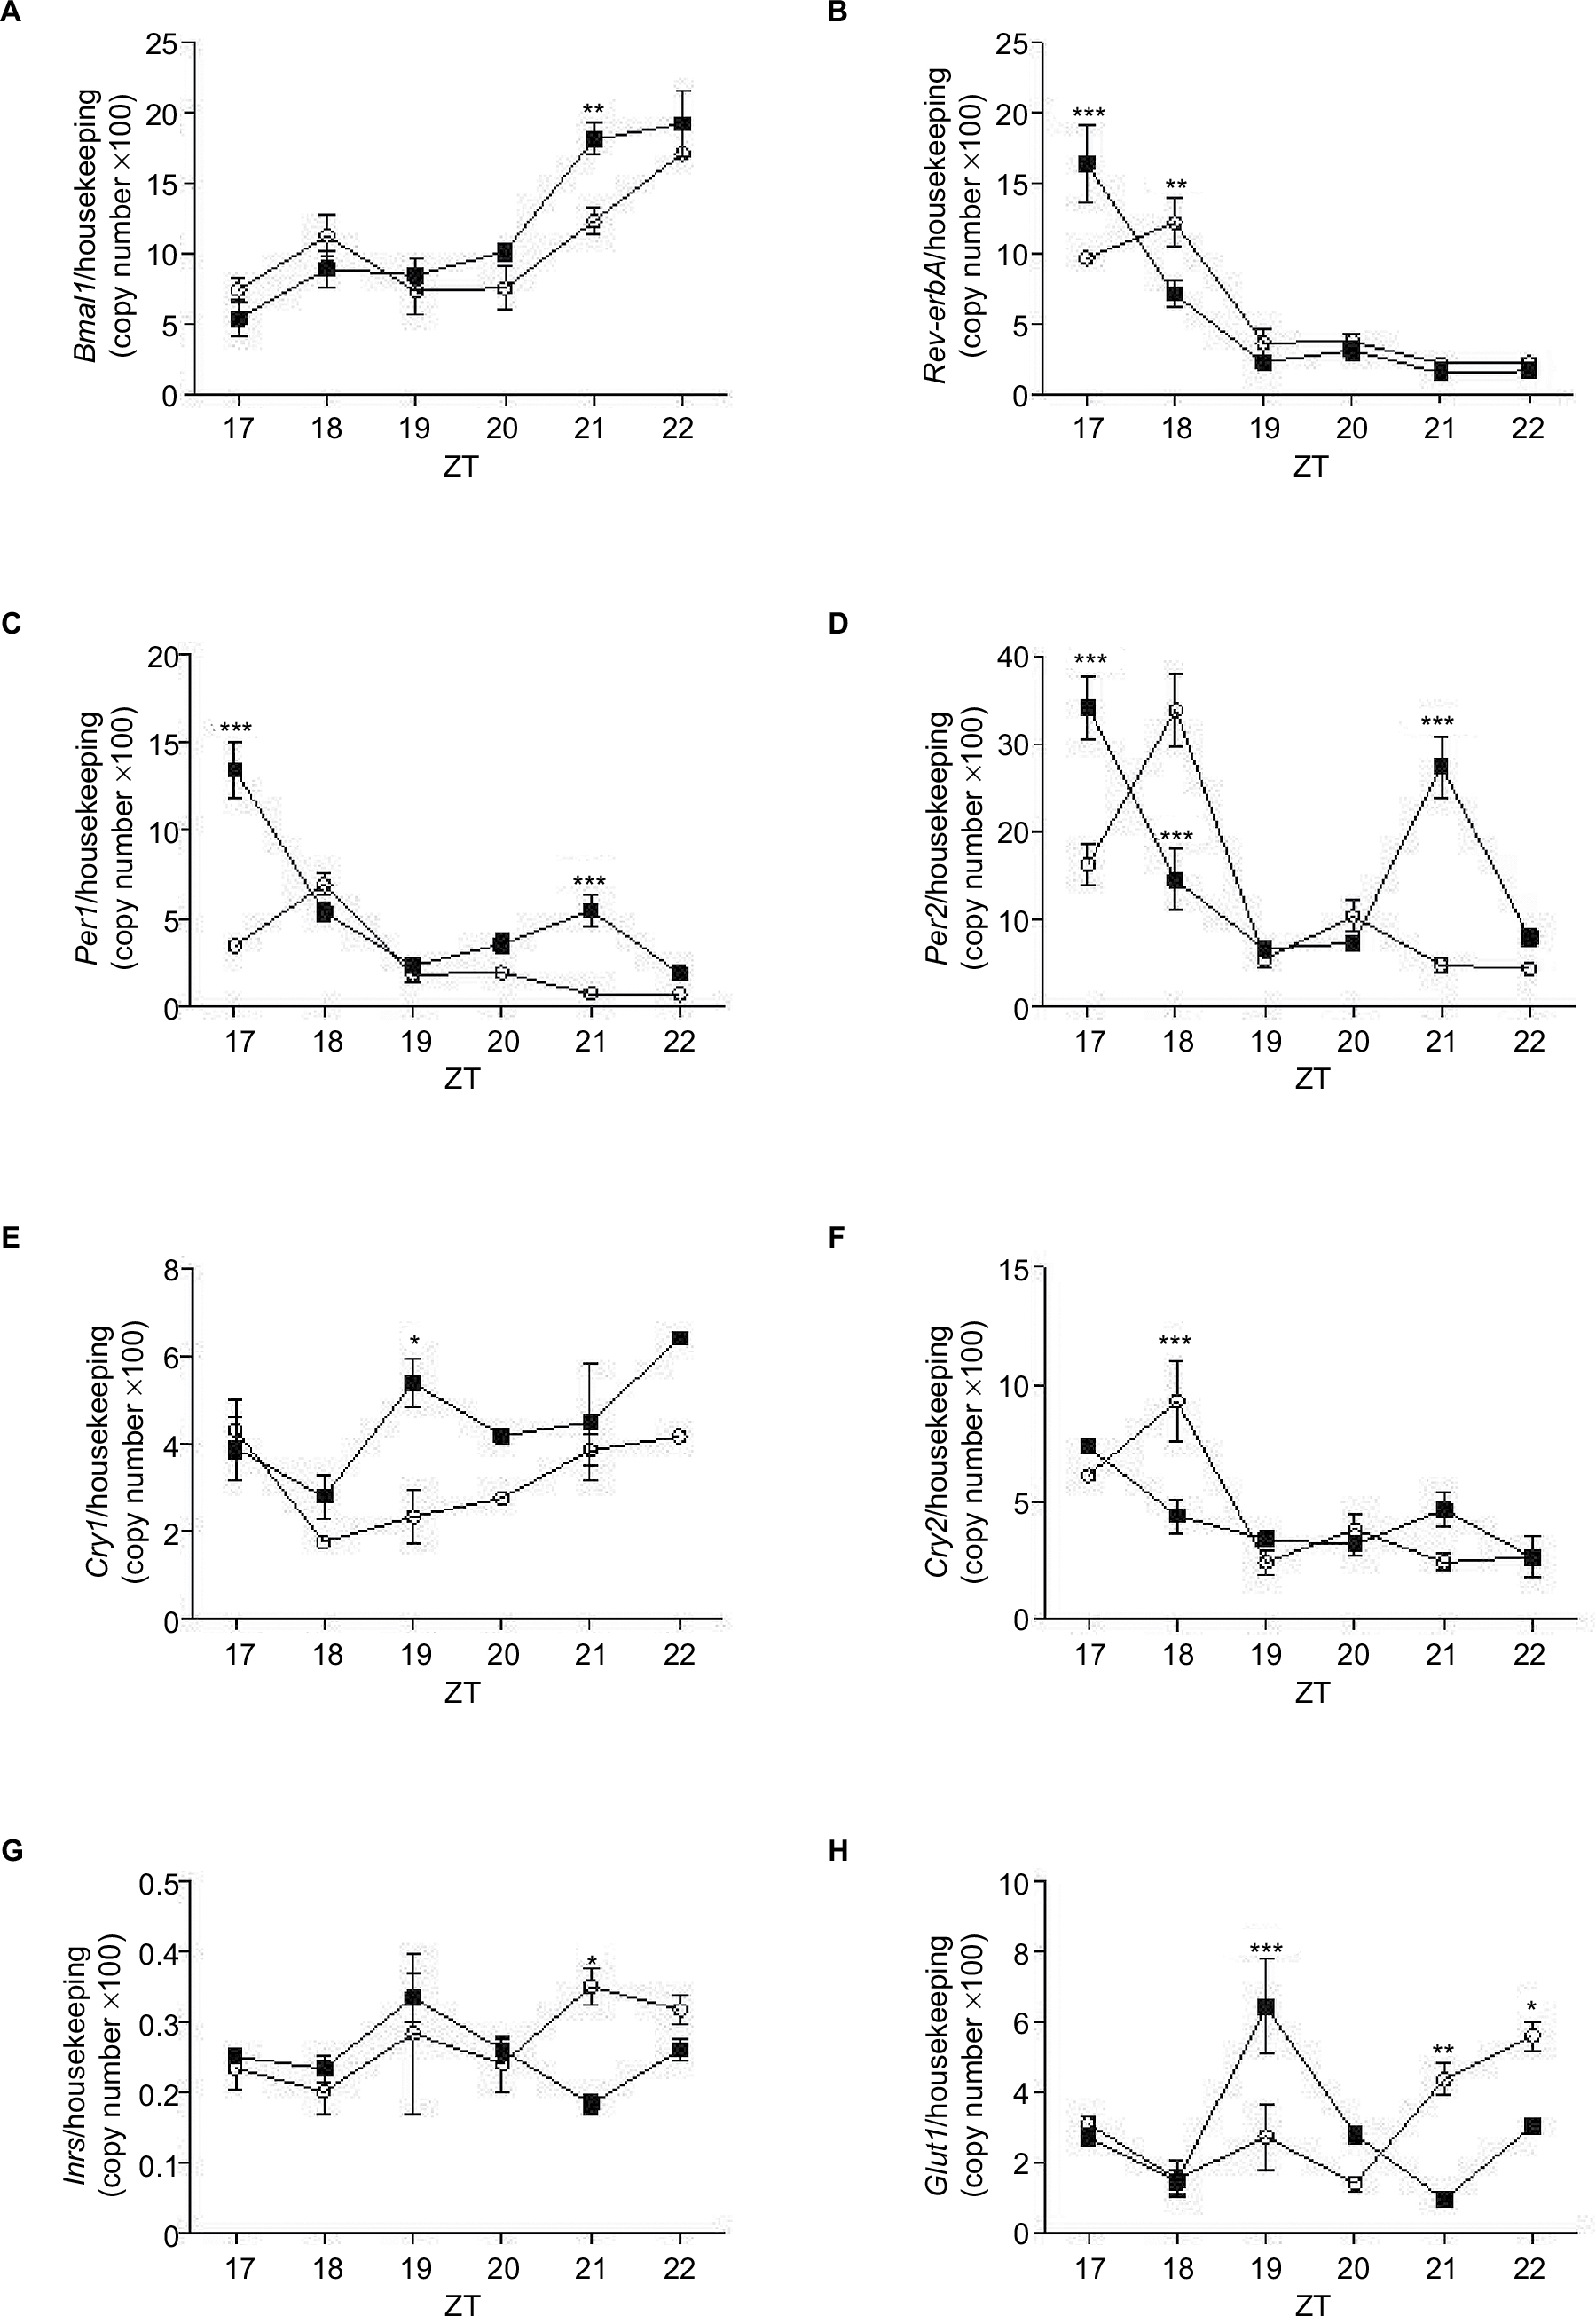 | Figure 6 Expression of Bmal1, Rev-erbA, Per1, Per2, Cry1, Cry2, Inrs, and Glut1 in pineal glands isolated from control (white bar) and treated with dexamethasone rats (filled bars). Notes: Animals were installed in 12 h light/dark cycle, fed with commercial Labina chow, and water ad libitum. The animals were killed at the times indicated and the pineal gland was removed and processed for extraction of total RNA and mRNA detection by real-time polymerase chain reaction of Bmal1 (A), Rev-erbA (B), Per1 (C), Per2 (D), Cry1 (E), Cry2 (F), Inrs (G), and Glut1 (H). Gene expression values are represented as mean ± SEM. Two-way ANOVA (with Bonferroni posttests), *P<0.05, **P<0.01, ***P<0.001 (n=6 for both groups). Abbreviations: ANOVA, analysis of variance; ZT, Zeitgeber time. |
Dexamethasone reduces Insr and Glut1 mRNA expression in rat pineal glands
The mRNA expression of insulin receptor (Inrs) and glucose transporter isoform 1 (Glut1) was evaluated in rat pineal glands of Control and DEX rats at ZT17-ZT22. Inrs mRNA expression was reduced 0.52-fold in DEX rats at ZT21 (P<0.05; Figure 6G), whereas Glut1 increased by 2.35-fold at ZT19 (P<0.001), and decreased by 0.22- and 0.54-fold at ZT21, and ZT22, respectively, when compared with the Control rats (P<0.01, and P<0.05, respectively; Figure 6H).
Discussion
DEX-treated rats showed reduced body weight, increased periepididymal fat content, hyperglycemia and hyperinsulinemia at night, resistance to insulin action, and reduction of pineal melatonin content. The significant reduction in weight of DEX-treated animals was consistent with the results of a previous study.49
We observed an increase in plasma glucose levels in both groups at night. Most rodents exhibit a nocturnal activity pattern, associated with the search for food and food intake. Consequently, plasma glucose peaks in the early night caused by food intake, followed by a decrease to its normal values after insulin secretion and action.50,51 In our model, however, DEX animals exhibited higher levels of glycemia throughout the last two-thirds of the night. The administration of dexamethasone attenuates insulin signaling, which in turn, reduces GLUT4 translocation to plasma membrane in different cellular tissues.52–54 Our results show that DEX rats have pronounced nocturnal glucose intolerance, associated to insulin resistance, and it is in accordance with others studies in the literature.55,56
Circadian oscillators may modulate different metabolic processes such as glucose metabolism, and signaling pathways of insulin and other hormones like adrenocorticotropic hormone, cortisol, and melatonin.57 It has been described that a disruption in the circadian system may lead to the development of metabolic diseases such as obesity, diabetes and cardiovascular disease.58,59 Melatonin is considered an output signal mediated by the circadian system, which participates in the synchronization of organs involved in the regulation of glycemia.60,61 In experimental and pathological conditions such as in streptozotocin-induced diabetes in rodents as well as in type 2 diabetes mellitus patients, there is a reduction of circulating melatonin levels.24,62 In vitro evidence shows that melatonin synthesis increases when pineal glands are incubated with insulin; these effects are due, in part, to an increase in PI3K activity63 and treatment of those pineal glands with a PI3K inhibitor (LY 294002) led to a diminished IR signaling, reduced melatonin synthesis and AANAT activity. In the present study, we analyzed the expression of InsR and Glut1 mRNA in the pineal glands of DEX-treated rats, and both transcripts were reduced at the same time points, where we detected reduced melatonin synthesis, hyperinsulinemia, and hyperglycemia. However, further studies are required to confirm the imbalance of IR/IGF1/IRS/PI3K signaling in the pineal gland in this experimental model.
In an attempt to further elucidate the mechanism by which glucocorticoids induce changes in melatonin levels, we evaluated the expression of key enzymes involved in the synthesis of melatonin (Tph, Aanat and Hiomt). In our work, the expression of Aanat, was reduced at ZT19, together with diminished melatonin synthesis, which might reflect AANAT activity, as demonstrated by other authors.64 Studies show that rats exposed to chronic stress have reduced serum melatonin levels and AANAT activity in the pineal gland.26,65 Other authors showed that stress produced by immobilization in situations of reduced levels of melatonin and AANAT activity are associated with reduced corticosterone levels, as was observed in DEX rats.34 We also observed a reduction in the expression Tph at ZT22 and Hiomt at ZT21, which could contribute to the reduction in the melatonin synthesis. However, aromatic L-amino acid decarboxylase (which is encoded by dopa decarboxylase gene, for example), remains unclear in this experimental model and may play a role in melatonin synthesis.
Furthermore, it is known that the rat pineal gland expresses glucocorticoid receptors (GRs), which are expressed in almost all cell types.66 Glucocorticoids positively or negatively regulate the expression of multiple clock genes through the activation of GRs, which, in turn, interact with glucocorticoid responsive elements (GREs) located in the promoter region of the genes.38,67 Moreover, it was recently demonstrated that glucocorticoids modulate the rhythmicity of several circadian clock genes in the peripheral tissues.36
Based on this evidence, we evaluated the expression of key circadian clock genes in pineal glands of DEX-treated rats, and found an increase in the expression of Bmal1. Studies have shown that DEX stimulates the transcriptional oscillation of multiple clock genes in cultured mesenchymal stem cells.68 In agreement with this finding, exposure of murine and human mesenchymal stem cells from bone marrow to dexamethasone triggers oscillatory expression of clock-related genes.69 Recent studies have shown that treatment of cultured osteoclasts with dexamethasone results in increased rhythmic expression of Per1, Per2, and Bmal1.70 Other authors observed a significant effect of dexamethasone in the pattern of circadian expression of CLOCK, PER2 and BMAIL1 in human visceral and subcutaneous adipose tissue, and increased expression of Per1 in a dose-dependent manner in cells of the mononuclear peripheral blood.71,72
Our data is in agreement with other authors, since we observed that Per1 and Per2 mRNA was significantly increased following dexamethasone treatment, but these alterations occurred at specific ZTs during the dark phase. In addition, it is possible to observe that ReverbA, Per1 and Per2 (ZT17-ZT18) are in opposite phase compared to Bmal1, as stated in the literature.73 However Per2 may be acting as a transcription factor independent of the clock machinery in ZT21. It has been shown that treatments with prednisolone are able to induce the expression of Per1 gene in vitro in human lymphocytes and monocytes, and physical stress by immobilization induces the expression of Per1 in peripheral tissues (heart, liver and lung) of mice.74,75 Moreover, glucocorticoids were capable of inducing the expression of Per1 in cultured rat fibroblasts.36 Chronic treatment of hepatic cells (HepG2) with prednisolone (0.5 mM), showed increased Per1 and Bmal1 expression, whereas Cry1 and ReverbA were reduced.76 Per2 expression was enhanced in cultured embryonic fibroblasts when incubated with 1 mM dexamethasone.77 Cry2 and Cry1 expression was enhanced in our study and the expression of Rev-erbA was increased at ZT17, although we did not observe lower expression of Bmal1 in the same ZT. Rev-erbA is involved with the secondary loop, thereby competing for the RORE in the Bmal1 promoter region, inhibiting the activation of BMAL1.14,78 Some authors showed that RORα is involved with a second loop that activates the transcription of Bmal1, and thus, in pineal glands from DEX rats, RORα may be the primary enhancer of BMAL1 expression; however, further experiments are necessary to verify this statement.15
In addition to its regulation by the CREB/CRE pathway and CLOCK/BMAL1 heterodimer binding to E boxes, it is suggested that Per1 transcription can be regulated by glucocorticoids and GRE.69,75 Other authors suggested that the induction of Per2 occurs by overlapping GRE and E-box region (GE2), at the proximal Per2 promoter in peripheral tissues.77 This hypothesis can be extended to other clock genes, since glucocorticoids can also stimulate the expression of Per1, Per2, and Rev-erbb in cell culture-dependent activation of functional GRE.68 However, Per1 and Aanat genes are modulated by cAMP, and this plays a central role in the oscillation mechanism of the rat pineal gland clock.8,9 We are aware that we studied only the nocturnal profile of gene expression, specially regarding clock genes, so we cannot rule out the possibility that dexamethasone treatment might abolish the daily rhythm or shift the peak of clock genes in the pineal gland.
In conclusion, our study shows that dexamethasone treatment induces nocturnal hyperglycemia and pronounced hyperinsulinemia. Furthermore, treatment with glucocorticoids reduces melatonin and corticosterone secretions. These reductions are associated with an alteration of the pineal circadian clock, which might modulate AANAT activity, reflecting a reduced synthesis of the pineal gland hormone melatonin. These results suggest the importance of HPA axis on melatonin synthesis, and a possible role of clock genes in pineal glands as well as metabolic effects presented in DEX-treated rats.
Acknowledgments
The authors are grateful for the technical assistance of Julieta Scialfa Falcão. This work was supported by Foundation for Research Support and Innovation in the State of Sergipe (FAPITEC) and Coordination of Improvement of Higher Education Personnel (CAPES).
Disclosure
The authors report no conflicts of interest in this work.
References
Reiter RJ. Melatonin: the chemical expression of darkness. Mol Cell Endocrinol. 1991;79:153–158. | ||
Moore RY, Lenn NJ. A retinohypothalamic projection in the rat. J Comp Neurol. 1972;146:1–14. | ||
Reppert SM, Weaver DR. Molecular analysis of mammalian circadian rhythms. Ann Rev Physiol. 2001;63:647–676. | ||
Davidson AJ, Yamazaki S, Arble DM, Menaker M, Block GD. Resetting of central and peripheral circadian oscillators in aged rats. Science. 2000;288:682–685. | ||
Takahaski K, Yamada T, Tsukita S, et al. Chronic mild stress alters circadian expressions of molecular clock genes in the liver. Am J Physiol Endocrinol Metab. 2013;1:304(3):E301–E309. | ||
Torres-Farfan C, Serón-Ferré M, Dinet V, Korf HW. Immuno-cytochemical demonstration of day/night changes of clock gene protein levels in the murine adrenal gland: differences between melatonin-proficient (C3H) and melatonin-deficient (C57BL) mice. J Pineal Res. 2006;40:64–70. | ||
Namihira M, Honma S, Abe H, Tanahashi Y, Ikeda M, Honma K. Daily variation and light responsiveness of mammalian clock gene, Clock and BMAL1, transcripts in the pineal body and different areas of brain in rats. Neurosci Lett. 1999;267:69–72. | ||
Von Gall C, Schneider-Hüther I, Pfeffer M, Dehghani F, Korf HW, Stehle JH. Clock gene protein mPER1 is rhythmically synthesized and under cAMP control in the mouse pineal organ. J Neuroendocrinol. 2001;13:313–316. | ||
Karolczak M, Burbach GJ, Sties G, Korf HW, Stehle JH. Clock gene mRNA and protein rhythms in the pineal gland of mice. Eur J Neurosci. 2004;19:3382–3388. | ||
Dunlap JC. Molecular bases for circadian clocks. Cell. 1999;96:271–290. | ||
Fukuhara C, Yamazaki S, Liang J. Pineal circadian clocks gate arylalkylamine N-acetyltransferase gene expression in the mouse pineal gland. J Neurochem. 2005;93(1):156–162. | ||
Albrecht U, Zheng B, Larkin D, Sun ZS, Lee CC. Are mPer1 and mPer2 essential for normal resetting of the circadian clock. J Biol Rhythms. 2001;16:100–104. | ||
Lowrey PL, Takahashi JS. Mammalian circadian biology: elucidating genome-wide levels of temporal organization. Annu Rev Genomics Hum Genet. 2004;5:407–441. | ||
Albrecht U, Eichele G. The mammalian circadian clock. Curr Opin Genet Dev. 2003;13:271–277. | ||
Duez H, Staels B. The nuclear receptors Rev-erbs and RORs integrate circadian rhythms and metabolism. Diab Vasc Dis Res. 2008;5:82–88. | ||
Arendt J. Melatonin and the mammalian pineal gland. In: Melatonin and the Mammalian Pineal Gland. London: Chapman and Hall; 1995:161–165. | ||
Simonneaux V, Ribelayga C. Generation of the melatonin endocrine message in mammals: a review of the complex regulation of melatonin synthesis by norepinephrine, peptides, and other pineal transmitters. Pharmacol Rev. 2003;55:325–395. | ||
Borjigin J, Li X, Snyder SH. The pineal gland and melatonin: molecular and pharmacologic regulation. Annu Rev Pharmacol Toxicol. 1999;39:53–65. | ||
Ganguly S, Gastel JA, Weller JL, et al. Role of a pineal cAMP-operated arylalkylamine N-acetyltransferase-14-3-3-binding switch in melatonin synthesis. Proc Natl Acad Sc USA. 2001;98:8083–8088. | ||
Klein DC. Evolution of the vertebrate pineal gland: the AANAT hypothesis. Chronobiol Int. 2006;23:5–20. | ||
Gupta BBP, Spessert R, Volrath L. Molecular components and mechanism of adrenergic signal transduction in mammalian pineal gland: regulation of melatonin synthesis. Indian J Exp Biol. 2005;43:115–149. | ||
Axelrod J, Wcrtmax RJ, Snyder SH. Control of hydroxyindole O-methyltransferase activity in the rat pineal gland by environmental lighting. J Bio. Chem. 1965;240:949–954. | ||
Aloyo VJ, Walker RF. Noradrenergic stimulation pineal glands in vitro. J Endocrinol. 1987;112:3–9. | ||
Stebeloyá K, Herichová I, Zeman M. Diabetes induces changes in melatonin concentrations in peripheral tissues of rat. Neuroendocrinol Lett. 2007;28:159–165. | ||
Pang SF, Tang F, Tang PL. Alloxan-induced diabetes and the pineal gland: differential effects on the levels of pineal N-acetylserotonina pineal melatonin, and serum melatonin. J Pineal Res. 1985;2:79–85. | ||
Otsuka M, Kato K, Murai I, Asai S, Iwasaki A, Arakawa Y. Roles of nocturnal melatonin and the pineal gland in modulation of water-immersion restraint stress-induced gastric mucosal lesions in rats. J Pineal Res. 2001;30:82–86. | ||
Zhao ZY, Touitou Y. Kinetic changes of melatonin release in rat pineal perfusions at different circadian stages: effects of corticosteroids. Acta Endocrinol. 1993;129:81–88. | ||
Ferreira ZS, Fernandes PACM, Duma D, Assreuy J, Avellar MCW, Markus RP. Corticosterone modulates noradrenaline-induced melatonin synthesis through inhibition of nuclear factor kappa B. J Pineal Res. 2005;38:182–188. | ||
Fernandes PACM, Bothorel B, Clesse D, et al. Local Corticosterone infusion enhances nocturnal pineal melatonin. Production in vivo. Neuroendocrinology. 2009;21:90–97. | ||
Son GH, Chung S, Kim K. The adrenal peripheral clock: glucocorticoid and the circadian timing system. Front Neuroendocrin. 2011;32:451–465. | ||
Chrousos GP, Kino T. Glucocorticoid action networks and complex psychiatric and/or somatic disorders. Stress. 2007;10:213–219. | ||
Boumpas DT, Chrousos GP, Wilder RL, Cupps TR, Balow GE. Glucocorticoids therapy for immune-mediated diseases: basic and clinical correlates. Ann Intern Med. 1993;119:1198–1208. | ||
Demisch L, Demisch K, Nickelsen T. Influence of dexamethasone on nocturnal melatonin production in healthy adult subjects. J Pineal Res. 1988;5:317–322. | ||
Yocca FD, Friedman. Effect of immobilization stress on rat pineal beta-adrenergic receptor-mediated function. J Neurochem. 1984;42:1427–1432. | ||
Messina G, Chieffi S, Viggiano A, et al. Parachute jumping induces more sympathetic activation than cortisol secretion in first-time parachutists. Asian J Sports Med. 2016;7(1):e26841. | ||
Balsalobre A, Brown SA, Marcacci L, et al. Resetting of circadian time in peripheral tissues by glucocorticoid signaling. Science. 2000;289:2344–2347. | ||
Nader N, Chrousos GP, Kino T. Circadian rhythm transcription factor CLOCK regulates the transcriptional activity of the glucocorticoid receptor by acetylating its hinge region lysine cluster: potential physiological implications. FASEB J. 2009;23:1572–1583. | ||
Dickmeis T. Glucocorticoids and the circadian clock. J Endocrinol. 2009;200:3–22. | ||
Andrade-Silva J, Cipolla-Neto J, Peliciari-Garcia RA. The in vitro maintenance of clock genes expression within txhe rat pineal gland under standard and norepinephrine-synchronized stimulation. Neurosci Res. 2014;81–82:1–10. | ||
Morgan L, Arendt J, Owens D, et al. Effects of the endogenous clock and sleep time on melatonin, insulin, glucose and lipid metabolism. J Endocrinol. 1998;157:443–451. | ||
Marçal AC, Leonelli M, Fiamoncini J, et al. Diet-induced obesity impairs AKT signaling in the retina and causes retinal degeneration. Cell Biochem Funct. 2012;31:65–74. | ||
Geloneze B, Tambascia MA. Laboratorial evaluation and diagnosis of insulin resistance. Arq Bras Endocrinol Metabol. 2006;50:208–215. | ||
Ahrén B, Sauerberg P, Thomsen C. Increased insulin secretion and normalization of glucose tolerance by cholinergic agonism in high fat-fed mice. Am J Physiol. 1999;277:E93–E102. | ||
Bonora E, Targher B, Alberiche M, et al. Homeostasis model assessment closely mirrors the glucose clamp technique in the assessment of insulin sensitivity. Diabetes Care. 2000;23:57–63. | ||
Carmo Buofiglio D, Peliciari Garcia RA, Amaral FGD, et al. Early-stage retinal melatonin synthesis impairment in streptozotocin-induced diabetic Wistar rats. Invest Ophth Vis Sci. 2011;52:7416–7422. | ||
Deguchi T, Axelrod J. Sensitive assay for serotonin N-acetyltransferase activity in rat pineal. Anal Biochem. 1972;50:174–179. | ||
Parfitt A, Weller JL, Klein DC, Sakai KK, Marks BH. Blockade by ouabain or elevated potassium ion concentration of the adrenergic and adenosine cyclic 3′,5′-monophosphate-induced stimulation of pineal serotonin N-acetyltransferase activity. Mol Pharmacol. 1975;11:241–255. | ||
Vandesompele J, De Preter K, Pattyn F, et al. Accurate normalization of real-time quantitative RT-PCR data by geometric averaging of multiple internal control genes. Genome Biol. 2002;3(7):RESEARCH0034. | ||
Jahng JW, Kim NY, Ryu V, et al. Dexamethasone reduces food intake, weight gain and the hypothalamic 5-HT concentration and increases plasma leptin in rats. Eur J Pharmacol. 2008;581:64–70. | ||
Penicaud L, Le Magnen J. Aspects of the neuroendocrine bases of the diurnal metabolic cycle in rats. Neurosci Biobehav R. 1980;4:39–42. | ||
Peschke E, Peschke D. Evidence for a circadian rhythm of insulin release from perifused rat pancreatic islets. Diabetologia. 1998;41:1085–1092. | ||
Caperuto LC, Anhê GF, Amansq AM, et al. Distinct regulation of IRS proteins in adipose tissue from obese aged and dexamethasone-treated rats. Endocrine. 2006;29:391–398. | ||
Sesti G. Pathophysiology of insulin resistance. Best Pract Res Clin Endocrinol Metab. 2006;20:665–679. | ||
Saad MJ, Folli F, Kahn JA, Kahn CR. Modulation of insulin receptor, insulin receptor substrate and phosphatidylinositol 3-kinase in liver and muscle of dexamethasone-treated rats. J Clin Invest. 1993;92:2065–2072. | ||
Sakoda H, Ogihara T, Anai M, et al, Dexamethasone-induced insulin resistance in 3T3-L1 adipocytes is due to inhibition of glucose transport rather than insulin signal transduction. Diabetes. 2000;49:1700–1708. | ||
Ruzzin J, Wagman AS, Jensen J. Glucocorticoid-induced insulin resistance in skeletal muscles: defects in insulin signalling and the effects of a selective glycogen synthase kinase-3 inhibitor. Diabetologia. 2005;48:2119–2130. | ||
Haus E. Chronobiology in the endocrine system. Adv Drug Deliv Rev. 2007;59:985–1014. | ||
Scheer FA, Hilton MF, Mantzoros CS, Shea SA. Adverse metabolic and cardiovascular consequences of circadian misalignment. Proc Natl Acad Sci USA 2009;106:4453–4458. | ||
Buxton OM, Pavlova M, Reid EW, Wang W, Simonson DC, Adler GK. Sleep restriction for 1 week reduces insulin sensitivity in healthy men. Diabetes. 2010;59:2126–2133. | ||
Picinato MC, Haber EP, Carpinelli AR, Cipolla-Neto J. Daily rhythm of glucose-induced insulin secretion by isolated islets from intact and pinealectomized rat. J Pineal Res. 2002;33:172–177. | ||
Alonso-Vale MIC, Andreotti S, Mukai PY, et al. Melatonin and the circadian entrainment of metabolic and hormonal activities in primary isolated adipocytes. J Pineal Res. 2008;454:422–429. | ||
Peschke E, Frese T, Chankiewitz E, et al. Diabetic Goto Kakizaki rats as well as type 2 diabetic patients show a decreased diurnal serum melatonin level and an increased pancreatic melatonin-receptor status. J Pineal Res. 2006;40:135–143. | ||
Peliciari-Garcia RA, Marçal AC, Silva JS, et al. Insulin temporal sensitivity and its signaling pathway in the rat pineal gland. Life Sci. 2010;87:169–174. | ||
Yuwiler A. Effects of steroids on serotonin-N-acetyltransferase activity of pineals in organ culture. J Neurochem. 1989;52:46–53. | ||
Troiani ME, Reiter RJ, Vaughan MK, Gonzalez-Brito A, Herbert DC. The depression in rat pineal melatonin production after saline injection at night may be elicited by corticosterone. Brain Res. 1988;450:18–24. | ||
Chrousos GP, Kino T. Intracellular glucocorticoid signaling: a formerly simple system turns stochastic. Sci STKE. 2005;2005(304):pe48. | ||
Charmandari E, Chrousos GP, Lambrou GI, et al. Peripheral clock regulates target-tissue glucocorticoid receptor transcriptional activity in a circadian fashion in man. PLoS One. 2011;6:e25612. | ||
So AYL, Bernal TU, Pillsbury ML, Yamamoto KR, Feldman BJ. Glucocorticoid regulation of the circadian clock modulates glucose homeostasis. Proc Natl Acad Sci USA. 2009;106:17582–17587. | ||
Wu X, Yu G, Parks H, et al. Circadian mechanisms in murine and human bone marrow mesenchymal stem cells following dexamethasone exposure. Bone. 2008;42:861–870. | ||
Fujihara Y, Kondo H, Noguchi T, Togari A. Glucocorticoids mediate circadian timing in peripheral osteoclasts resulting in the circadian expression rhythm of osteoclast-related genes. Bone. 2014;61:1–9. | ||
Gómez-Abellán P, Díez-Noguera A, Madrid JA, Luján JA, Ordovás JM, Garaulet M. Glucocorticoids affect 24 h clock genes expression in human adipose tissue explant cultures. PLoS One. 2012;7:e50435. | ||
Ohmori K, Nishikawa S, Oku K, et al. Circadian rhythms and the effect of glucocorticoids on expression of the clock gene period1 in canine peripheral blood mononuclear cells. Vet J. 2013;196;402–407. | ||
Schmutz I, Ripperger JA, Baeriswyl-Aebischer S, Albrecht U. The mammalian clock component PERIOD2 coordinates circadian output by interaction with nuclear receptors. Genes Dev. 2010;24:345–357. | ||
Fukuoka Y, Burioka N, Takata M, et al. Glucocorticoid increases hPer1 mRNA levels in human peripheral blood mononuclear cells in vitro or in vivo. J Biol Rhythms. 2005;20:550–553. | ||
Yamamoto T, Nakahata Y, Tanaka M, et al. Acute physical stress elevates mouse period 1 mRNA expression in mouse peripheral tissues via a glucocorticoid-responsive element. J Biol Chem. 2005;280:42036–42043. | ||
Koyanagi S, Okazawa S, Kuramoto Y, et al. Chronic treatment with prednisolone represses the circadian oscillation of clock gene expression in mouse peripheral tissues. J Mol Endocrinol. 2006;20:573–583. | ||
Cheon S, Park N, Cho S, Kim K. Glucocorticoid-mediated Period2 induction delays the phase of circadian rhythm. Nuclein Acids Res. 2013;41:6161–6174. | ||
Sato TK, Panda S, Miraglia LJ, et al. Functional genomics strategy reveals Rora as a component of the mammalian circadian clock. Neuro. 2004;43:527–537. |
 © 2018 The Author(s). This work is published and licensed by Dove Medical Press Limited. The
full terms of this license are available at https://www.dovepress.com/terms
and incorporate the Creative Commons Attribution
- Non Commercial (unported, 3.0) License.
By accessing the work you hereby accept the Terms. Non-commercial uses of the work are permitted
without any further permission from Dove Medical Press Limited, provided the work is properly
attributed. For permission for commercial use of this work, please see paragraphs 4.2 and 5 of our Terms.
© 2018 The Author(s). This work is published and licensed by Dove Medical Press Limited. The
full terms of this license are available at https://www.dovepress.com/terms
and incorporate the Creative Commons Attribution
- Non Commercial (unported, 3.0) License.
By accessing the work you hereby accept the Terms. Non-commercial uses of the work are permitted
without any further permission from Dove Medical Press Limited, provided the work is properly
attributed. For permission for commercial use of this work, please see paragraphs 4.2 and 5 of our Terms.