Back to Journals » International Journal of Nanomedicine » Volume 19
Chitosan-Rapamycin Carbon Dots Alleviate Glaucomatous Retinal Injury by Inducing Autophagy to Promote M2 Microglial Polarization
Authors Wang Q, Dong J, Du M, Liu X, Zhang S ![]() , Zhang D, Qin W, Xu X, Li X, Su R, Qiu L, Li B
, Zhang D, Qin W, Xu X, Li X, Su R, Qiu L, Li B ![]() , Yuan H
, Yuan H ![]()
Received 13 September 2023
Accepted for publication 22 February 2024
Published 6 March 2024 Volume 2024:19 Pages 2265—2284
DOI https://doi.org/10.2147/IJN.S440025
Checked for plagiarism Yes
Review by Single anonymous peer review
Peer reviewer comments 2
Editor who approved publication: Prof. Dr. RDK Misra
Qi Wang,1– 3,* Jiaxin Dong,4,* Mengxian Du,1,3,* Xinna Liu,1– 3 Shiqi Zhang,1 Di Zhang,1,3 Wanyun Qin,1,3 Xikun Xu,1,2 Xianghui Li,1,3 Ruidong Su,1,2 Leyi Qiu,1,2 Baoqiang Li,4,5 Huiping Yuan1
1Department of Ophthalmology, The Second Affiliated Hospital of Harbin Medical University, Harbin, People’s Republic of China; 2The Key Laboratory of Myocardial Ischemia, Harbin Medical University, Ministry Education, Harbin, People’s Republic of China; 3Future Medical Laboratory, the Second Affiliated Hospital of Harbin Medical University, Harbin, People’s Republic of China; 4Institute for Advanced Ceramics, State Key Laboratory of Urban Water Resource and Environment, Harbin Institute of Technology, Harbin, People’s Republic of China; 5Laboratory of Dynamics and Extreme Characteristics of Promising Nanostructured Materials, Saint Petersburg State University, St. Petersburg, Russia
*These authors contributed equally to this work
Correspondence: Huiping Yuan, Department of Ophthalmology, The Second Affiliated Hospital of Harbin Medical University, Harbin, 150081, People’s Republic of China, Email [email protected] Baoqiang Li, Institute for Advanced Ceramics, State Key Laboratory of Urban Water Resource and Environment, Harbin Institute of Technology, Harbin, 150081, People’s Republic of China, Email [email protected]
Introduction: Glaucoma is a prevalent cause of irreversible vision impairment, characterized by progressive retinal ganglion cells (RGCs) loss, with no currently available effective treatment. Rapamycin (RAPA), an autophagy inducer, has been reported to treat glaucoma in rodent models by promoting RGC survival, but its limited water solubility, systemic toxicity, and pre-treatment requirements hinder its potential clinical applications.
Methods: Chitosan (CS)-RAPA carbon dot (CRCD) was synthesized via hydrothermal carbonization of CS and RAPA and characterized by transmission electron microscopy, Fourier transform infrared spectra, and proton nuclear magnetic resonance. In vitro assays on human umbilical cord vein endothelial and rat retinal cell line examined its biocompatibility and anti-oxidative capabilities, while lipopolysaccharide-stimulated murine microglia (BV2) assays measured its effects on microglial polarization. In vivo, using a mouse retinal ischemia/reperfusion (I/R) model by acute intraocular pressure elevation, the effects of CRCD on visual function, RGC apoptosis, oxidative stress, and M2 microglial polarization were examined.
Results: CRCD exhibited good water solubility and anti-oxidative capabilities, in the form of free radical scavenging. In vitro, CRCD was bio-compatible and lowered oxidative stress, which was also found in vivo in the retinal I/R model. Additionally, both in vitro with lipopolysaccharide-stimulated BV2 cells and in vivo with the I/R model, CRCD was able to promote M2 microglial polarization by activating autophagy, which, in turn, down-regulated pro-inflammatory cytokines, such as IL-1β and TNF-α, as well as up-regulated anti-inflammatory cytokines, such as IL-4 and TGF-β. All these anti-oxidative and anti-inflammatory effects ultimately aided in preserving RGCs, and subsequently, improved visual function.
Discussion: CRCD could serve as a potential novel treatment strategy for glaucoma, via incorporating RAPA into CDs, in turn not only mitigating its toxic side effects but also enhancing its therapeutic efficacy.
Keywords: retina, ischemia/reperfusion injury, rapamycin, carbon dots, microglial polarization, autophagy
Graphical Abstract:

Introduction
Glaucoma, a neurodegenerative ocular disease, is characterized by selective, progressive, and irreversible retinal cell degeneration, particularly retinal ganglion cells (RGCs) and optic nerves, due to elevated intraocular pressure (IOP).1,2 Retinal ischemia/reperfusion injury, caused by high IOP, is an important risk factor contributing to RGC death. Despite extensive efforts towards early diagnosis and IOP reduction, via either medical or surgical interventions, continued RGC degeneration still threatens patient visual health.3,4 Owing to the fact that the mammalian retina lacks regenerative capacities, resulting in irreversible RGC loss, it is therefore imperative to develop alternative strategies to effectively achieve neuroprotection, as well as minimizing side effects, in order to enhance and complement current ophthalmic treatments.
Along with mechanical pressure-induced injuries, IOP-induced ischemia, and reperfusion after its reduction, results in excessive reactive oxygen species (ROS) production, which has been characterized as a well-known pathological mechanism underlying RGC injury.5–9 Therefore, a series of antioxidant strategies, via either natural substances or advanced nanomaterials, have been attempted as experimental treatments for glaucoma.10–13 However, merely depleting ROS within the retina only has limited protective effects,14,15 as high ROS levels not only directly induce irreversible mitochondrial oxidative damage and neuron apoptosis but also serve as an important signaling regulator to stimulate the activation of resident microglia.16–19 Microglia, the tissue-resident immune cells, play a pivotal role in initiating the inflammatory response. They serve as the first responders to injurious insults, in which they continuously survey the microenvironment to maintain homeostasis, via their scavenging and phagocytosing functions, along with providing neurotrophic support. Microglia also exhibit dynamic polarization over time and can switch between M1 or M2 phenotypes in response to environmental stimuli.17 M1 microglia are the classically activated type, defined by their expression of CD16/32, CD86, and CD40 markers;20 they also secrete pro-inflammatory cytokines, such as tumor necrosis factor-α (TNF-α), interleukin-1β (IL-1β) and interleukin-6 (IL-6).21 On the other hand, M2 microglia are alternatively activated, as well as expressing markers such as arginase-1 (Arg-1), CD206, and Chitinase-3-like-3;20,22 they produce neuro-supportive, anti-inflammatory cytokines, including interleukin-4 (IL-4), interleukin-10 (IL-10) and transforming growth factor-β (TGF-β).18 With respect to the glaucoma-affected retina, accumulating evidence suggests that microglial activation mainly leads to the exacerbation of RGC damage, via their roles in regulating neuroinflammation.5,19
It has also been suggested in previous studies that autophagy plays a critical role in governing microglial inflammation and phenotype switching.23–26 More specifically, enhanced autophagy was found to promote the M1-to-M2 microglia phenotypic switch.23,25 Indeed, the autophagy inducer rapamycin (RAPA) was able to promote RGC survival and treat glaucoma in rodent IOP models.27–29 However, multiple problems are present regarding the application of RAPA: 1) Systemic administration may result in deleterious side effects, such as immunosuppression,30 2) Due to RAPA having low water solubility (2.6 μg/mL),31 local ocular use is limited, and 3) Its effectiveness in animal models was in the context of pretreatment strategies, such as being administered prior to inducing elevated IOP, which is not directly translatable for a clinical setting.27,32 In light of these issues, other strategies, such as carbon dots (CDs), have become topics of great interest. CDs are a type of nanomaterial, with excellent biocompatibility and stable physicochemical properties, owing to it mainly being composed of elemental carbon, with size <10 nm.33,34 More specifically, CDs comprise a carbon core with different functional groups (eg, -OH, -COOH, -NH2) on their surfaces, enabling their water solubility, as well as forming conjugates with other in- and organic substances.35,36 Our previous study, involving synthesized N-doped CDs, derived from chitosan (CS), has exhibited significant anti-oxidative effects, via inhibiting exogenous and endogenous ROS generation.37 Based on those findings, in this study, we developed a polymeric nanoparticle, using hydrothermal carbonization to condense RAPA and CS, to form a composite CS-RAPA carbon dot (CRCD), which retained RAPA bioactivities, along with good water solubility and biocompatibility for intraocular injection. In vivo assessment of CRCD in a high IOP-induced ischemia/reperfusion (I/R)-injury mouse model to simulate acute glaucoma showed that it had similar effects as RAPA on restoring autophagy levels, along with lowering oxidative damage among retinal cells by depleting excessive ROS. Furthermore, similar to RAPA, CRCD inhibited microglia M1 polarization, thereby favoring polarization towards the M2 phenotype, resulting in reduced neuroinflammation, cell death, and subsequently the restoration of visual function in those I/R mice. All these findings thus demonstrate a promising nanomedicine, involving a multi-pronged strategy to effectively preserve RGCs and treat glaucoma.
Materials and Methods
CRCD Synthesis and Characterization
CRCD was synthesized via hydrothermal carbonization using RAPA (S115842, Aladdin, China), CS (C105799, Aladdin, China), and acrylamide (AAM; A108465, Aladdin, China). Briefly, 50 mg RAPA, 50 mg CS, and 400 mg AAM were mixed in 20 mL deionized water, and stirred at a speed of 800 rpm/min for 30 min using a magnetic stirrer (DF-101S, Henan Yuhua, China). The resulting mixture was sealed into a Teflon-equipped stainless-steel autoclave and subjected to a hydrothermal reaction at 220°C for 12 h. After cooling to room temperature, the solution was centrifuged at 8000 rpm/min for 15 min to remove large or agglomerated deposits, and remaining large particles were further removed by filtering the supernatant through a 0.22 µm membrane. The resulting CRCD was further purified by dialyzing the solution in deionized H2O with a dialysis membrane (molecular weight cut-off 500 Da, Solarbio, USA) for 8 hours, and the deionized H2O was changed every 2 hours, thereby yielding a clear yellow-brown solution. To facilitate the assessment of CRCD characteristics, CS-CD was synthesized by hydrothermal carbonization of CS and AAM (mass ratio = 50:400).
CRCD size and morphology were visualized using transmission electron microscopy (TEM; Tecnai G2-F30, FEI Company, USA) at 300 kV. Afterwards, to confirm the molecular bonding structure of CRCD, their ultraviolet-visible (UV-vis) spectra were detected with a TU 1901 UV-vis spectrophotometer, photoluminescence (PL) spectra with a Hitachi F-4600 fluorometer, equipped with a Xe lamp under ambient conditions, Fourier transform infrared (FTIR) spectra with Nicolet 380 FTIR (Thermo Electron Corporation, USA), and proton nuclear magnetic resonance (1H-NMR) spectra with Bruker NMR (NEXUS-870), with 84% DMSO and 16% D2O as a solvent.
Evaluating the Antioxidative Capacities of CRCD
To determine the antioxidative capacities of CRCD, the Fenton reaction was used, in which 9 mM FeSO4 was mixed with 9 mM salicylic acid. Different CRCD concentrations were then added to the mixtures, followed by the addition of 8.8 mM H2O2. These mixtures were incubated at 37°C for 15 min, and absorption of the resulting •OH, generated by the Fenton reaction, was measured at 510 nm, and calculated based on the following equation: •OH elimination efficiency (100%) = (A0-Ax)/A0×100%, in which A0 represented the absorbance of the blank, and Ax the absorbance of the sample.
For further quantification of CRCD antioxidative capabilities, 2,2-diphenyl-1-picrylhydrazyl (DPPH•), a stable nitrogen-centered free radical, was used, in which 100 μM DPPH-ethanol solution was blended with different concentrations of CRCD. Absorbances of the resulting mixtures were measured at 517 nm, and the DPPH• scavenging capabilities of CRCD were calculated the same way as for •OH.
Establishing the I/R Animal Model, Applying CRCD, and CRCD Kinetic Analysis
C57BL/6 mice (6–8 weeks) were obtained from the Experimental Animal Center of the Second Affiliated Hospital of Harbin Medical University. All experimental protocols conformed to the Guide for the Care and Use of Laboratory Animals (NIH, 8th Edition, 2011) and were approved by the Ethics Committee of the Second Affiliated Hospital of Harbin Medical University (REB #: sydwgzr2020-208).
I/R was induced among these mice, using a previously established procedure.7,38 Briefly, the anterior chamber of the eyeball was punctured with a 30G needle, and normal saline was instilled at a constant speed, with a pressure difference of 120 mmHg, for 40 min. Ten min after I/R injury was induced, 1 µg of CRCD or CS-CD in 1 µL solution was injected intravitreally. For the RAPA-treated I/R group, from 5 days pre-I/R to the day 1 post-I/R, mice received daily intraperitoneal RAPA injections (S115842, Aladdin), diluted in vehicle (10% ethanol, 40% PEG300, 5% Tween-80, 45% saline), at 10 mg/kg.27
The intraocular biosafety of CRCD was evaluated, via monitoring IOP with a rebound tonometer (Icare, Finland), at 1, 3, and 7-days post-injection. Retinal cell apoptosis, after injection with different CRCD concentrations (1–8 µg in 1 µL PBS) was also examined using the terminal deoxynucleotidyl transferase dUTP nick end labeling (TUNEL) assay, following the manufacturer’s instructions (12156792910, Roche Diagnostics GmbH, Germany). The resulting TUNEL images were captured under a fluorescence microscope (Olympus, Japan).
For in vivo kinetic studies of CRCD content within the retina, retinal and scleral/choroid samples were collected and subjected to ultra-performance liquid chromatography (UPLC; Nexera LC-40), to quantify CRCD tissue concentration, in which CRCD was separated on a Phenomenex Luna® 5 µm C18(2) 100 Å LC column (250 mm × 4.6 mm) at 40°C. The mobile phase comprised an acetonitrile-H2O mixture (61:39 ratio v/v), flow rate was 0.1 mL/min, and detection wavelength was 277 nm.
Cell Culture, Treatment, and Cell Viability Measurements
Human umbilical vein endothelial cells (HUVECs; HTX1922, Otwo Biotech, China), as well as murine microglia (BV2; AW-CNM081, Abiowell, China) and rat retinal cell line (R28; EUR201, Kerafast, UK) were used for in vitro studies. BV2 and R28 cells were cultured in DMEM (Meilunbio, China), and HUVECs in DMEM/F12 (GIBCO, UK), all of which were supplemented with 10% fetal bovine serum (ExCell) and 1% penicillin/streptomycin (Solarbio, China), at 37°C with 5% CO2. Nuclei were labeled with Hoechst 33342 (C1027, Beyotime, China), while cytoplasmic tubulin was stained using the Tubulin-tracker Deep Red Staining Kit (C2215S, Beyotime, China). Cells were then subjected to confocal laser scanning microscopy (CLSM; Carl Zeiss, LSM 800, Germany) to examine CRCD uptake and localization.
Oxidative stress injury and inflammatory cell models were established based on previously described procedures.39,40 In brief, for the oxidative stress injury model, HUVECs and R28 cells were incubated with culture medium containing 200 μM H2O2, for, respectively, 6 or 2 h. As for the inflammatory cell model, BV2 cells, stimulated by 1.5 μg/mL lipopolysaccharide (LPS; IL2020, Solarbio, China) for 24 h, were used. These cells were co-cultured with either 200 nM RAPA or 1.83 μg/mL CRCD. To study the effects of autophagy on BV2 cells, they were treated with 50 μM of the autophagy inhibitor chloroquine (CQ; HY-17589, MCE, USA) for 2 h, prior to treatment with CRCD/RAPA and LPS.
Cytotoxicity was then detected by CCK-8 assay (MA0218, Meilunbio, China), in which cells were seeded at 1 × 10⁴ cells per well in 96-well plates, and incubated with differing CRCD concentrations for 12 or 24 h. Afterwards, cells were washed twice with PBS, and incubated with fresh media containing CCK-8 for 4 h. The absorbance of each well was measured at 450 nm by a microplate reader (Synergy HTX, BioTek, USA).
As for cell viability, this was examined using Calcein AM and propidium iodide (PI) uptake assays, in which cells grown on glass coverslips in 24-well plates were incubated with Calcein AM and PI (C2015S, Beyotime, China) in culture medium for 30 min, followed by being washed 3 times with PBS. Fluorescence intensity was analyzed using a fluorescent microscope.
Vitro and in situ ROS, Oxidative Stress, and Anti-Oxidative Capacity Measurements
For in vitro ROS detection, HUVECs were seeded at 1 × 10⁵ cells/well in a 24-well plate. After treatment with 200 μM H2O2, cells were incubated, at 37°C for 30 min in darkness, with 10 μmol/L diacetyldichlorofluorescein (DCFH-DA) (S0033S, Beyotime, China). Cells were then washed 3 times, counterstained with Hoechst 33342 (C1027, Beyotime, China), and fluorescence captured under a fluorescence microscope.
In situ ROS levels were measured using the fluorescent dye dihydroethidium (DHE) (S0063, Beyotime, China), as described previously.41 In short, mouse eyes were dissected at 1 day post-I/R and frozen cross-sections, at 10 µm thickness, were obtained with a cryostat. These sections were subsequently incubated with 10 µM DHE at 37°C for 30 min in a light-protected humidified chamber. DHE is cell-permeable and reacts with superoxide to form ethidium, which intercalates within DNA and emits red fluorescence (518 nm/605 nm excitation/emission). Fluorescence intensity was measured and calculated with ImageJ.
Oxidative stress was then investigated in the form of malondialdehyde (MDA) levels, using the Lipid Peroxidation MDA Assay Kit, according to the manufacturer’s instructions (S0131, Beyotime, China). In brief, cells or retinas were broken down by a grinder in PBS, centrifuged at 12,000 × g for 10 min, and supernatant collected for measuring MDA, which was based on the absorbance of the product of the MDA-thiobarbituric acid reaction at 532 nm.
As for total antioxidative capacity (T-AOC), it was measured using the T-AOC Assay Kit with the FRAP method (S0116, Beyotime, China). Supernatants extracted from lysed cells or retinas, as mentioned above, were used for the assay. T-AOC was determined, based on the absorbance, at 593 nm, of the reduction of Ferric-tripyridyltriazine (Fe3+-TPTZ) by antioxidants under acidic conditions.
Quantitative Reverse Transcription PCR (RT-qPCR)
Total RNA was extracted from retinas with TRIzol (Invitrogen, USA), and reverse-transcribed into cDNA using the Transcription First Strand cDNA Synthesis kit (Roche Diagnostics GmbH, Germany). qPCR was then carried out, according to the manufacturer’s protocols, with NovoStart®SYBR qPCR SuperMix (E096, Novoprotein, China). mRNA expression was normalized to β-actin with the 2−ΔΔCt method. Primer sequences were provided in Supplementary Table 1.
Western Blot
Total protein was extracted from cells and retinas with the RIPA Lysis Buffer (P0013B, Beyotime, China), and 20 µg for each sample was diluted in sample loading buffer, denatured at 95°C for 5 min, and electrophoresed on 12.5% SDS-polyacrylamide gel. Proteins were transferred to polyvinylidene fluoride membranes, which were blocked by 5% skim milk in tris buffer saline with 0.1% Tween-20 (TBST) for 1 h at room temperature, then incubated with the following primary antibodies: LC3B for both LC3-II/I (1:1000; ab192890, Abcam, UK), p62 (1:1000; 5483, PTM Bio, China), TNF-α (1:1000; 60,291, Proteintech, USA), and TGF-β (1:1000; ab92486, Abcam, UK) overnight at 4°C. Afterwards, membranes were washed 3 times with TBST, and incubated with horseradish peroxidase-conjugated secondary antibody (1:10,000, Bioss, China) for 1 h at room temperature. Protein bands were visualized by enhanced chemiluminescence (ECL, MA0186, Meilunbio, China) and quantified with ImageJ. β-actin (1:1000, 5436, PTM Bio, China) served as the housekeeping gene.
Immunofluorescence and Histological Analyses
For immunofluorescence staining, mice were sacrificed, perfused with 4% paraformaldehyde (PFA), and eyeballs fixed overnight in 4% PFA at 4°C. After fixation, they were dehydrated by 25% sucrose, frozen at −80°C, embedded in optimal cutting temperature compound, and sectioned into 5 µm sections with a cryostat. As for cells, they were grown on glass coverslips in 24-well plates, washed 3 times in PBS, and fixed with 4% PFA for 30 min at room temperature. Retinal tissue sections or cells were then blocked in 0.5% goat serum for 1 h and incubated with the following primary antibodies overnight at 4°C: LC3B (1:100; ab18709, Abcam, USA), p62 (1:100; 39749S, Cell Signaling Technology, USA), ionized calcium-binding adaptor molecule-1 (Iba-1, 1:100; ab283319, Abcam, UK), CD16/32 (1:100; ab223200, Abcam, UK), Arg-1 (1:100; sc-271430, Santa Cruz, USA), and NeuN (1:100; ab134014, Abcam, UK). Afterwards, tissue sections or cells were incubated with Alexa Fluor 488- or 594-conjugated secondary antibodies for 1 h at room temperature. Nuclei were stained with 4′,6-diamidino-2-phenylindole (DAPI) for 5 min. Images were obtained with either a fluorescence microscope, or a CLSM, and quantified with ImageJ software.
Visual Functional Analyses and Optical Coherence Tomography (OCT) Imaging
To examine the visual function of mice, light/dark transition and optomotor response tests were used, as previously described.6,42 In brief, the light/dark transition test involves 2 equally sized chambers, a dark chamber and an illuminated one, with an aperture located in the middle wall allowing mice to move freely between them. After depriving the mice of light for at least 2 h, a 10-min test was performed, in which the length of time that the mice spent in the light chamber, and the number of transitions between the 2 chambers was recorded.
As for the optomotor response test, LCD screens were placed around the inner wall to provide the black and white stripes at different spatial rotation frequencies, while the mouse was placed at the platform in the center of the apparatus. Four spatial rotation frequencies were used: 0.05, 0.1, 0.2, and 0.3 cycles/degree (cpd). After adapting for a few minutes, mice were tested at each frequency for 2 min, and head movements corresponding to the stripes were recorded.
For OCT imaging, it was performed at different retinal layers using Beiming-Kun technology (400,000 ultrawide-angle, full-field, TowardPi Medical Technology Ltd., Beijing, China). Mouse eyes were routinely dilated after intraperitoneal anesthesia, according to the manufacturer’s instructions, in order to capture high-definition scans of different retinal layers.
Bioinformatic Analyses
For bioinformatic analyses, high-throughput sequencing data from the GSE20521 dataset was obtained from the GEO database,43 and compared using Gene Expression Omnibus (GEO2R) to the sequencing data obtained from the retinas of normal and I/R mice. Differentially expressed genes (DEGs) were identified, based on them being P <0.05 in a 2-sample t-test, as well as having fold change thresholds of ≥1.50 for up-regulation, or ≤0.67 for down-regulation. Gene ontology (GO) enrichment analysis was then performed on these DEGs, using the database for annotation, visualization, and integrated discovery (version 2021).44
Statistical Analyses
All values are presented as mean ± standard error of the mean (SEM), from at least 3 independent experiments. Statistical analysis was performed using GraphPad Prism (version 9.5, GraphPad Software Inc.). Data were analyzed by unpaired Student’s t-test for comparisons between 2 groups or one-way analysis of variance (ANOVA) followed by Tukey’s post hoc-test for comparisons among 3 or more groups. P <0.05 was considered statistically significant.
Results
Successful Synthesis of CRCD
As shown in the schematic in Figure 1A, CRCD was synthesized from RAPA, CS, and AAM, using the hydrothermal carbonization method. CRCD was then examined under TEM, in which they were found to be monodisperse, with the average particle size being at 3.7 nm (Figure 1B). Additionally, under UV–vis spectra analysis, CRCD exhibited peaks at 277 nm, corresponding to the characteristic peak of RAPA, as well as 324 nm, which was attributed to the n-π* transition of the C=O double bond (Figure 1C). Furthermore, under visible light, the CRCD aqueous solution was transparent, while under 365 nm UV light, it exhibited bright blue fluorescence (Figure 1C). All of these findings indicated successful synthesis, particularly with respect to the incorporation of RAPA within CRCD.
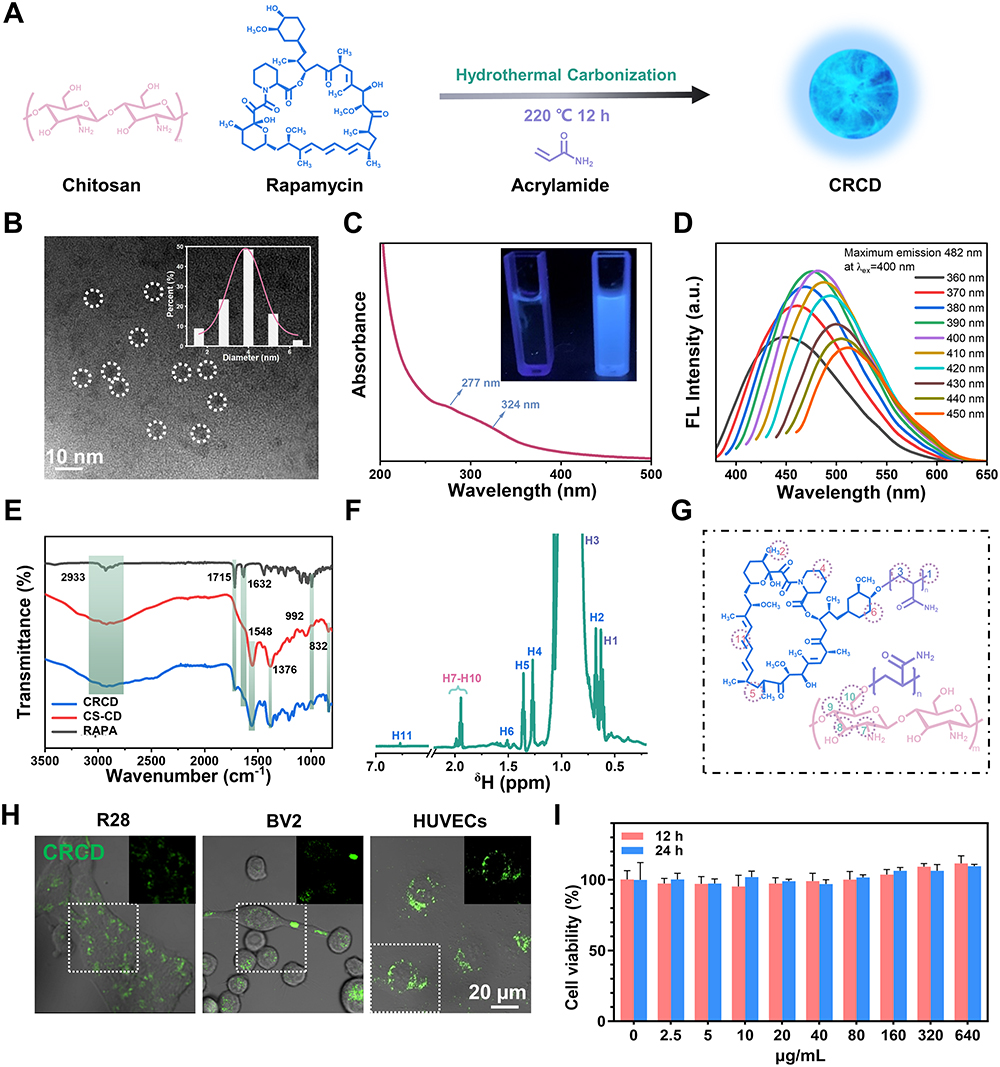 |
Figure 1 Composite chitosan (CS)-rapamycin (RAPA) carbon dot (CRCD) was successfully synthesized. (A) Schematic depicting CRCD synthesis from RAPA, CS, and acrylamide. (B) Transmission electron micrograph of CRCD. Inset shows size distribution. (C) Ultraviolet-visible spectra for CRCD. Inset shows CRCD aqueous solution (right) and deionized H2O (left) under UV light. (D) Photoluminescence spectra for CRCD at different excitation wavelengths. (E) Fourier transform infrared spectra for RAPA, CS-CD, and CRCD. (F) Proton nuclear magnetic resonance spectra and (G) their corresponding molecular structural components for CRCD. (H) Confocal laser scanning microscopy images for rat retinal cell line (R28), murine microglia (BV2) and human umbilical cord vein endothelial cell (HUVEC) uptake of CRCD (200 µg/mL), with green fluorescence excitation at 405 nm (overlaid on brightfield). (I) HUVEC viability under different CRCD concentrations, based on the CCK-8 assay. n = 3-6/group for (I). |
With respect to PL, its emission wavelengths shift towards longer ones, as the excitation wavelengths increase from 360 to 450 nm (Figure 1D). For CRCD, the strongest emission wavelength was observed at 482 nm, which resulted from an excitation wavelength of 400 nm.
To further analyze CRCD chemical structures, we investigated its FTIR spectra and compared it to that of RAPA and CS-CD, in which FTIR signals at 2810–3022 cm−1 were associated with the stretching vibrations of C-H bonds; this was present among RAPA and both CD types (Figure 1E). However, RAPA and CRCD, unlike CS-CD, also exhibited 2 peaks, in 1715 and 1632 cm−1, corresponding to the stretching vibrations of, respectively, C=O and C=C bonds in RAPA (Figure 1E). RAPA also had a unique peak at 992 cm−1, attributed to the out-of-plane deformation of C=C. As for CS-CD and CRCD, they had 3 unique peaks at 1548, 1376, and 832 cm−1, corresponding, respectively, to the stretching vibrations of N-H, C-N, and β-1,4-glycosidic bonds of CS (Figure 1E). All these results therefore indicated that CRCD was indeed formed from the combination of RAPA and CS, which was further supported by 1H-NMR spectra findings, where for CRCD, 2 distinct signals at 0.64 and 0.95 ppm were detected (Figure 1F). These signals corresponded to H1 and H3 in the polyacrylamide portion of the CRCD molecule (Figure 1G). Additional signals at 0.69, 1.28, 1.37, 152 and 7.68 ppm indicated the presence of H2, H4, H5, H6 and H11 of RAPA,45 while a region from 2.01 to 1.93 ppm was identified as containing the amino sugar residues (H7-H10) of CS (Figure 1F and G). Overall, the CRCD molecule comprised a polyacrylamide portion, as well as functional units derived from RAPA and CS, indicating their successful incorporation.
CRCD uptake by HUVECs, BV2, and R28 cells was confirmed using CLSM, in which CRCD-containing cells exhibited green fluorescence upon excitation at 405 nm, which was absent among untreated cells (Figure 1H and Figure S1A). We then further examined its localization within those cells, first by overlaying CRCD fluorescence images with Hoechst 33342, a live nuclei stain, then by overlaying CRCD images with cytoplasmic tubulin staining. We found that CRCD and Hoechst 33342 staining did not overlap with each other, but CRCD and tubulin staining did, in R28 cells (Figure S1B and C). The overlap between CRCD and tubulin staining was also present in HUVECs (Figure S1D). All these observations thus indicated that CRCD was localized to the cytoplasm. CRCD biocompatibility was subsequently evaluated among HUVECs, based on the CCK-8 assay, where HUVEC viability was found to be >95%, under exposure to differing CRCD concentrations, ranging from 0 to 640 µg/mL, for 12 or 24 h, indicating that CRCD cytotoxicity was negligible (Figure 1I). Similar findings were found for BV2 and R28 cells (Figure S1E and F).
CRCD Was More Effective in Improving Visual Function and Preserving Retinal Structure Compared to RAPA in a Mouse Retinal I/R Model
To examine CRCD bio-safety, different concentrations (1–8 µg in 1 µL PBS) were intravitreally injected into normal mouse retinas, and TUNEL+ retinal cells were quantified 3 days post-injection. No apoptotic retinal cells nor significant IOP alterations were present among the CRCD-injected mice (Figure S2A and B). We then examined the in vivo kinetics of CRCD, using UPLC, within the retina and choroid/sclera tissues, at 6 h, 1 day, 3 days, and 7 days post-injection. We found that in the retina, CRCD was detected 6 h post-injection, with peak concentration at 24 h, at ~1.5 µg/mg, after which it declined due to gradual metabolization, becoming barely detectable after 7 days. A similar pattern was also found for CRCD in the choroid/sclera, but with a much lower peak concentration of ~0.5 µg/mg, for the choroid/sclera (Figure S2C).
After confirming CRCD uptake and biosafety in the retina, the in vivo effects of CRCD were further examined in the mouse retinal I/R model, established by acute IOP elevation, in which 4 groups were established: Normal, I/R, I/R+RAPA, and I/R+CRCD. For I/R+CRCD mice, 1 µg CDs was intravitreally injected 10 min after I/R induction, while for I/R+RAPA, 10 mg/kg RAPA was intraperitoneally injected for 6 consecutive days, starting from 5 days prior to I/R induction, as previously described.27 The potential of CRCD to improve visual function in I/R mice was first examined, in which the mice were subject to the light/dark transition test at 7 days post-injury (Figure 2A). There, it was observed that I/R, compar ed to Normal, had significant increases in the time spent in the light chamber (Figure 2B), as well as lower transition numbers (Figure 2C). These changes, however, were reversed towards that of Normal in I/R+RAPA, and these reversals occurred to a greater extent among I/R+CRCD mice (Figure 2B and C). As for the optomotor response test (Figure 2D), also carried out at 7 days post-injury, and for all the tested frequencies (0.05, 0.1, 0.2, 0.3 cpd), I/R had significantly fewer head movements, compared to Normal (Figure 2E–H). However, the number of head movements increased towards that of Normal among I/R+CRCD; a similar increase, though to a lesser extent, occurred among I/R+RAPA (Figure 2E–H). All these findings thus suggested that CRCD, compared to RAPA, was more able to preserve visual function post-retinal I/R injury.
 |
Figure 2 CRCD, compared to RAPA, was more effective in improving visual function and preserving retinal structure post-ischemia/reperfusion (I/R) injury. (A) Schematic of the light/dark transition test. (B) Time spent in the light chamber among Normal, I/R, I/R+RAPA, and I/R+CRCD mouse groups. (C) Number of transitions between the light and dark chambers among the 4 groups. (D) Schematic of the optomotor response (OMR) test. Number of head movements elicited under the OMR test for (E) 0.05, (F) 0.1, (G) 0.2, and (H) 0.3 cycles per degree (cpd), among the 4 groups. (I) Optical coherence tomography scans and (J) quantification of retinal thicknesses among the 4 groups. (K) Immunofluorescence staining images and (L) quantification of NeuN+ cells within the ganglion cell layer (GCL) among the 4 groups. n = 5/group for (B–C, E–H and K–L), n = 4/group for (I and J). *P < 0.05, **P < 0.01, ***P < 0.001. |
To examine whether these visual functional improvements were also associated with changes in retinal structure, OCT, a widely employed glaucoma monitoring method,46 was conducted, in which it showed that among I/R mice, retinal thickness was significantly lower than for Normal. However, I/R+CRCD had a significant increase in retinal thickness back towards that of Normal (Figure 2I and J). A similar finding was observed for immunofluorescence staining of NeuN, in which I/R decreased NeuN+ RGCs within the ganglion cell layer (GCL) at 7 days post-injury (Figure 2K and L), while NeuN+ RGCs significantly increased towards that of Normal among I/R+CRCD.
A group treated only with CS-CD (1 µg CD intravitreally injected 10 min after I/R induction), after retinal I/R injury (I/R+CS-CD), was also examined in comparison to Normal, I/R and I/R+CRCD, in which for the light/dark transition test, I/R+CS-CD had longer stay durations in the light chamber (Figure S3A), along with slightly lower transition numbers (Figure S3B), compared to I/R+CRCD mice. As for the optomotor response test, significantly fewer head movements were present among I/R+CS-CD, compared to I/R+CRCD groups, for 0.1–0.3 cpd (Figure S3C–F). Furthermore, immunofluorescence staining for NeuN+ RGCs in the GCL found that I/R+CS-CD had significantly lower NeuN+ numbers than I/R+CRCD, though both were higher than I/R (Figure S3G–H). Overall, CS-CD may confer some protective effects against retinal I/R injury, but it was not as effective as CRCD, possibly due to the absence of rapamycin. All these findings thus demonstrate that CRCD was able to aid in preserving RGCs and retinal structure to improve visual function post-I/R and was more effective in doing so than CS-CD.
CRCD Was Able to Alleviate Oxidative Stress Post-Retinal I/R Injury
To elucidate the underlying mechanism behind the protective effect of CRCD against I/R-induced retinal injury, as well as its greater effectiveness compared to RAPA, we initially investigated the pivotal event involved in that retinal injury, superoxide generation. It is an early event in pathological IOP-induced injury, with cells in the inner retinal layers, such as RGCs and vascular endothelial cells, being most exposed to the free radicals being produced.47,48 Indeed, the I/R mouse group was associated with increased superoxide production at 1 day post-I/R, as indicated by DHE staining (Figure 3A and B). These levels, though, were lowered towards that of Normal in I/R+RAPA, and reduced even further in I/R+CRCD (Figure 3B). A similar pattern was also observed for MDA, a byproduct of lipid oxidation occurring in cells under oxidative stress (Figure 3C). However, for T-AOC, it was significantly lower in I/R compared to Normal (Figure 3D). T-AOC in I/R+CRCD, though, increased back towards that of Normal, which was not the case for I/R+RAPA (Figure 3D), indicating that CRCD had significantly enhanced antioxidative effects in vivo versus RAPA.
 |
Figure 3 CRCD alleviated oxidative stress in a mouse retinal I/R model. (A) Representative dihydroethidium (DHE) staining image, indicating superoxide production, and (B) quantification of reactive oxygen species (ROS) levels among Normal, I/R, I/R+RAPA, and I/R+CRCD mouse groups. Fluorescence was measured in terms of arbitrary units (AU). (C) Malondialdehyde (MDA) levels, a marker of oxidative stress, among the 4 groups. (D) Total antioxidative capacity (T-AOC) levels among the 4 groups. n = 3/group for all experiments. *P < 0.05, **P < 0.01, ***P < 0.001. |
CRCD Exhibited Antioxidative Capabilities in vitro
The antioxidative protective effect of CRCD was also verified in vitro, in which HUVECs were exposed to H2O2, in the absence or presence of either RAPA or CRCD. Free-radical scavenging abilities was then determined in terms of DCFH-DA fluorescence (Figure 4A and B), in which compared to untreated control (Normal), H2O2-treated HUVECs had significantly higher fluorescence. However, these levels were lowered towards that of Normal in the H2O2+RAPA group, and were reduced even further in H2O2+CRCD (Figure 4B). The same trend was also observed for R28 cells (Figure S4A and B). MDA content among these HUVECs exhibited a similar trend to that observed with mouse retinal tissue, in which the H2O2 group had significantly elevated levels, which were attenuated upon RAPA exposure (Figure 4C). Moreover, H2O2+CRCD had the lowest MDA levels, being comparable to that of Normal (Figure 4C).
 |
Figure 4 CRCD exhibited antioxidative capabilities and was more effective in reducing ROS in vitro, compared to RAPA, via its direct scavenging of free radicals. (A) Diacetyldichlorofluorescein (DCFH-DA) fluorescence images and (B) ROS quantification among untreated control (Normal) HUVECs, as well as those treated with H2O2 (H2O2), H2O2 with RAPA (H2O2+RAPA), and H2O2 with CRCD (H2O2+CRCD) for 6 h. (C) MDA levels among the 4 groups. Free radical scavenging rates for (D) •OH and (E) DPPH• scavenging, under different CRCD concentrations. (F) Half maximal inhibitory concentrations (IC50) for CRCD on •OH and DPPH•. n = 3/group for all experiments. ***P < 0.001. |
We then examined the free radical scavenging activity of CRCD, based on their efficacy in clearing •OH and DPPH•. CRCD effectively scavenged •OH (Figure 4D) and DPPH• (Figure 4E) in a dose-dependent manner. Furthermore, the half maximal inhibitory concentrations for CRCD on •OH and DPPH• were, respectively, 407.58 and 291.05 µg/mL (Figure 4F). This may be due to the fact that CS in CRCD provides hydrogen atoms, which could react with •OH or DPPH• to form more stable macromolecules.37,49,50 Additionally, the greater effectiveness of CRCD, compared to RAPA, in lowering oxidative stress may likely be owed to CRCD being not only able to inhibit ROS production via inducing autophagy to scavenge abnormal mitochondria, as with RAPA,30,32,51 but also by direct scavenging of pre-existing excessive free radicals within the cell.
CRCD Was Able to Regulate Microglial Polarization to Attenuate Retinal Inflammation
In glaucomatous RGC damage, ROS, acting as intracellular signaling molecules, are able to directly induce RGC apoptosis, as well as impair supportive glia cell functions, thereby facilitating secondary RGC degeneration.47 Given that both CRCD and RAPA were able to effectively mitigate oxidative stress injuries on day 1 post-I/R, the restoration of proper glial function may serve as the basis behind the different levels of retinal protection between CRCD and RAPA-treated I/R mice. To validate this postulation, we focused on transcriptome changes within retina tissue at 48 hours post-I/R, via analyzing mRNA-seq data (GSE20521 in the GEO database). A total of 557 DEGs were identified, of which 450 were up-regulated, and 107 down-regulated, in I/R versus Normal groups (Figure 5A and B). GO enrichment analysis determined that these DEGs were most enriched for biological processes (BP) associated with inflammation and oxidative stress (Figure 5C). More specifically, the top 3 enriched BPs were inflammatory response, response to LPS, and positive regulation of TNF production, surpassing those associated with oxidative stress, such as response to hypoxia and hydrogen peroxide; other enriched BPs included positive regulation of microglial cell migration and microglia-mediated cytotoxicity, as well as IL-6 and 1β production (Figure 5C and Supplementary Table 2). It is worth noting that TNF-α, IL-6 and IL-1β have been identified as the primary cytokines produced by M1 polarized microglia.18,21 All these findings indicated that retinal inflammation plays a key role in glaucoma pathogenesis at 48 h after the decline in IOP, which may be due to microglial polarization into the M1 phenotype.
 |
Figure 5 Bioinformatics analyses revealed that pro-inflammatory and oxidative stress pathways were enriched post retinal I/R injury. (A) Volcano plot showing the 557 differentially expressed genes (DEGs) between Normal and I/R retinas in the GSE20521 dataset from the GEO database. (B) Heat map showing the 450 up-regulated (purple), and 107 down-regulated (blue) genes. (C) Gene ontology (GO) enrichment analysis of the DEGs. n = 6/group. Fold change (FC) ≥ 1.5 or ≤0.67, P < 0.05. |
To further confirm this association between M1 polarization and inflammation, immunofluorescence staining was carried out, where I/R mice, compared to Normal, had significant increases in CD16/32+Iba-1+ cells associated with M1 microglial polarization (Figure 6A and B). Interestingly, though, cell counts were significantly lowered in I/R+RAPA group, and this decrease was present to a greater extent in I/R+CRCD (Figure 6A and B). These patterns were also present for TNF-α, IL-1α, and IL-1β expression levels under both Western blot and RT-qPCR, in which at 3 days post-I/R, I/R group had significantly higher expression levels for those pro-inflammatory cytokines versus Normal. However, these levels decreased towards that of Normal among I/R+CRCD (Figure 6C–F and Figure S5A). Further analyses illustrated that this decreased M1 microglial polarization and pro-inflammatory marker expression were concomitant with increased M2 polarization, in the form of increased Arg-1+Iba-1+ cells, among I/R+CRCD, compared to I/R and I/R+RAPA (Figure 6G and H). Additionally, the highest levels of cytokines associated with neuronal growth, such as TGF-β and IL-4, were present among I/R+CRCD (Figure 6I–L). Moreover, I/R+CRCD, compared to I/R and I/R+RAPA, had the fewest number of TUNEL+ apoptotic cells (Figure S5B and C). Collectively, these data indicated that CRCD favored microglial polarization from the pro-inflammatory M1 to the pro-repair M2 state, which likely contributed to the retinal tissue and functional preservation associated with CRCD.
 |
Figure 6 CRCD regulates microglial polarization to attenuate I/R-induced retinal inflammation. (A) Representative immunofluorescence staining images and (B) CD16/32+Iba-1+ cell counts among Normal, I/R, I/R+RAPA, and I/R+CRCD mouse groups. (C) Western blot image and (D) quantification of TNF-α protein expression among the 4 groups. Quantification of relative mRNA expression levels for (E) TNF-α and (F) IL-1α. (G) Representative immunofluorescence staining images and (H) Arg-1+Iba-1+ cell counts among the 4 groups. (I) Western blot image and (J) quantification of TGF-β protein expression among the 4 groups. Quantification of relative mRNA expression levels for (K) TGF-β and (L) IL-4. (M) Representative Western blot image and quantification of protein expression levels for autophagy markers (N) LC3 (II/I) and (O) p62 among the 4 groups. n = 3/group for (A–L), n = 4/group for (M–O). *P < 0.05, **P < 0.01, ***P < 0.001. |
Increasing evidence has suggested that autophagy also plays a role in microglial polarization.23–25,52 Therefore, Western blot analysis was performed to examine autophagy-related protein expression,53 where it was determined that no significant changes in expression levels for the common autophagosome marker LC3 (LC3-II/LC3-I) were present between I/R and Normal groups (Figure 6M and N). However, for another autophagosome marker, p62, its expression was significantly higher among I/R versus Normal (Figure 6M and O). The presence of increased p62, with unchanged LC3, among I/R mice indicated that I/R injury resulted in lowered autophagosome turnover, in accordance with previous findings.27 P62 levels decreased towards that of Normal levels among I/R+RAPA and I/R+CRCD, with the latter showing an even more pronounced reduction (Figure 6O). Conversely, LC3 (II/I) expression was significantly upregulated in I/R+CRCD, compared to Normal and I/R (Figure 6N), indicating that though RAPA was able to restore normal autophagy processes, CRCD had a stronger effect on autophagy activity by activating it.
CRCD Favored M2 Microglial Polarization via Inducing Autophagy
To elucidate the underlying bases behind CRCD favoring M2 microglial polarization, while minimizing potential confounding effects from other retinal tissue cells, BV2 cells were treated with 1.5 μg/mL LPS for 24 h to induce the M1 phenotype, followed by treatment with either RAPA (LPS+RAPA) or CRCD (LPS+CRCD). It was found that LPS exposure increased CD16/32+Iba-1+ fluorescence intensity, which, however, was decreased by either RAPA or CRCD administration, indicating that they both lowered M1 polarization (Figure 7A and B). This reduction of M1 polarization, though, was coupled with increased M2 polarization, in the form of Arg-1+Iba-1+ among LPS+CRCD, compared to LPS and LPS+RAPA (Figure 7C and D). In accordance with these findings, pro-inflammatory cytokines IL-6, IL-1β, and TNF-α were significantly lower among LPS+RAPA and LPS+CRCD, compared to LPS (Figure 7E–G), while the highest expression levels for anti-inflammatory cytokines IL-4, IL-10, and TGF-β were observed in LPS+CRCD (Figure 7H–J). Therefore, CRCD was able to both promote M2 polarization, along with inhibiting M1 polarization, while RAPA only lowered M1 microglia.
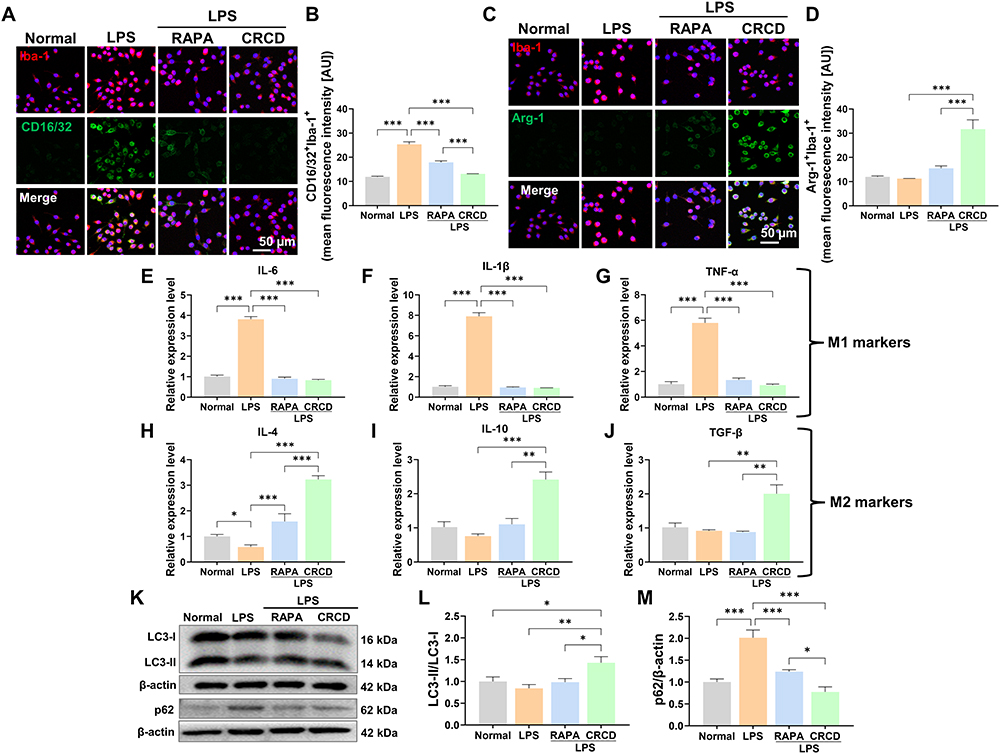 |
Figure 7 CRCD induced M2 microglial polarization in vitro via activating autophagy in lipopolysaccharide (LPS)-stimulated BV2 cells. (A) Representative immunofluorescence images and (B) quantification of CD16/32+Iba-1+ among Normal, LPS, LPS+RAPA, and LPS+CRCD BV2 cell groups. (C) Representative immunofluorescence images and (D) quantification of Arg-1+Iba-1+ cells among the 4 groups. Relative expression levels for (E–G) pro-inflammatory (IL-6, IL-1β, TNF-α) and (H–J) anti-inflammatory cytokines (IL-4, IL-10, TGF-β) among the 4 groups. (K) Representative Western blot image and quantification of protein expression levels for autophagy markers (L) LC3 (II/I) and (M) p62, among the 4 groups. n = 3/group for all experiments. *P < 0.05, **P < 0.01, ***P < 0.001. |
To verify whether CRCD fostering M2 polarization over M1 was based on it promoting autophagy, Western blot analysis measured LC3 (II/I) protein expression levels, which were the highest among LPS+CRCD (Figure 7K and L), indicating greater autophagic vacuole formation. By contrast, p62 levels were the highest among LPS, indicating lowered autophagic flux, but decreased towards that of Normal among LPS+RAPA and LPS+CRCD, the latter to an even greater extent (Figure 7K and M). Taken together, these observations indicate that CRCD favored the formation of autophagic vacuoles and promoted autophagic flux within microglia, contributing to their polarization to the M2 phenotype.
This association was further confirmed by pre-treating BV2 cells with the autophagy inhibitor CQ, prior to their exposure to LPS and CRCD (Figure 8A). Western blot analyses found that CQ pretreatment reversed the decrease in p62 protein expression by CRCD; furthermore, due to CQ inhibiting the fusion between the autophagosome and lysosome into the autolysosome, resulting in LC3-II accumulation,53 there was an increase in LC3-II/I in LPS+CRCD+CQ (Figure 8B–D). These findings indicate that autophagy inhibitor CQ possesses the capability to block CRCD-induced autophagy. This was further supported by immunofluorescence staining, in which similar trends to that observed in Western blot were found for LC3 and p62 puncta among LPS+CRCD and LPS+CRCD+CQ groups (Figure 8E–G). Immunofluorescence staining also confirmed that CQ administration resulted in M1 microglial polarization being favored over M2, as compared to LPS+CRCD, LPS+CRCD+CQ had increased CD16/32+, and decreased Arg-1+ fluorescence intensity (Figure 8H–J). These findings thus reinforced the idea that CRCD promoted M2 polarization via activating autophagic processes.
 |
Figure 8 Autophagy inhibitor chloroquine (CQ) reversed CRCD-induced M2 microglial polarization among LPS-stimulated BV2 cells. (A) Schematic of CQ treatment, prior to LPS and CRCD exposure, for BV2 cells. (B) Representative Western blot image and quantification of autophagy-related proteins (C) LC3 (II/I) and (D) p62 among Normal, LPS, LPS+CRCD, and LPS+CRCD+CQ groups. (E) Representative immunofluorescence images and quantification for (F) LC3 and (G) p62 puncta among the 4 groups. (H) Representative immunofluorescence images and quantification for (I) CD16/32+ M1 and (J) Arg-1+ M2 BV2 cells. n = 3/group for all experiments. *P < 0.05, **P < 0.01, ***P < 0.001. |
Discussion
Acute glaucoma is a subtype characterized by retinal ischemic injury and RGC loss secondary to IOP elevation. However, patients with medically controlled IOP may still have progressive visual field loss, due to continued RGC death. Consistent with findings from previous studies,7,40 we observed that RGCs were still continuously lost even after high IOP was alleviated, indicating that IOP-independent factors may be involved in their loss during glaucoma pathogenesis. As a result, effective treatments for retinal degeneration following pathological ocular hypertension are urgently needed, as current strategies have limited effectiveness. One potential therapy that has been investigated is RAPA, an autophagy inducer, which has been previously shown to offer some protection against IOP-induced retinal damage. However, its systemic toxicity, hydrophobic nature limiting its diffusion in the vitreous humor, as well as requiring pre-treatments, restricts its application for treating glaucoma.
The utilization of novel nanoparticles as a delivery system for localized RAPA delivery has been previously demonstrated to effectively mitigate skin, vascular inflammation, or promote regeneration, such as in bone tissue.54–56 For retinal applications, though, on top of considerations regarding the biodegradation of intraocular drug carriers, the optical properties of the eye impose significant constraints on nanocarrier size, along with the need to allow light transmission.33 As a result, CDs, being able to be conjugated to ligands or aptamers for specific applications, despite their relatively small sizes, have become a topic of increasing interest in ophthalmology over the past few years. Furthermore, owing to their excellent intraocular biocompatibility and optical properties, it has been used for intraocular gene delivery and monitoring drug concentrations.33,34,57 Therefore, in this study, to overcome the limitations of RAPA, as well as to take advantage of the beneficial properties of CDs, we synthesized CRCD, an intravitreally injectable, water-soluble, bio-compatible nanoparticle, comprising a CS-RAPA composite. CRCD, both in vitro and in vivo, possessed superior anti-oxidative and anti-inflammatory capabilities, owing to its ability, retained from RAPA, to induce autophagy among microglia, and subsequently favoring their polarization to the anti-inflammatory M2 state over pro-inflammatory M1. Therefore, it was demonstrated to be effective in treating I/R-induced retinal injury and preserving visual function.
Maintaining appropriate autophagy levels is fundamental for neuronal health, as it enables cells to adapt to stressful environments, such as clearing damaged and dysfunctional mitochondria to alleviate the pro-oxidative effects induced by ROS production.58,59 We found exhaustion of autophagy and reduced autophagosomal turnover, resulting in p62 accumulation, which was consistent with previous studies.27 On the other hand, intravitreal CRCD administration immediately after I/R induction demonstrated comparable capabilities to restore autophagy levels to that of pre-intraperitoneal RAPA injections for 6 consecutive days. Moreover, intravitreal delivery facilitates preferential CRCD uptake by cells in the inner retinal layer, which are more vulnerable to ROS.47 In recent years, novel nanomaterials targeting different mechanisms to counteract against glaucomatous RGC damage have emerged, such as biodegradable polymers utilizing ROS as a trigger to simultaneously activate ROS scavenging and facilitate drug release.14,60 Similar to that approach, our CRCD nanoparticle was able to scavenge ROS, as well as preserving the effects of RAPA to activate autophagy and inhibit inflammation, all of which contributed to the preservation of retinal structure and function.
ROS has also been found to act as signaling molecules to induce pro-inflammatory microglial activation.16–19 Indeed, the peak of retinal microglial proliferation was observed at 2 days post-I/R injury.61 Based on that observation, we conducted a comparative analysis of differences in mRNA-seq data between normal and I/R-injured retinas at 48 h post-injury, in which the biggest difference in mRNA expression levels, with respect to biological processes, was present for those associated with inflammatory response, and production of pro-inflammatory cytokines; in fact, it was greater than for oxidative stress. Other biological processes that were enriched among I/R-injured retinas include the regulation of microglial migration and cytotoxicity. Therefore, the activation state of microglia is a key aspect behind whether they would play a neuro-protective or destructive role during glaucomatous neurodegeneration.19 Combined with our previous study,40 we found pro-inflammatory M1 microglial activation and cytokine expression were the prevalent patterns among both aged and young mice, following high IOP-induced acute retinal injury, which was alleviated by using stem cell-derived exosomes to inhibit M1 polarization.40 Similarly, in this study, CRCD was able to promote microglial polarization towards the anti-inflammatory M2 type, resulting in better retinal protection compared to RAPA, which merely inhibited M1 polarization. As a matter of fact, promoting M2 polarization has been investigated as a possible therapeutic target for neurodegenerative diseases, such as Alzheimer’s disease and cerebral I/R injury.62,63 However, its potential for treating ophthalmic diseases, such as glaucoma, has remained largely unexplored, though this study confirms that the regulation of microglial activation is a viable therapeutic target for preserving retinal function. Therefore, an improved understanding of the underlying pathological processes related to secondary RGC degeneration could provide effective strategies for achieving glaucomatous neuroprotection.
The autophagy inducer RAPA was found to inhibit M1 microglial polarization, both in vitro and in vivo, in line with previous in vitro results.24,52 Furthermore, autophagy activation has been documented to play an important role in regulating M2 microglial polarization,25,26 likely owing to it being associated with transcriptomic changes and cytoplasmic remodeling during microglial differentiation.64 Therefore, autophagy-caused cell reprogramming may serve as the underlying basis behind M1-to-M2 microglial polarization, which was supported by our findings that blocking CRCD-induced autophagy with CQ resulted in the abolishment of M2 polarization over M1. Furthermore, distinct polarization states were linked to the differential regulation of autophagy by RAPA and CRCD. Therefore, future studies are needed to further elucidate the exact mechanisms and mediators connecting the autophagy process with microglial polarization.
With respect to ROS, we found that in I/R injury, elevated levels were not limited to the inner retinal layers, as they were also observed among cone and rod photoreceptor cells in the outer nuclear layer (ONL). Indeed, Li et al found that pathways associated with ROS responses were enriched among cone and rod cells, based on single-cell RNA sequencing of I/R-injured retinal cells.65 Furthermore, Zhou et al found that a progressive apoptosis of retinal neural cells, from the GCL, and progressing to the inner (INL), then to the ONL, at 3 days post-I/R, was present under TUNEL staining.66 In this study, this increase in ROS levels in the ONL was only observed at 1 day post-I/R, which may serve as the basis behind the subsequent apoptosis in that layer observed by Zhou et al. However, the present study primarily focuses on the protective effects of CRCD on RGC apoptosis within the GCL, as well as its relation to microglial activation and polarization into anti-inflammatory phenotypes. Future studies should continue to investigate CRCD effects on retinal function and I/R-induced retinal injury for other cell layers aside from GCL.
We also tried to explore alternative administration approaches for CRCD, particularly in the form of eyedrops (8 μg/μL diluted in PBS, 5 µL/eye, administered every 30 min, 3 doses in total), by performing a corneal permeability test in mice. UPLC analysis found that CRCD was present in corneal tissue, at a level of 353.81 ± 17.59 μg/g tissue, but not in the aqueous humor (unpublished observations), indicating that CRCD may have penetrated into the corneal tissue layers. However, it is still unknown the extent of the layers that CRCD has penetrated to. Future studies will thus focus on developing a penetrable, eyedrop-administrated version of CRCD to facilitate non-invasive clinical treatments.
Conclusion
In summary, we successfully synthesized a CD nanoparticle, CRCD, by combining CS and RAPA. This CD had good water solubility, bio-compatibility, and superior anti-oxidative capabilities compared to RAPA. In vitro, CRCD lowered oxidative stress among HUVECs and R28, and maintained proper autophagy activities among BV2 cells. More specifically, among LPS-stimulated BV2 cells, CRCD not only suppressed pro-inflammatory microglia M1 polarization but also promoted anti-inflammatory microglia M2 polarization, via activating autophagy. This was also supported in vivo, where intravitreal injection of CRCD into I/R mice mitigated oxidative stress-induced retinal injury and inflammation, by facilitating M1-to-M2 polarization, along with down-regulating pro-inflammatory, and up-regulating anti-inflammatory cytokines, to ameliorate retinal damage and improve visual functional recovery. Overall, this study thus suggests that CDs could serve as a new strategy for protecting the optic nerve in acute glaucoma, as well as a potential treatment for other I/R-related diseases.
Acknowledgments
We thank Prof. Zhengbo Shao for her valuable suggestions on this manuscript, Drs. Weijie Wang and Fengyi Guo for their timely assistance in data acquisition, Ms. Alina Yao for her assistance with manuscript preparation and editing, as well as Mr. Jia for his support in schematic diagram drawing and UPLC data analysis.
Funding
This work was supported by grants from the National Natural Science Foundation of China (82070956, 52061135204, 51972086, 81970799, and 82000889), the Applied Technology Research and Development Program of Heilongjiang Provincial Science and Technology Department (GA20C008), Interdisciplinary Research Foundation of HIT (IR2021105), State Key Laboratory of Urban Water Resource and Environment of Harbin Institute of Technology (2022TS21), Ministry of Science and Higher Education of the Russian Federation (075-15-2022-1114), China Postdoctoral Science Foundation (2021M701022), Heilongjiang Postdoctoral Fund (LBH-Z21184), and Heilongjiang Provincial Key R&D project (No. 2022ZX02C24).
Disclosure
The authors report no conflicts of interest in this work.
References
1. Jonas JB, Aung T, Bourne RR, et al. Glaucoma. Lancet. 2017;390(10108):2183–2193. doi:10.1016/S0140-6736(17)31469-1
2. Tham Y, Li X, Wong TY, et al. Global prevalence of glaucoma and projections of glaucoma burden through 2040: a systematic review and meta-analysis. Ophthalmology. 2014;121(11):2081–2090. doi:10.1016/j.ophtha.2014.05.013
3. Goldberg I. Relationship between intraocular pressure and preservation of visual field in glaucoma. Surv Ophthalmol. 2003;48(Suppl 1):S3–S7. doi:10.1016/S0039-6257(03)00006-7
4. Weinreb RN, Aung T, Medeiros FA. The pathophysiology and treatment of glaucoma: a review. JAMA. 2014;311(18):1901–1911. doi:10.1001/jama.2014.3192
5. Russo R, Varano GP, Adornetto A, et al. Retinal ganglion cell death in glaucoma: exploring the role of neuroinflammation. Eur J Pharmacol. 2016;787:134–142. doi:10.1016/j.ejphar.2016.03.064
6. Liu X, Hou M, Zhang S, et al. Neuroprotective effects of bone marrow Sca-1+ cells against age-related retinal degeneration in OPTN E50K mice. Cell Death Dis. 2021;12(6):613. doi:10.1038/s41419-021-03851-0
7. Shao Z, Wu J, Du G, et al. Young bone marrow Sca-1 cells protect aged retina from ischaemia-reperfusion injury through activation of FGF2. J Cell Mol Med. 2018;22(12):6176–6189. doi:10.1111/jcmm.13905
8. Wang Y, Xu K, Zhang H, et al. Retinal ganglion cell death is triggered by paraptosis via reactive oxygen species production: a brief literature review presenting a novel hypothesis in glaucoma pathology. Mol Med Rep. 2014;10(3):1179–1183. doi:10.3892/mmr.2014.2346
9. Naguib S, Backstrom JR, Gil M, Calkins DJ, Rex TS. Retinal oxidative stress activates the NRF2/ARE pathway: an early endogenous protective response to ocular hypertension. Redox Biol. 2021;42:101883. doi:10.1016/j.redox.2021.101883
10. Amankwa CE, Gondi SR, Dibas A, et al. Novel thiol containing hybrid antioxidant-nitric oxide donor small molecules for treatment of glaucoma. Antioxidants. 2021;10(4):575. doi:10.3390/antiox10040575
11. Zhao L, Ling L, Lu J, et al. Reactive oxygen species-responsive mitochondria-targeted liposomal quercetin attenuates retinal ischemia-reperfusion injury via regulating SIRT1/FOXO3A and p38 MAPK signaling pathways. Bioeng Transl Med. 2023;8(3):e10460. doi:10.1002/btm2.10460
12. Liao J, Peng B, Huang G, et al. Inhibition of NOX4 with GLX351322 alleviates acute ocular hypertension-induced retinal inflammation and injury by suppressing ROS mediated redox-sensitive factors activation. Biomed Pharmacother. 2023;165:115052. doi:10.1016/j.biopha.2023.115052
13. Guo X, Zhang J, Liu X, et al. Antioxidant nanoemulsion loaded with latanoprost enables highly effective glaucoma treatment. J Control Release. 2023;361:534–546. doi:10.1016/j.jconrel.2023.08.004
14. Rong R, Zhou X, Liang G, et al. Targeting cell membranes, depleting ROS by dithiane and thioketal-containing polymers with pendant cholesterols delivering Necrostatin-1 for glaucoma treatment. ACS Nano. 2022;16(12):21225–21239. doi:10.1021/acsnano.2c09202
15. Lou X, Hu Y, Zhang H, Liu J, Zhao Y. Polydopamine nanoparticles attenuate retina ganglion cell degeneration and restore visual function after optic nerve injury. J Nanobiotechnology. 2021;19(1). doi:10.1186/s12951-021-01199-3
16. Fan H, Bai Q, Yang Y, et al. The key roles of reactive oxygen species in microglial inflammatory activation: regulation by endogenous antioxidant system and exogenous sulfur-containing compounds. Eur J Pharmacol. 2023;956:175966. doi:10.1016/j.ejphar.2023.175966
17. Tezel G. Molecular regulation of neuroinflammation in glaucoma: current knowledge and the ongoing search for new treatment targets. Prog Retin Eye Res. 2022;87:100998. doi:10.1016/j.preteyeres.2021.100998
18. Long Y, Li X, Deng J, et al. Modulating the polarization phenotype of microglia – a valuable strategy for central nervous system diseases. Ageing Res Rev. 2024;93:102160. doi:10.1016/j.arr.2023.102160
19. Miao Y, Zhao G, Cheng S, Wang Z, Yang X. Activation of retinal glial cells contributes to the degeneration of ganglion cells in experimental glaucoma. Prog Retin Eye Res. 2023;93:101169. doi:10.1016/j.preteyeres.2023.101169
20. Zhou T, Huang Z, Sun X, et al. Microglia polarization with M1/M2 phenotype changes in rd1 mouse model of retinal degeneration. Front Neuroanat. 2017;11:77. doi:10.3389/fnana.2017.00077
21. He Y, Gao Y, Zhang Q, et al. IL-4 switches microglia/macrophage M1/M2 polarization and alleviates neurological damage by modulating the JAK1/STAT6 pathway following ICH. Neuroscience. 2020;437:161–171. doi:10.1016/j.neuroscience.2020.03.008
22. Yang X, Xu S, Qian Y, et al. Resveratrol regulates microglia M1/M2 polarization via PGC-1α in conditions of neuroinflammatory injury. Brain Behav Immun. 2017;64:162–172. doi:10.1016/j.bbi.2017.03.003
23. Ji J, Xue T, Guo X, et al. Antagonizing peroxisome proliferator-activated receptor γ facilitates M1-to-M2 shift of microglia by enhancing autophagy via the LKB1-AMPK signaling pathway. Aging Cell. 2018;17(4):e12774. doi:10.1111/acel.12774
24. Ye X, Zhu M, Che X, et al. Lipopolysaccharide induces neuroinflammation in microglia by activating the MTOR pathway and downregulating Vps34 to inhibit autophagosome formation. J Neuroinflammation. 2020;17(1):18. doi:10.1186/s12974-019-1644-8
25. Tang RH, Qi RQ, Liu HY. Interleukin-4 affects microglial autophagic flux. Neural Regen Res. 2019;14(9):1594–1602. doi:10.4103/1673-5374.255975
26. Wang C, Wang Q, Lou Y, et al. Salidroside attenuates neuroinflammation and improves functional recovery after spinal cord injury through microglia polarization regulation. J Cell Mol Med. 2017;22:1148–1166
27. Russo R, Varano GP, Adornetto A, et al. Rapamycin and fasting sustain autophagy response activated by ischemia/reperfusion injury and promote retinal ganglion cell survival. Cell Death Dis. 2018;9(10). doi:10.1038/s41419-018-1044-5
28. Tang LHC, Fung FKC, Lai AKW, et al. Autophagic upregulation is cytoprotective in ischemia/reperfusion-injured retina and retinal progenitor cells. Int J Mol Sci. 2021;22(16):8446. doi:10.3390/ijms22168446
29. Piras A, Gianetto D, Conte D, Bosone A, Vercelli A. Activation of autophagy in a rat model of retinal ischemia following high intraocular pressure. PLoS One. 2011;6(7):e22514. doi:10.1371/journal.pone.0022514
30. Wang Y, Huang C, Zhang H, Wu R. Autophagy in glaucoma: crosstalk with apoptosis and its implications. Brain Res Bull. 2015;117:1–9. doi:10.1016/j.brainresbull.2015.06.001
31. Simamora P, Alvarez JM, Yalkowsky SH. Solubilization of rapamycin. Int J Pharm. 2001;213(1–2):25–29. doi:10.1016/S0378-5173(00)00617-7
32. Kitaoka Y, Munemasa Y, Kojima K, et al. Axonal protection by Nmnat3 overexpression with involvement of autophagy in optic nerve degeneration. Cell Death Dis. 2013;4(10):e860. doi:10.1038/cddis.2013.391
33. Lyu Q, Peng L, Hong X, et al. Smart nano-micro platforms for ophthalmological applications: the state-of-the-art and future perspectives. Biomaterials. 2021;270:120682. doi:10.1016/j.biomaterials.2021.120682
34. Biswal MR, Bhatia S. Carbon dot nanoparticles: exploring the potential use for gene delivery in ophthalmic diseases. Nanomaterials. 2021;11(4):935. doi:10.3390/nano11040935
35. Mattinzoli D, Cacioppo M, Ikehata M, et al. Carbon dots conjugated to SN38 for improved colorectal anticancer therapy. Mater Today Bio. 2022;16:100286. doi:10.1016/j.mtbio.2022.100286
36. Zheng D, Li B, Li C, et al. Carbon-dot-decorated carbon nitride nanoparticles for enhanced photodynamic therapy against hypoxic tumor via water splitting. ACS Nano. 2016;10(9):8715–8722. doi:10.1021/acsnano.6b04156
37. Wang L, Li B, Li L, et al. Ultrahigh-yield synthesis of N-doped carbon nanodots that down-regulate ROS in zebrafish. J Mater Chem B. 2017;5(38):7848–7860. doi:10.1039/C7TB01114H
38. Hartsock MJ, Cho H, Wu L, et al. A mouse model of retinal ischemia-reperfusion injury through elevation of intraocular pressure. J Visualized Exp. 2016; 113. doi:10.3791/54065
39. Wang G, Hao M, Liu Q, et al. Protective effect of recombinant lactobacillus plantarum against H(2)O(2)-induced oxidative stress in HUVEC cells. J Zhejiang Univ Sci B. 2021;22(5):348–365. doi:10.1631/jzus.B2000441
40. Wang Y, Qin W, Wang Q, et al. Young Sca-1+ bone marrow stem cell-derived exosomes preserve visual function via the miR-150-5p/MEKK3/JNK/c-Jun pathway to reduce M1 microglial polarization. J Nanobiotechnology. 2023;21(1):1–8.
41. Lei D, Shao Z, Zhou X, Yuan H. Synergistic neuroprotective effect of rasagiline and idebenone against retinal ischemia-reperfusion injury via the Lin28-let-7-Dicer pathway. Oncotarget. 2018;9(15):12137–12153. doi:10.18632/oncotarget.24343
42. Hou M, Shao Z, Zhang S, et al. Age-related visual impairments and retinal ganglion cells axonal degeneration in a mouse model harboring OPTN (E50K) mutation. Cell Death Dis. 2022;13(4):362. doi:10.1038/s41419-022-04836-3
43. Barrett T, Wilhite SE, Ledoux P, et al. NCBI GEO: archive for functional genomics data sets--update. Nucleic Acids Res. 2013;41(Database issue):D991–D995. doi:10.1093/nar/gks1193
44. Sherman BT, Hao M, Qiu J, et al. DAVID: a web server for functional enrichment analysis and functional annotation of gene lists (2021 update). Nucleic Acids Res. 2022;50(W1):W216–W221. doi:10.1093/nar/gkac194
45. Le Guyader G, Vieillard V, Andrieux K, et al. Long-term stability of 0.1% rapamycin hydrophilic gel in the treatment of facial angiofibromas. Eur J Hosp Pharm. 2020;27(e1):e48–e52. doi:10.1136/ejhpharm-2018-001695
46. Dong ZM, Wollstein G, Wang B, Schuman JS. Adaptive optics optical coherence tomography in glaucoma. Prog Retin Eye Res. 2017;57:76–88. doi:10.1016/j.preteyeres.2016.11.001
47. Tezel G. Oxidative stress in glaucomatous neurodegeneration: mechanisms and consequences. Prog Retin Eye Res. 2006;25(5):490–513. doi:10.1016/j.preteyeres.2006.07.003
48. Tezel G, Yang X, Cai J. Proteomic identification of oxidatively modified retinal proteins in a chronic pressure-induced rat model of glaucoma. Invest Ophthalmol Vis Sci. 2005;46(9):3177. doi:10.1167/iovs.05-0208
49. Xie W, Xu P, Liu Q. Antioxidant activity of water-soluble chitosan derivatives. Bioorg Med Chem Lett. 2001;11(13):1699–1701. doi:10.1016/S0960-894X(01)00285-2
50. Chen R, Liu G, Sun X, et al. Chitosan derived nitrogen-doped carbon dots suppress osteoclastic osteolysis via downregulating ROS. Nanoscale. 2020;12(30):16229–16244. doi:10.1039/D0NR02848G
51. Rodríguez-Muela N, Germain F, Mariño G, Fitze PS, Boya P. Autophagy promotes survival of retinal ganglion cells after optic nerve axotomy in mice. Cell Death Differ. 2012;19(1):162–169. doi:10.1038/cdd.2011.88
52. Han H, Kim T, Son H, Park WJ, Han P. Activation of autophagy pathway suppresses the expression of iNOS, IL6 and cell death of LPS-Stimulated microglia cells. Biomol Ther. 2013;21(1):21–28. doi:10.4062/biomolther.2012.089
53. Klionsky DJ, Abdel-Aziz AK, Abdelfatah S, et al. Guidelines for the use and interpretation of assays for monitoring autophagy (4th edition)(1). Autophagy. 2021;17(1):1–382.
54. Boada C, Zinger A, Tsao C, et al. Rapamycin-Loaded biomimetic nanoparticles reverse vascular inflammation. Circ Res. 2020;126(1):25–37. doi:10.1161/CIRCRESAHA.119.315185
55. Rancan F, Guo X, Rajes K, et al. Topical delivery of rapamycin by means of microenvironment-sensitive core-multi-shell nanocarriers: assessment of anti-inflammatory Activity in an ex vivo Skin/T Cell Co-Culture Model. Int J Nanomed. 2021;16:7137–7151. doi:10.2147/IJN.S330716
56. Zhang Q, Xin M, Yang S, et al. Silica nanocarrier-mediated intracellular delivery of rapamycin promotes autophagy-mediated M2 macrophage polarization to regulate bone regeneration. Mater Today Bio. 2023;20:100623. doi:10.1016/j.mtbio.2023.100623
57. Shoval A, Markus A, Zhou Z, et al. Anti‐VEGF‐Aptamer modified C‐Dots—A hybrid nanocomposite for topical treatment of ocular vascular disorders. Small. 2019;15(40):1902776. doi:10.1002/smll.201902776
58. Jin M, Wang F, Qi D, et al. A critical role of autophagy in regulating microglia polarization in neurodegeneration. Front Aging Neurosci. 2018;10:378. doi:10.3389/fnagi.2018.00378
59. Marino G, Madeo F, Kroemer G. Autophagy for tissue homeostasis and neuroprotection. Curr Opin Cell Biol. 2011;23(2):198–206. doi:10.1016/j.ceb.2010.10.001
60. Zhou X, Rong R, Liang G, et al. Simultaneously deplete reactive oxygen species and inhibit pyroptosis by dopamine/thioketal-containing polymers delivering disulfiram in combination with Cu(II) for acute glaucoma. Nano Today. 2022;47:101668. doi:10.1016/j.nantod.2022.101668
61. Tang Y, Xiao Z, Pan L, et al. Therapeutic targeting of retinal immune microenvironment with CSF-1 receptor antibody promotes visual function recovery after ischemic optic neuropathy. Front Immunol. 2020;11:585918. doi:10.3389/fimmu.2020.585918
62. Yang F, Zhao D, Cheng M, et al. mTOR-Mediated immunometabolic reprogramming nanomodulators enable sensitive switching of energy deprivation-induced microglial polarization for Alzheimer’s disease management. ACS Nano. 2023;17(16):15724–15741. doi:10.1021/acsnano.3c03232
63. Xu X, Gao W, Li L, et al. Annexin A1 protects against cerebral ischemia-reperfusion injury by modulating microglia/macrophage polarization via FPR2/ALX-dependent AMPK-mTOR pathway. J Neuroinflammation. 2021;18(1):119. doi:10.1186/s12974-021-02174-3
64. Zubova SG, Suvorova II, Karpenko MN. Macrophage and microglia polarization: focus on autophagy-dependent reprogramming. Front Biosci Scholar. 2022;14(1):1. doi:10.31083/j.fbs1401003
65. Li Y, Wen Y, Liu X, et al. Single-cell RNA sequencing reveals a landscape and targeted treatment of ferroptosis in retinal ischemia/reperfusion injury. J Neuroinflammation. 2022;19(1). doi:10.1186/s12974-022-02621-9
66. Zhou L, Chen W, Lin D, Hu W, Tang Z. Neuronal apoptosis, axon damage and synapse loss occur synchronously in acute ocular hypertension. Exp Eye Res. 2019;180:77–85. doi:10.1016/j.exer.2018.12.006
 © 2024 The Author(s). This work is published and licensed by Dove Medical Press Limited. The
full terms of this license are available at https://www.dovepress.com/terms
and incorporate the Creative Commons Attribution
- Non Commercial (unported, 3.0) License.
By accessing the work you hereby accept the Terms. Non-commercial uses of the work are permitted
without any further permission from Dove Medical Press Limited, provided the work is properly
attributed. For permission for commercial use of this work, please see paragraphs 4.2 and 5 of our Terms.
© 2024 The Author(s). This work is published and licensed by Dove Medical Press Limited. The
full terms of this license are available at https://www.dovepress.com/terms
and incorporate the Creative Commons Attribution
- Non Commercial (unported, 3.0) License.
By accessing the work you hereby accept the Terms. Non-commercial uses of the work are permitted
without any further permission from Dove Medical Press Limited, provided the work is properly
attributed. For permission for commercial use of this work, please see paragraphs 4.2 and 5 of our Terms.