Back to Journals » International Journal of Chronic Obstructive Pulmonary Disease » Volume 16
Chest Dynamic-Ventilatory Digital Radiography in Chronic Obstructive or Restrictive Lung Disease
Authors Ohkura N ![]() , Tanaka R, Watanabe S, Hara J
, Tanaka R, Watanabe S, Hara J ![]() , Abo M, Nakade Y, Horii J, Matsuura Y, Inoue D, Takata M, Tamura M, Matsumoto I, Sanada S, Kasahara K
, Abo M, Nakade Y, Horii J, Matsuura Y, Inoue D, Takata M, Tamura M, Matsumoto I, Sanada S, Kasahara K
Received 8 March 2021
Accepted for publication 4 May 2021
Published 18 May 2021 Volume 2021:16 Pages 1393—1399
DOI https://doi.org/10.2147/COPD.S309960
Checked for plagiarism Yes
Review by Single anonymous peer review
Peer reviewer comments 2
Editor who approved publication: Prof. Dr. Richard Russell
Noriyuki Ohkura,1 Rie Tanaka,2 Satoshi Watanabe,1 Johsuke Hara,1 Miki Abo,1 Yusuke Nakade,3 Junsei Horii,4 Yukihiro Matsuura,4 Dai Inoue,5 Munehisa Takata,6 Masaya Tamura,6 Isao Matsumoto,6 Shigeru Sanada,7 Kazuo Kasahara1
1Kanazawa University Hospital, Respiratory Medicine, Ishikawa, Japan; 2Kanazawa University, College of Medical, Pharmaceutical & Health Sciences, Ishikawa, Japan; 3Kanazawa University Hospital, Clinical Laboratory, Ishikawa, Japan; 4Kanazawa University Hospital, Department of Radiology, Ishikawa, Japan; 5Kanazawa University Hospital, Radiology, Ishikawa, Japan; 6Kanazawa University, Thoracic, Cardiovascular and General Surgery, Ishikawa, Japan; 7Komatsu University, Faculty of Health Sciences, Ishikawa, Japan
Correspondence: Noriyuki Ohkura Email [email protected]
Objective: The aim of this study was to identify the relationships between parameters obtained from dynamic-ventilatory digital radiography (DR) and ventilatory disorders.
Methods: This study comprised 273 participants with respiratory diseases who underwent spirometry and functional residual capacity measurements (104 with normal findings on spirometry as controls, 139 with an obstructive lung disorder, 30 with a restrictive lung disorder) were assessed by dynamic-ventilatory DR. Sequential chest radiography images of the patient’s slow and maximum breathing were captured at 15 frames per second by a dynamic flat-panel imaging system. The system measured the following parameters: lung area at maximum inspiration divided by height (lung area_in/height), changes in tracheal diameter due to respiratory motions, rate of tracheal narrowing, diaphragmatic motion, and rate of change in lung area due to respiratory motion. Relationships between these parameters and ventilatory disorders were analyzed.
Results: Lung area_in/height in patients with restrictive disorders showed significant decreases. Tracheal diameter change and tracheal narrowing rate in patients with obstructive disorders were significantly increased compared to both the control participants and patients with restrictive disorders. Patients with obstructive disorders and patients with restrictive disorders showed decreased diaphragmatic motion and lung area change rate. With the restrictive disorders as references, the area under the curve (AUC), sensitivity and specificity of lung area_in/height were 0.88, 0.77, and 0.88, respectively. With the obstructive disorders as references, the AUC, sensitivity and specificity of tracheal narrowing rate were 0.67, 0.53 and 0.81, respectively.
Conclusion: Dynamic-ventilatory DR shows potential as a method for the detection and evaluation of ventilatory disorders in patients with respiratory diseases.
Keywords: dynamic digital radiography, pulmonary function tests, spirometry, COPD, interstitial lung disease
Introduction
Spirometry is a widely used noninvasive test for diagnosing and assessing patients with respiratory diseases such as chronic obstructive pulmonary disease (COPD) and interstitial lung disease (ILD). FEV1 is one of the prognostic factors in patients with COPD.1 FVC is also a prognostic factor in patients with chronic ILD.2 However, the performance of spirometry has difficulties.3 Since spirometry requires forced expirations, its accuracy depends on the abilities of both the operator and patient. Also, spirometry cannot be performed when a patient’s condition is unstable.
Recent studies have reported the utility of dynamic digital radiography (DR) performed by a flat panel detector (FDP) device.4 Dynamic-ventilatory DR uses lower doses of radiation than conventional X-ray fluoroscopy and CT to provide sequential chest radiography images during respiration.5 These images reflect respiratory kinetic parameters, and may be effective for evaluating the pulmonary function of patients with lung disease.6 Patients with severe COPD have slower and decreased amplitude diaphragmatic motions during forced breathing.7 A preliminary study has shown that intrathoracic tracheal diameter during deep breathing as evaluated by dynamic-ventilatory DR was narrowed in patients with airflow limitations.8 We also have shown that the rate of change in the area of the lung in a slowly breathing patient from maximum inspiration to maximum expiration was associated with residual volume/total lung capacity (TLC) and predicted FEV1 in patients with airflow limitations.9 In that study, the lung area of a patient at maximum inspiration was strongly correlated with vital capacity (VC), functional residual capacity (FRC), and TLC. However, little is known about the role of dynamic-ventilatory DR in the classification of ventilatory disorders including COPD and ILD. The aim of this study was to identify the relationships between parameters obtained by dynamic-ventilatory DR and ventilatory disorders. We also verified the accuracy of the parameters for the classification of ventilatory disorders.
Methods
Participants
Between December 2015 and October 2019, 314 patients with respiratory disease were enrolled in this study and underwent dynamic-ventilatory DR and pulmonary function testing (spirometry and FRC measurements) at our institution. Although all of the patients were successfully assessed by dynamic-ventilatory DR, 41 were excluded from the study because neither spirometry nor FRC measurements were obtained. The 273 included participants consisted of 158 patients with lung cancer before surgery, 47 patients with ILD, 45 with COPD, 7 with asthma, 6 with asthma-COPD overlap syndrome, 4 with mediastinal tumor, 3 with mesothelioma, 1 with pulmonary thromboembolism, 1 with aspergillosis, and 1 with obstructive sleep apnea. All of the examinations in this study were performed when the patients were stable The characteristics of the participants based on ventilatory disorder are shown in Table 1. An obstructive disorder was defined as FEV1/FVC < 0.7. The severities of airflow limitation (AL) were defined as follows: mild AL, FEV1 ≥ 80% predicted; moderate AL, 50% ≤ FEV1 < 80% predicted; and severe AL, FEV1 < 50% predicted. A restrictive disorder was defined as FVC < 80% predicted. The severities of restrictive disease (RD) were defined as follows: moderate RD, 65% ≤ FVC < 80% predicted; severe RD, FVC < 65% predicted. Participants with both FVC ≥ 80% predicted and FEV1/FVC ≥ 0.7 were also included in the control group.
 |
Table 1 Characteristics of Participants Based on Ventilatory Disorders |
Dynamic-Ventilatory Digital Radiography
Dynamic-ventilatory DR was performed as previously reported.9 Sequential chest radiography images were obtained during respiration by a dynamic FPD imaging device (Test Model; Konica Minolta, Inc., Tokyo, Japan) with an indirect-conversion FPD (PaxScan, 4343CB, Varex Imaging Corporation, Salt Lake City, UT, USA) and X-ray generator/tube capable of pulsed radiation (DHF-155H II/UH-6QC-07E, Hitachi, Ltd.). To be a reliable diagnostic tool, the device must produce very homogeneous and uniform X-ray pulses. The participants were instructed to breathe deeply in the standing position under an automated voice guidance. Each patient slowly inhaled and exhaled, which was followed by a maximal inhalation and exhalation, each for 5s. Breath holding lasted for 2s at each maximum inspiration point and maximum expiration point. Sequential chest X-ray images were captured at 15 frames per second with the dynamic DR system. The total radiation exposure was adjusted by changing the imaging times, imaging rates, and source-to-image distances (SIDs), and was less than the dose limit (1.9 mGy) for 2 views (PA+LA), as recommended by the International Atomic Energy Agency (IAEA). In this study the exposures were obtained by using the following parameters: 100 kV; 50 mA; 2.5 ms; 15 frames per second; and 2.0 m from the SID, resulting in effective patient doses of approximately 0.2 mSv in 14 s.
Pulmonary Function Tests
Spirometry testing was performed by a computerized spirometer (Chestac-9900; Chest, Tokyo, Japan) according to the ATS/ERS Task Force guidelines.3 FRC was measured by the helium dilution method. TLC was calculated by adding the value of inspiratory capacity and FRC.
Measurement of Parameters Obtained by Dynamic-Ventilatory DR
The lung areas at the points of maximum inspiration (lung area_in) and maximum expiration (lung area_ex) were measured as previously described.9 Changes in the ratios of lung areas based on points in the respiratory cycle (maximum inspiration to maximum expiration) were calculated as follows: lung area change rate = (lung area_ex – lung area_in)/lung area_in. Changes in the tracheal diameter based on points in the respiratory cycle were measured as previously described.8 The rate of tracheal narrowing due to respiratory motion was calculated as follows: The rate of tracheal narrowing = 100 × (maximal tracheal diameter at the start of expiration – minimal tracheal diameter at maximal expiration)/maximum tracheal diameter at the start of expiration. Diaphragmatic motion was measured as previously described.7 The measurements were manually performed by one of the authors (NO), who used the dynamic FPD imaging system (Test Model; Konica Minolta, Inc., Tokyo, Japan). Representative examples of measurements are shown in Supplemental Figure 1.
The relationships between the ventilatory disorders and parameters obtained by dynamic-ventilatory DR such as lung area_in/height, tracheal diameter change, tracheal narrowing rate, diaphragmatic motion, and lung area change rate were analyzed. Receiver operating characteristics (ROC) curves were constructed to evaluate the parameters as predictors of restrictive and obstructive disorders and the severity of ventilatory disorders. The areas under the curves (AUCs) for lung area_in/height, tracheal diameter change, tracheal narrowing rate, diaphragmatic motion, and lung area change rate were calculated to determine the most useful cut-off value, as well as the sensitivity and specificity of each parameter.
This study was approved by the Medical Ethics Committee of Kanazawa University Hospital (registration number 1729) and conducted in accordance with the Declaration of Helsinki. All patients were informed about the study and signed a consent form to participate.
Statistical Analysis
Data excluding smoking history, lung area_in/height, tracheal diameter change, tracheal narrowing rate, diaphragmatic motion, and lung area change rate are presented as means ± standard deviation. Smoking histories are shown as medians (range). Lung area_in/height, tracheal diameter change, tracheal narrowing rate, diaphragmatic motion, and lung area change rate are presented as medians with 95% CI. Statistical differences between groups were analyzed by the Mann–Whitney U-test or Kruskal–Wallis test. P values <0.05 were considered statistically significant.
Results
Lung area_in/height in patients with moderate RD and severe RD was significantly lower compared to the control group. Lung area_in/height in patients with severe AL was significantly higher compared to the control group (Mann–Whitney U-test, Kruskal–Wallis test, p < 0.05, Figure 1A). Tracheal diameter change and tracheal narrowing rate in all patients with obstructive disorders (mild to severe AL) were significantly higher compared to the control group (Mann–Whitney U-test, Kruskal–Wallis test, p < 0.05, Figure 1B). The differences in tracheal diameter change and tracheal narrowing rate between the control group and all patients with restrictive disorders (moderate RD, severe RD) were not significant. Bilateral diaphragmatic motions in patients with severe AL and all patients with restrictive disorders were significantly lower compared to the control group (Mann–Whitney U-test, Kruskal–Wallis test, p < 0.05, Figure 1C). Lung area change rate in patients with severe AL and severe RD were significantly higher compared with the control group (Mann–Whitney U-test, Kruskal–Wallis test, p < 0.05, Figure 1D).
 |
Figure 1 Obstructive disorder is defined as FEV1/FVC < 0.7. The degrees of severity of airflow limitation (AL) are defined as follows: mild airflow limitation, FEV1 ≥ 80% predicted; moderate airflow limitation, 50% ≤ FEV1 < 80% predicted; and severe airflow limitation, FEV1 < 50% predicted. The restrictive pattern is defined as FVC < 80% predicted. The severity of restrictive disease (RD) is defined as follows: moderate restrictive disease, 65% ≤ FVC < 80% predicted; severe restrictive disease, FVC < 65% predicted. Participants with both FVC ≥ 80% predicted and FEV1/FVC ≥ 0.7 were included in the control group. (A) Distribution of lung area_in/height in each type of ventilatory disorder. (B) Distribution of tracheal diameter change in each type of ventilatory disorder. Distribution of tracheal narrowing rate in each type of ventilatory disorder. (C) Distribution of diaphragmatic motion in each type of ventilatory disorder. (D) Distribution of lung area change rate in each type of ventilatory disorder. Lung area change rate represents the rate of change in the lung area due to respiratory motions. Lung area change rate: (lung area_ex – lung area_in)/lung area_in. Lung area_in: lung area at the time of maximal inspiration. Lung area_ex: lung area at the time of maximal expiration. *P < 0.05 compared to control by Mann–Whitney U-test. |
With patients with restrictive disorders as the reference, the AUC and cut-off value for lung area_in/height were 0.88 (95% CI 0.81–0.95) and 203.8×10⁻² m2/m, respectively. When the value of lung area_in/height was less than 203.8×10⁻² m2/m, the sensitivity, specificity, positive predictive value (PPV), negative predictive value (NPV), accuracy, likelihood ratio of a positive test (LR+), and likelihood ratio of a negative test (LR-) were 0.77 (95% CI 0.58–0.90), 0.88 (95% CI 0.83–0.92), 0.44 (95% CI 0.30–0.59), 0.97 (95% CI 0.94–0.99), 0.87 (95% CI 0.82–0.91), 6.42 (95% CI 4.33–9.53) and 0.27 (95% CI 0.14–0.51), respectively.
With patients with obstructive disorders as a reference, the AUC and cut off value of tracheal narrowing rate were 0.67 (95% CI 0.60–0.73) and 24.8%, respectively. When the tracheal narrowing rate was 24.8% or greater, the sensitivity, specificity, PPV, NPV, accuracy, LR+, and LR- were 0.53 (95% CI 0.44–0.61), 0.81 (95% CI 0.74–0.64), 0.74 (95% CI 0.64–0.82), 0.62 (95% CI 0.54–0.69), 0.66 (95% CI 0.60–0.72), 2.71 (95% CI 1.85–3.96) and 0.59 (95% CI 0.49–0.72), respectively.
With patients with obstructive disorders as a reference, the AUC and cut off value of tracheal diameter change were 0.63 (95% CI 0.56–0.69) and 5.14 mm respectively. With patients with ventilatory disorders that were moderately or more severe, including those with moderate AL, severe AL, moderate RD, or severe RD as references, the AUCs of the right diaphragmatic motion, left diaphragmatic motion, and lung area change rate were 0.67 (95% CI 0.60–0.75), 0.70 (95% CI 0.63–0.78) and 0.68 (95% CI 0.60–0.76), respectively. The cut off values of the right diaphragmatic motion, left diaphragmatic motion, and lung area change rate were 39.6 mm, 38.4 mm and −0.23, respectively (Table 2).
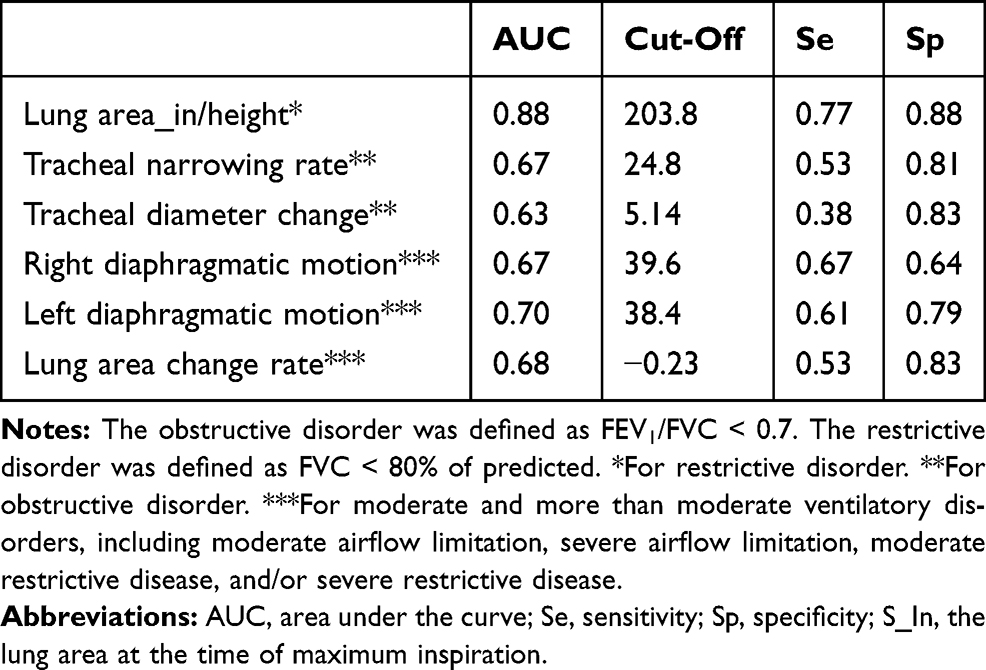 |
Table 2 AUC, Cut-Off Value, Sensitivity, Specificity for Ventilatory Disorder |
The relationships between the parameters from dynamic ventilatory DR and pulmonary function testing for all participants are shown in the Supplemental Table 1.
Discussion
In this study we validated the relationships between ventilatory disorders and parameters obtained from dynamic DR such as lung area_in/height, tracheal diameter change, tracheal narrowing rate, diaphragmatic motion, and lung area change rate. As previously reported,9 lung area_in/height, which is a good measure of lung volumes, was significantly lower in patients with restrictive disorders compared to the controls. Lung area_in/height, which reflects pulmonary hyperinflation, was also significantly higher in patients with severe AL compared to the controls. Lung area_in/height showed high values for AUC, specificity, and NPV for detecting restrictive disorders. Tracheal diameter change and tracheal narrowing rate were significantly higher in patients with any obstructive disorder (mild to severe AL) compared to the controls. However, tracheal diameter change and tracheal narrowing rate in patients with restrictive disorders were not significantly increased compared to the controls. This result is consistent with the data reported by Watase et al.8 Since increases in tracheal diameter change and tracheal narrowing rate depend on the severity of AL, these parameters seem to reflect airway narrowing due to hyper-inflated lungs in the expiratory phase.
To the best of our knowledge, this study has shown for the first time that tracheal diameter change and tracheal narrowing rate in patients with restrictive disease did not increase, as opposed to their values in patients with obstructive disorders. These results indicate that tracheal diameter change and tracheal narrowing rate may be useful for differentiating between obstructive and restrictive disorders. Although the AUC values of tracheal diameter change and tracheal narrowing rate for detecting obstructive ventilatory disorder were not extremely high, among the parameters in this study, only these parameters detected obstructive patterns. Additional accurate parameters or breathing maneuvers are needed for detecting obstructive ventilatory disorders.
Diaphragmatic motion, and lung area change rate show that the diaphragm and thorax become less active in patients with either restrictive or obstructive disorders as the conditions progress. These parameters reflected the severity of airflow limitation, as previously reported.7,9 Additional research is needed to develop an algorithm that uses a combination of these parameters from dynamic ventilatory DR for the classification and severity of ventilatory abnormalities. A proposed diagnostic algorithm based on the results of this study is shown in Supplemental Figure 2.
The evaluation of pulmonary function by dynamic DR has some advantages compared with other modalities. Specifically, dynamic DR can be performed with a patient in a standing or sitting position, which reflects physiologically relevant daily activity. Dynamic DR can be conducted as a supplemental examination to conventional chest radiography. The radiation dose of dynamic DR is lower than that of conventional X-ray fluoroscopy and CT.5 Additionally, dynamic DR, unlike spirometry, does not require forced expiration and techniques that depend on the operator and the patient being evaluated. Since dynamic DR is a noninvasive evaluation and is easy to perform, even unstable patients can be repeatedly tested.
Additionally, the sequential chest X-ray images provided by dynamic DR9 during respiration make it easy for both operators and patients to understand the respiratory kinetics of the chest. Thus, this system can be expected to improve the patient’s understanding of the disease and adherence to treatment in a clinical setting. The commercial system was released in 2018 and received approval from the US Food and Drug Administration in 2019. Thus, physicians can easily analyze dynamic images using this system.
The limitations of the study deserve consideration. First, this was a single-point test analysis. Analyses of sequential tests are needed to assess their reproducibility and the effectiveness of treatments. Second, there is a bias in the number of patients in each group. The number of patients with severe AL is small compared to the number of patients with mild AL. There were no patients with mixed ventilatory disorders in this cohort. Larger cohorts that include participants with severe airflow limitation and mixed ventilatory disorders are needed to validate the findings of this study. Third, obese and vertebral deformity may affect the parameters such as diaphragmatic motion, and lung area change rate. In this study, only 2 of 273 subjects had severe obesity (BMI>35). No subjects with vertebral deformity were found in the study. The parameters divided by BMI are presented in Supplemental Table 2. Differences in BMI-compensated data between groups showed almost the same tendency as non-compensated data. In the future studies, this point needs to be considered in subjects with obesity and vertebral deformity. Finally, the results of this study were analyzed for one cycle of slow and maximum breathing for each participant, because of the radiation dose. To confirm reproducibility, repeated analysis of each participant’s respiratory cycle is desirable. Furthermore, other parameters provided by dynamic-ventilatory DR and other breathing maneuvers should be analyzed in order to verify the clinical utility of dynamic-ventilatory DR. For example, lateral chest x-rays and dynamic measurements and tidal breathing performed during several respiratory rates may also be effective.
In conclusion, dynamic-ventilatory DR is a potential tool for evaluating ventilatory disorders in patients with respiratory diseases.
Acknowledgments
The authors would like to thank Akinori Tsunomori and Noritsugu Matsutani for their assistance with this study. This study was supported by Konica Minolta, Inc. (Tokyo, Japan).
Disclosure
Dr Noriyuki Ohkura, Dr Rie Tanaka, Dr Isao Matsumoto, and Dr Kazuo Kasahara report grants from Konica Minolta, Inc. (Tokyo, Japan), outside the submitted work. Dr Miki Abo and Dr Munehisa Takata report non-financial support from Konica Minolta, Inc. (Tokyo, Japan), outside the submitted work. The authors report no other conflicts of interest in this work.
References
1. Celli BR, Cote CG, Marin JM, et al. The body-mass index, airflow obstruction, dyspnea, and exercise capacity index in chronic obstructive pulmonary disease. N Engl J Med. 2004;350(10):1005–1012. doi:10.1056/NEJMoa021322
2. Ryerson CJ, Vittinghoff E, Ley B, et al. Predicting survival across chronic interstitial lung disease: the ILD-GAP model. Chest. 2014;145(4):723–728. doi:10.1378/chest.13-1474
3. Miller MR, Hankinson J, Brusasco V, et al. Standardisation of spirometry. Eur Respir J. 2005;26(2):319–338. doi:10.1183/09031936.05.00034805
4. Tanaka R. Dynamic chest radiography: flat-panel detector (FPD) based functional X-ray imaging. Radiol Phys Technol. 2016;9(2):139–153. doi:10.1007/s12194-016-0361-6
5. Tanaka R, Sanada S, Kobayashi T, Suzuki M, Matsui T, Matsui O. Computerized methods for determining respiratory phase on dynamic chest radiographs obtained by a dynamic flat-panel detector (FPD) system. J Digit Imaging. 2006;19(1):41–51. doi:10.1007/s10278-004-1045-z
6. Tanaka R, Sanada S, Okazaki N, et al. Evaluation of pulmonary function using breathing chest radiography with a dynamic flat panel detector: primary results in pulmonary diseases. Invest Radiol. 2006;41(10):735–745. doi:10.1097/01.rli.0000236904.79265.68
7. Hida T, Yamada Y, Ueyama M, et al. Decreased and slower diaphragmatic motion during forced breathing in severe COPD patients: time-resolved quantitative analysis using dynamic chest radiography with a flat panel detector system. Eur J Radiol. 2019;112:28–36. doi:10.1016/j.ejrad.2018.12.023
8. Watase S, Sonoda A, Matsutani N, et al. Evaluation of intrathoracic tracheal narrowing in patients with obstructive ventilatory impairment using dynamic chest radiography: a preliminary study. Eur J Radiol. 2020;129:109141. doi:10.1016/j.ejrad.2020.109141
9. Ohkura N, Kasahara K, Watanabe S, et al. Dynamic-ventilatory digital radiography in air flow limitation: a change in lung area reflects air trapping. Respiration. 2020;99(5):382–388. doi:10.1159/000506881
 © 2021 The Author(s). This work is published and licensed by Dove Medical Press Limited. The
full terms of this license are available at https://www.dovepress.com/terms
and incorporate the Creative Commons Attribution
- Non Commercial (unported, 3.0) License.
By accessing the work you hereby accept the Terms. Non-commercial uses of the work are permitted
without any further permission from Dove Medical Press Limited, provided the work is properly
attributed. For permission for commercial use of this work, please see paragraphs 4.2 and 5 of our Terms.
© 2021 The Author(s). This work is published and licensed by Dove Medical Press Limited. The
full terms of this license are available at https://www.dovepress.com/terms
and incorporate the Creative Commons Attribution
- Non Commercial (unported, 3.0) License.
By accessing the work you hereby accept the Terms. Non-commercial uses of the work are permitted
without any further permission from Dove Medical Press Limited, provided the work is properly
attributed. For permission for commercial use of this work, please see paragraphs 4.2 and 5 of our Terms.