Back to Journals » Clinical Epidemiology » Volume 11
Charlson Comorbidity Index Based On Hospital Episode Statistics Performs Adequately In Predicting Mortality, But Its Discriminative Ability Diminishes Over Time
Authors Pylväläinen J, Talala K ![]() , Murtola T
, Murtola T ![]() , Taari K
, Taari K ![]() , Raitanen J
, Raitanen J ![]() , Tammela TL, Auvinen A
, Tammela TL, Auvinen A ![]()
Received 7 June 2019
Accepted for publication 23 August 2019
Published 18 October 2019 Volume 2019:11 Pages 923—932
DOI https://doi.org/10.2147/CLEP.S218697
Checked for plagiarism Yes
Review by Single anonymous peer review
Peer reviewer comments 2
Editor who approved publication: Dr Eyal Cohen
Juho Pylväläinen,1–3 Kirsi Talala,4 Teemu Murtola,5–7 Kimmo Taari,8 Jani Raitanen,1,9 Teuvo L Tammela,6 Anssi Auvinen1
1Tampere University, Faculty of Social Sciences (Health Sciences), Tampere, Finland; 2Helsinki University, Faculty of Medicine, Department of Diagnostics and Therapeutics, Helsinki, Finland; 3Helsinki University Central Hospital, Medical Imaging Center, Helsinki, Finland; 4Cancer Society of Finland, Finnish Cancer Registry, Mass Screening Registry, Helsinki, Finland; 5Tampere University, Faculty of Medicine and Health Technology, Prostate Cancer Research Center, Tampere, Finland; 6Tampere University Hospital, Department of Urology, Tampere, Finland; 7Seinäjoki Central Hospital, Department of Surgery, Seinäjoki, Finland; 8University of Helsinki and Helsinki University Hospital, Department of Urology, Helsinki, Finland; 9UKK Institute for Health Promotion Research, Tampere, Finland
Correspondence: Juho Pylväläinen
Helsinki University Central Hospital, Medical Imaging Center, Haartmaninkatu 3, PO Box 180, 00029, Helsinki, Uusimaa, Finland
Tel +358 503239286
Email [email protected]
Purpose: To evaluate the performance of Charlson Comorbidity Index (CCI) calculated using hospitalization and medication reimbursement databases in predicting mortality.
Patients and methods: Information on hospitalizations was obtained from the national Care Register for Health Care (HILMO) and on medication reimbursements and entitlements for special reimbursements for medications from the Social Insurance Institution for 77,440 men aged 56–71 years at baseline. The subjects were followed up for mortality via Statistics Finland with 20,562 deaths during a 13-year follow-up.
Results: Compared to a CCI score of 0, the age-adjusted hazard ratio for all-cause mortality associated with HILMO-based CCI scores of 1, 2 and 3 or more were 2.39 (95% CI 2.29–2.49), 2.96 (95% CI 2.81–3.13) and 6.42 (95% CI 5.95–6.93) at 13 years. The C-statistic was 0.72 at 1, 0.68 at 5 and 0.66 at 13 years, with only minor improvement over age alone (0.10, 0.06 and 0.04 accordingly). Addition of medication data did not improve predictive abilities and medication-based CCI performed poorly on its own.
Conclusion: The hospitalization-based CCI, as well as that based on both databases, predicts relative mortality adequately, but its discriminative ability diminishes over time. Conditions related to hospitalizations affect survival more than medications.
Keywords: mortality, comorbidity, follow-up studies, hospitalization/statistics and numerical data, drug prescriptions/statistics and numerical data, confounding factors
Introduction
In medical research, the outcome of interest, such as survival is often influenced by confounding and effect modification due to comorbidities. Hence, adjustment for comorbidities is often necessary. Analysis and data acquisition of multiple individual comorbidities is generally ineffective, and a simple standardized score describing comorbidity burden is often preferable.
Several comorbidity indices based on various sources of information and different criteria have been developed for predicting various outcomes.1–4 When the outcome of interest is mortality and information on diagnoses is available, the Charlson Comorbidity Index (CCI) is most commonly used.
CCI is a weighted index, originally based on the impact of major diseases on relative mortality of hospitalized patients during a 1-year follow-up.1 The original CCI was based on data derived from medical records and covered a total of 19 diseases graded by severity providing a score for predicting the relative risk of death compared to a low-risk population. It has been shown to predict both short- and long-term mortality.1,5–9 After the introduction of the index, several updates and modifications of the index have been published to maintain and improve its applicability.6–9 During the evolution of the index, the number of included diseases and the score weighting have varied.
The index has been validated in many countries for use with administrative registries and its performance has been compared to other diagnosis-based indices (eg, Elixhauser) and pharmacy-based indices (eg, RxRisk-V and CDS).6–15 The Elixhauser index seems to perform best in mortality prediction, with CCI a close second. However, the calculation of the Elixhauser index is more complicated.16
Most studies on CCI have utilized specific subpopulations, eg, cohorts selected from hospitalized patients, which ensures availability of health care data and hence feasibility of calculating the index.12–14,17,18 This limits the generalizability of the results to larger, less selective populations, such as the general population, where undocumented illnesses could reduce the predictive power of the index. Nevertheless, reasonable validity of the index has also been demonstrated in some population-based studies, but the performance of the comprehensive Finnish administrative databases for such task has not been evaluated.10,11
The aim of our population-based study is to assess the performance of CCI based on the Finnish national Care Register for Health Care (HILMO), which resembles the widely utilized English Hospital Episode Statistics (HES).19 We also evaluate the performance of medication databases of the Social Insurance Institution of Finland (SII) as an alternative data source for calculating CCI. Additionally, we compare the performance of two previously proposed modifications of the index and evaluate their predictive characteristics during long-term follow-up.
Materials And Methods
The study population consisted of the men in the Finnish Prostate Cancer Screening Trial (FinRSPC), the largest component of European Randomized Study of Screening for Prostate Cancer (ERSPC). After exclusion of men with a prevalent prostate cancer at entry, the Finnish trial included at baseline 80,458 men born in 1929–1944 and living in the Helsinki or Tampere metropolitan area. The population was identified from the Finnish Population Registry. Of them, 32,000 men were randomly assigned to the screening arm and received an invitation to screening for prostate cancer. The remaining 48,458 men formed the control arm and received no intervention.
The follow-up for the current study started on January 1st, 2000, and at that time, 46,630 men in the control arm and 30,810 on the screening arm were alive. Follow-up ended at death or on the common closing date of December 31st, 2012.
We used two modifications of CCI to estimate comorbidity, those by Deyo and Quan. Deyo’s index, the most commonly used adaptation, is largely similar to the original CCI and merely reduces the number of conditions to 17 by combining leukemia, lymphoma and other malignancies into a single group (Supplementary material 1).6,16 One of the most recent updates, the Quan’s adaptation, not only reduced the number of diseases to 12 but also changed the weighting of the score (Supplementary material 1).9
To calculate the CCI score, information on diseases was obtained from three different registries for the period 1996–1999. The score was calculated using the diagnosis data provided by HILMO and SII registries separately and then by using the pooled diagnostic data from both sources.
The nationwide Care Registry for Health Care covers in-patient hospital episodes, day surgery and tertiary outpatient visits.20 The primary diagnosis and an unlimited number of secondary diagnoses have been recorded using the 10th revision of the International Classification of Diseases (ICD-10) since 1996 for all public and private hospitals in Finland.21 Besides appropriate diagnoses, area of residence, admission and discharge dates, and hospital ID are recorded.
ICD-10 diagnoses were modified to achieve compatibility with the CCI diagnoses using an algorithm developed by Deyo, Sundarajan, Halfon and Quan (Supplementary material 1).6,22,23
All permanent residents of Finland are eligible for reimbursements for the cost of medicines prescribed by a physician or a dentist. The reimbursements are administered by SII, a governmental organisation responsible for the comprehensive health insurance system. SII has maintained a database on reimbursements for prescription medicines since 1995 and on entitlements for special reimbursement since 1968.24,25
The Finnish pharmacy database was searched for drugs that list conditions used for calculating the CCI as an indication.26 Only those medications were used for which the indications of use were sufficiently unequivocal to enable determination of the underlying medical condition.
A special entitlement for reimbursement is required for certain expensive medications and some conditions entitle patients to a higher rate of reimbursement. These entitlements and reimbursements require a medical certificate demonstrating that the diagnostic criteria are fulfilled. The eligibility criteria of entitlements to special reimbursements were checked accordingly for unanimously conclusive CCI compatible diseases.27
The entitlement and Anatomical Therapeutic Chemical (ATC) codes of drugs allowing determination of the CCI compatible diagnoses are listed in Supplementary material 1. Compatible drugs were found for five (dementia, cerebrovascular disease, chronic pulmonary disease, rheumatologic disease and diabetes without chronic conditions) and fitting entitlements for seven (dementia, congestive heart failure, chronic pulmonary disease, rheumatologic disease, diseases without chronic complications, moderate or severe renal disease and any malignancy) out of 17 conditions.
Information on deaths was obtained from the Causes of Death Registry of the Statistics Finland covering all deaths of Finnish residents.
The Harrell’s C-statistic or area under the curve (AUC) was used as an indicator of discriminative ability. For interpretation, it has been suggested to consider a C-statistic value of < 0.7 poor, 0.7–0.8 acceptable and > 0.8 excellent.28 We calculated the C-statistic by using logistic regression with death from any cause as the dependent variable, and age and CCI score as independent predictor variables. The Akaike’s Information Criterion (AIC) was calculated to assess the relative goodness of fit and model simplicity. The hazard ratio for death was estimated using Cox regression and survival time using the age-adjusted Kaplan–Meier method. 95% confidence intervals (CI) and p-values were calculated to assess the statistical significance of differences between methods. P-values of less than 0.05 were regarded as statistically significant. All analyses were performed with Stata version 15.1.
Results
The mean age of the study population at entry was 62.5 years (SD 4.6 years). The median follow-up time was 13 years. During the follow-up, there were 20,562 deaths from all causes, with cumulative mortality of 26.6% at 13 years. Prevalence of diseases included in the Deyo’s adaptation of CCI is listed in Supplementary material 2.
When CCI was calculated using the Deyo’s adaptation based on HILMO alone, 11.0% of the study population had a CCI score of 1 or more at baseline (Table 1). The average CCI for the population with any comorbidity was 1.57. The age-adjusted Kaplan–Meier survival estimates for men with CCI score 0 versus 3 or more were 99% vs 92% at 1 year, 96% vs 64% at 5 years and 87% vs 33% at 13 years (Figure 1). The survival probability decreased monotonously with increasing CCI score.
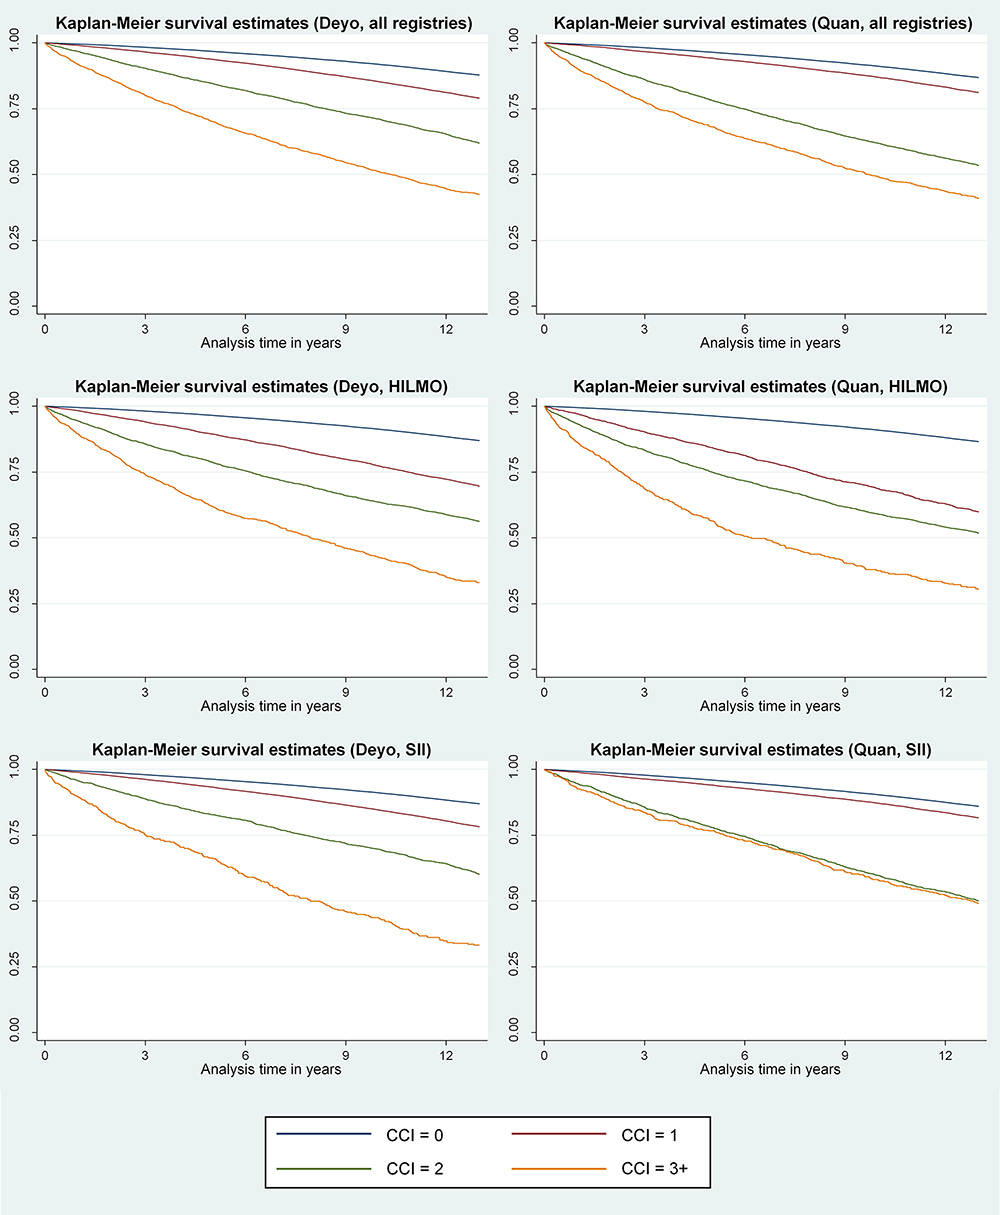 |
Figure 1 Kaplan–Meier survival estimates for Deyo’s and Quan’s adaptation of the Charlson Comorbidity Index derived from the hospitalization (HILMO) and medication (SII) data separately and in combination. |
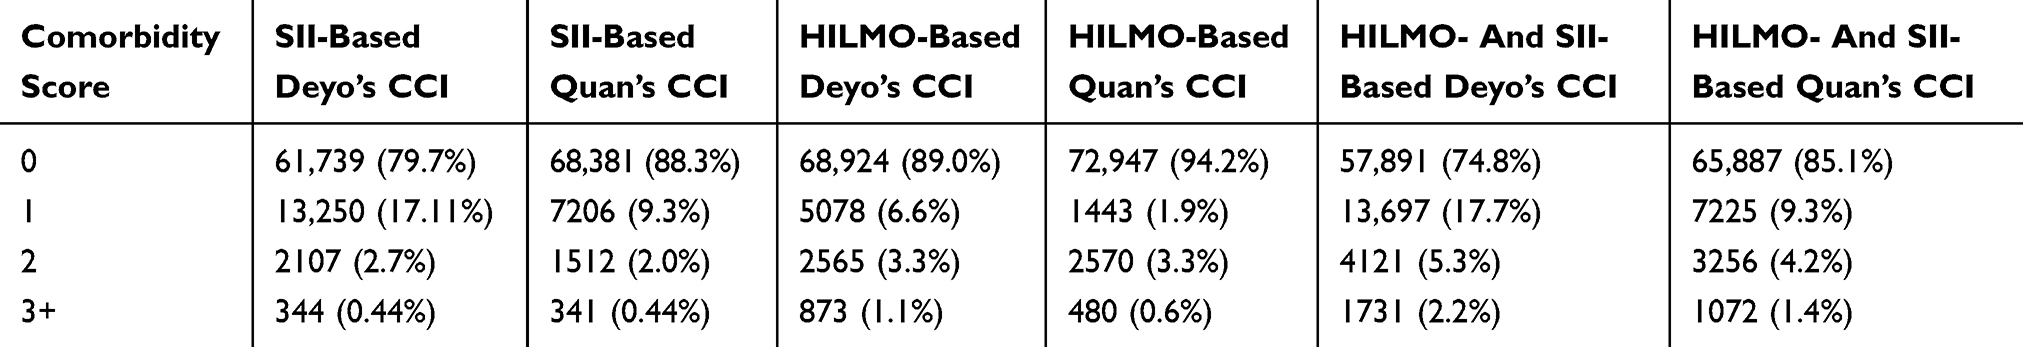 |
Table 1 The Number Of Men By Deyo’s And Quan’s Adaptation Of The Charlson Comorbidity Index (CCI) Based On The Care Registry For Health Care (HILMO) And Medication Data (SII) Separately And In Combination |
Compared to the men with a CCI score of 0, the age-adjusted hazard ratio (HR) for all-cause mortality associated with a score of 1 was 2.39 (95% CI 2.29–2.49) at 13 years. For men with a score of 2, the HR was 2.96 (95% CI 2.81–3.13) and those with a score of 3 or more 6.42 (95% CI 5.95–6.93) (Table 3).
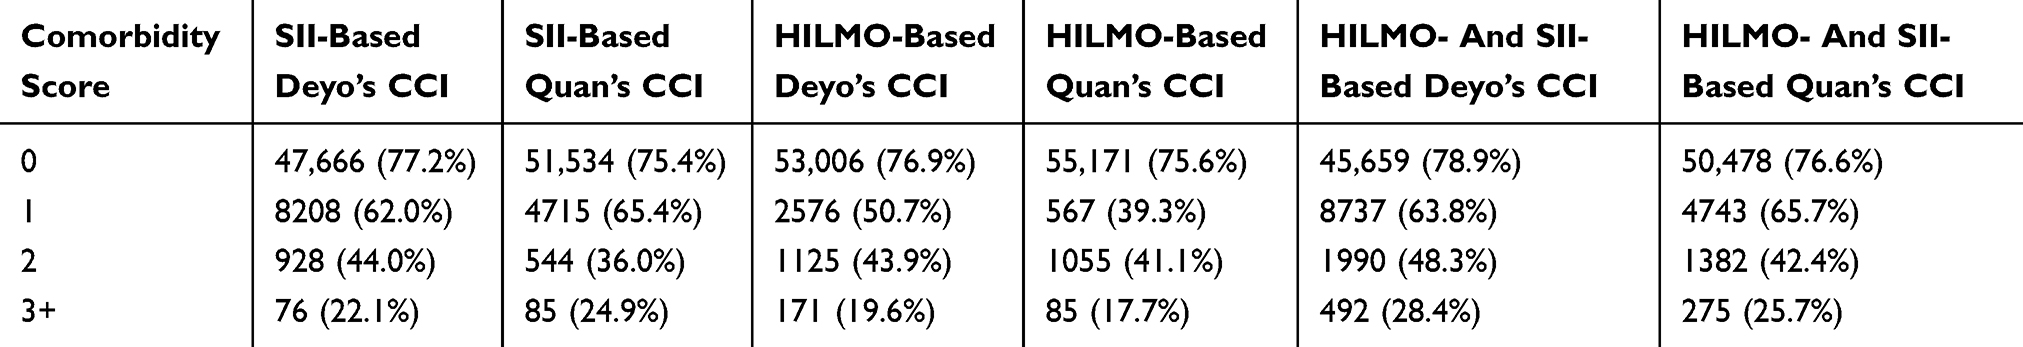 |
Table 2 The Survival Rates Of Men At 13 Years By Deyo’s And Quan’s Adaptation Of The Charlson Comorbidity Index (CCI) Based On The Care Registry For Health Care (HILMO) And Medication Data (SII) Separately And In Combination |
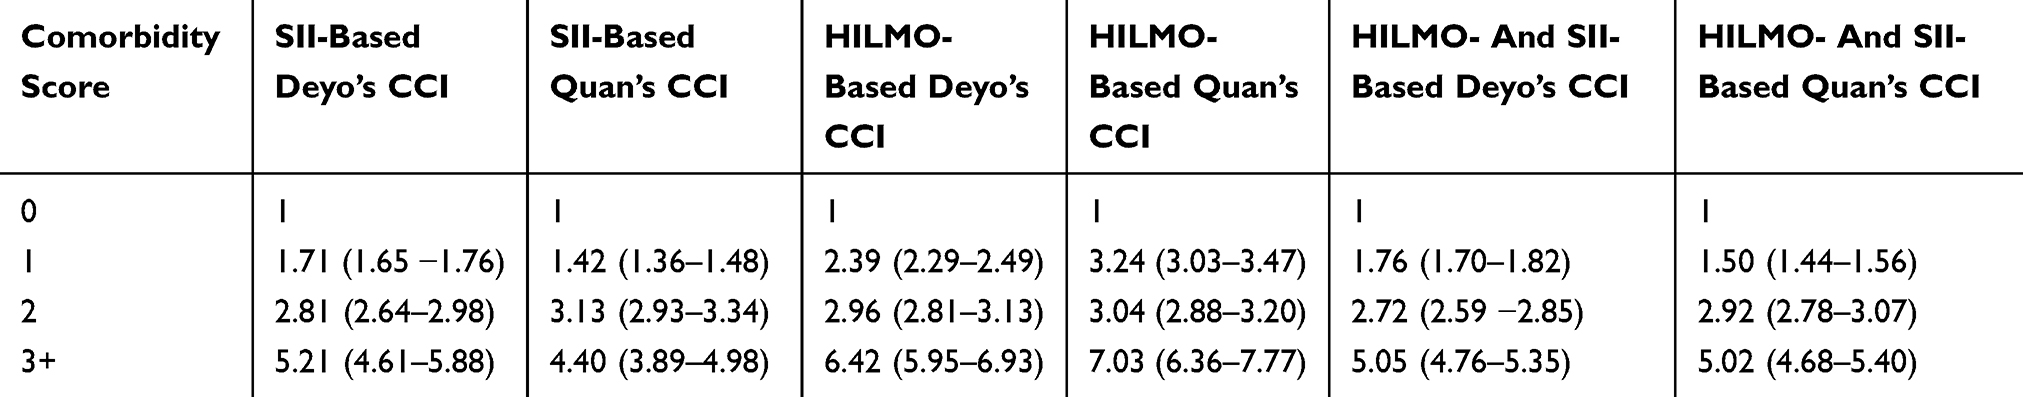 |
Table 3 Hazard Ratios (HR) Of Death With Their 95% Confidence Intervals (In Parentheses) Of Two Derivations Of The Charlson Comorbidity Index (CCI) Calculated From The Care Registry For Health Care (HILMO), Social Security Institution (SII) And Their Combination |
With the method in question, C-statistic for predicting mortality was 0.72 (95% CI 0.71–0.74) at 1 year, 0.68 (95% CI 0.68–0.69) at 5 and 0.66 (95% CI 0.65–0.66) at 13 years, with statistically significant (P<0.001) but minor incremental contribution over age alone (difference in C statistic 0.10 at 1 year, 0.06 at 5 years and 0.04 at 13 years) (Table 4). The weakening of discriminative ability over time is depicted in Figure 2.
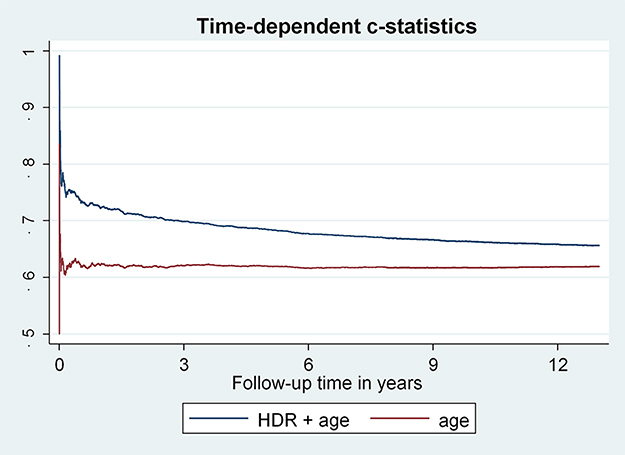 |
Figure 2 Time-Dependent C-Statistics Calculated Using Age And Combination Of Deyo’s Adaptation Of Charlson Comorbidity Index (CCI) Based On The Care Registry For Health Care (HILMO) And Age As Independent Predictor Variables. |
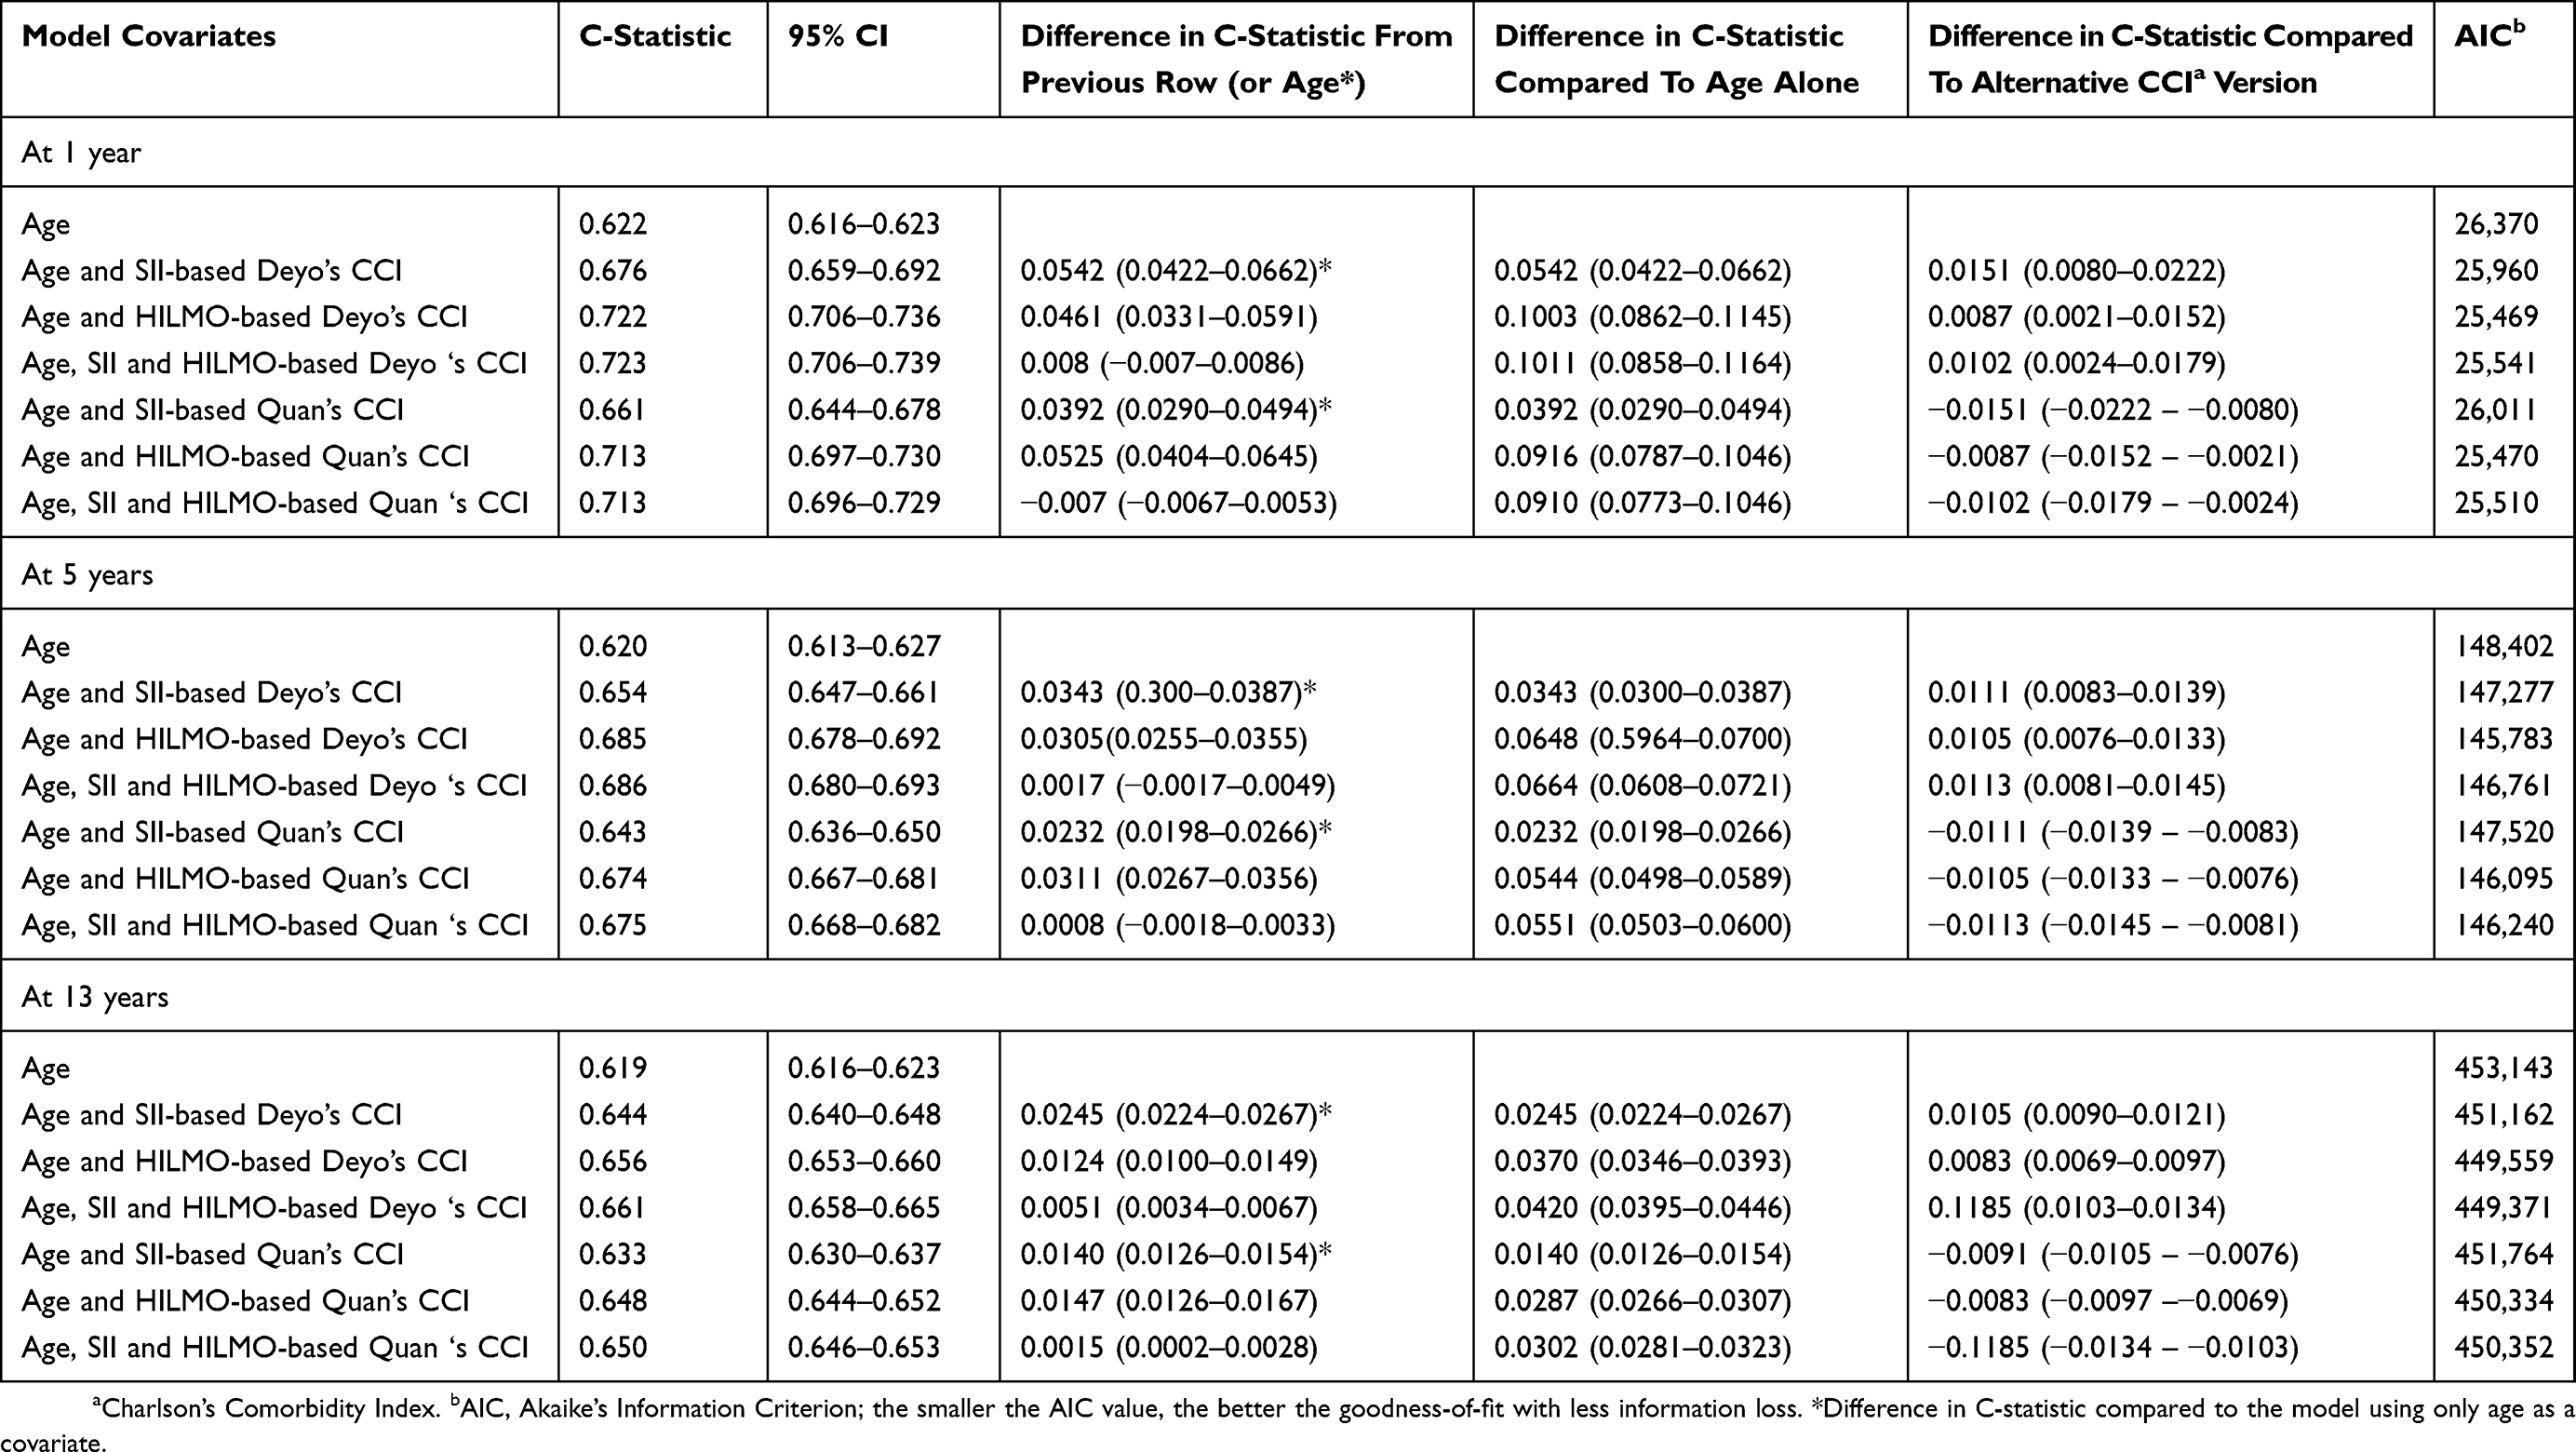 |
Table 4 Comparison Of Performance And Goodness-Of-Fit Of Two Derivations Of The Charlson Comorbidity Index (CCI) Calculated From The Care Registry For Health Care (HILMO), Social Security Institution (SII) And Their Combination For Predicting Mortality. 95% Confidence Intervals Are Reported In Parentheses When Relevant |
Compared to HILMO-based CCI, combining all three registries to derive the Deyo’s adaptation of the CCI resulted in higher comorbidity prevalence (25.2% vs 11.0%) (Table 1), but slightly lower average CCI score among men with comorbidity (1.44 vs 1.51). Results for survival (Figure 1, Tables 2 and 4) and hazard ratios (Table 3) were similar. Using all three registries provided statistically significant, but marginal improvement in the discriminative ability only at 13 years (C-statistic difference 0.005, P<0.001). Accordingly, AIC was lowest at 13 years using all registries but lowest at 1 and 5 years when the HILMO data alone were used.
Using only the SII reimbursement and entitlement data resulted in a CCI score >0 for 20.3% of the men (Table 1). The scores were lower on average compared with the HILMO data alone (average CCI 1.18 vs 1.57) and showed weaker discriminative ability at each observation point for both adaptations (Tables 3 and 4).
The Quan’s adaptation of the index yielded lower comorbidity prevalence and comorbidity scores with each data source (Table 1). Similar, but less consistent, increase in mortality and reduction in survival across the CCI scores were seen as with Deyo’s adaptation. When only the hospitalization data were used, the difference in mortality at 13 years between men with CCI of 1 and 2 (HR 3.24, 95% CI 3.03–3.47 vs 3.04, 95% CI 2.88–3.20) was insignificant. The C-statistics of each source was marginally but statistically significantly lower (P<0.02) for Quan’s than Deyo’s adaptation (Table 4).
Discussion
Our results indicate that the Charlson Comorbidity Index calculated using hospitalization data (from the Finnish national Care Register for Health Care, HILMO) alone or combined with the medication databases of the Social Insurance Institution of Finland (SII) performs in an acceptable fashion in predicting 1-year mortality, but its performance wanes over time. The incremental contribution of the index to discriminate men at higher risk of death compared to age alone was minor and correspondingly diminished with longer follow-up.
Compared to CCI based on HILMO data alone, the additional data on prescription medications and entitlements for special reimbursement increased the prevalence of comorbidity without substantially improving the discriminative ability of the index. Usage of medication-based data alone resulted in poorest discrimination. The predictive properties of Quan’s adaptation of the CCI were found to be slightly worse all-around than Deyo’s.
Whether using all registries or hospitalization data alone, an acceptable level of discrimination was achieved for 1-year mortality with both adaptations. When Deyo’s adaptation was used, the C-statistic was 0.72 for HILMO and all registries, whereas the C-statistic for Quan’s adaptation was 0.71 for both approaches accordingly. These results are in line with previous studies on administrative registries, which have reported C-statistic ranging 0.711 to 0.882 for 1-year mortality.9,10,12–14,29
The additional discriminative contribution of CCI over age and gender was statistically significant, but minor in absolute terms, and diminished over time (0.10 for hospitalization data alone and all registries for 1-year mortality, down to 0.04, respectively, for 13-year mortality). In previous studies, the reported incremental contribution of the CCI to the discriminative capacity of the predictive model over base model (which generally includes age and gender but also other covariates) has ranged from 0.026 to 0.113.11–13,29 Similar reductions in discrimination at extended follow-up have been reported earlier, but to our knowledge, our study is the first one to evaluate follow-up extending beyond 10 years.10,11
When Deyo’s adaptation was used, the hazard ratios during the entire 13-year follow-up for a CCI score of 1 (relative to zero) were 2.4 (95% CI 2.29–2.49) for hospitalization data and 1.7 (95% CI 1.65–1.76) for medication data. In the original CCI, the weighting of 1 was assigned for diseases with hazard ratio of 1.2–1.5 at 1 year, which is comparable to our results with medication data.1 The hospitalization data seem to capture more severe and advanced conditions so that adequate discriminative ability for predicting mortality can be achieved even with a low comorbidity prevalence (11.0%). The addition of medication data increased the prevalence (25.2%) of comorbidity without substantially improving the discriminative ability. Similar results have been found in two previous studies by Lu et al (2011) and Crooks et al (2015).11,13 The former reported a higher prevalence of lesser comorbidities with a pharmacy-based Rx-Risk-V index, whereas the prevalence of more severe comorbidities was higher with a hospitalization-based CCI. The latter found that though population-based primary care data identified a higher prevalence of comorbidity than secondary care, this did not result in improved predictive performance of CCI. Such emphasis on lesser conditions and limitation of use to only a few diseases due to lack of specificity due to multiple indications may explain the poor performance of discriminative ability of medication data.
To our knowledge, our study is the first one to evaluate the additional value of medication data over other methods for calculating CCI. A previous study used medication data as an additional source data for CCI calculation, but no information on its additional contribution was reported.18
Our study had some limitations. It was limited to men only. Also, as our population-based study utilized routinely collected health care data, we share their quality-related limitations, which reflect on the performance of the index.
As some conditions included in CCI are managed mainly in primary care and do not necessarily require in-patient care, day surgery or tertiary outpatient visits, hospitalization data seem to underestimate the prevalence of minor comorbidities and emphasize more severe conditions. The completeness and accuracy of the Care Registry for Health Care has been reported to vary from satisfactory to very good depending on the condition, with poor recording of subsidiary diagnoses as a recognised limitation.21 The accuracy of some CCI compatible diseases (coronary heart disease, dementia, cerebrovascular disease, cervical cancer, and heart failure) has been previously evaluated with sensitivity ranging 11% to 97% (eg, 11% for heart failure and 90–97% for stroke) and positive predictive value (PPV) ranging from 73% to 97%.21,30–36 The validity of data has been shown to improve over time and further improvement can be expected, as recording of hospitalization data was expanded to include primary health care visits in 2011.20,36
The utility of medication reimbursement and special entitlement data for calculating CCI was limited. Few drugs had sufficiently specific indications to allow unequivocal definition of the diagnosis (Supplementary material 1). Most medications have a range of possible indications, making it impossible to classify the use of drugs to a single condition category of CCI. Also, during 1996–1999, the number of diseases meriting special entitlements was small (though it has since increased).37 Most conditions entitling for a special reimbursement used in the study were introduced in 1999 (eg, dementia drugs), just before the baseline of the study, and correspondingly the end of the data collection period for morbidity.
Few studies have estimated the validity of special entitlement data of CCI compatible diseases. In the previously referenced study conducted by Mähönen et al (2013), special entitlement data had better validity than HILMO with sensitivity and PPV of 23% and 93% for heart failure.30 The same study also estimated the validity of pharmacy data producing sensitivity of 5.8% and PPV of 28.6% for heart failure, but such drugs were left out of our study for having too diverse indications. Another study has estimated the validity of Alzheimer’s disease (AD) entitlements (SII entitlement code 307) and found the PPV to be 97.1% and sensitivity 63.5%.36 However, since AD is only one of the causes of dementia and reimbursement of dementia drugs did not start until January 1999, this may not reflect the validity of our method.
The large and representative study population and the long follow-up were the major strengths of our study. Access to comprehensive register data on hospital admissions and medications, with deterministic record linkage, allowed us to obtain comprehensive coverage of the data for the study. Since the study was population-based, its generalizability in Finland should be good, as the registries used are nationwide. Also, complete follow-up for mortality was an advantage, minimising the risk of selection and information bias.
Conclusions
According to our study, the CCI can be calculated using the Finnish national hospitalization registry. And therefore, the CCI can be used to adjust for comorbidity-related mortality inexpensively and relatively effortlessly in the Finnish population by utilizing routinely collected health care registries. In accordance with previous studies, the additional predictive value over age alone was modest and diminished significantly over time. The medication data did not improve the predictive ability of the index, despite increasing comorbidity prevalence.
Ethics Approval And Informed Consent
Ethics committee of the Pirkanmaa Hospital District reviewed the study protocol (tracking number R10167). Permission to obtain data from the Care Register for Health Care was obtained from the National Institute for Health and Welfare, and data from the medication databases were obtained with a permission of the Social Insurance Institution.
Data Availability
The Finnish Prostate Cancer Screening Trial is part of the European Randomised Study of Screening for Prostate Cancer, and the primary data will be released as part of the European trial at their website (www.erspc.org). Preparations for making the data available are in progress. In addition, data from the Finnish and European trial can be requested from the investigators for analysis.
Acknowledgments
The study was funded by the Academy of Finland (Grant No 132385 and 260 931), Cancer Society of Finland, and Pirkanmaa Hospital District Competitive Research Funding (Grant No 9V065).
The funding sources had no involvement in planning, conducting, or reporting of the study.
Author Contributions
All authors contributed to data analysis, drafting or revising the article, gave final approval of the version to be published, and agreed to be accountable for all aspects of the work.
Disclosure
Murtola Teemu reports consultant fees from Astellas, Ferring and Janssen Cilag; Speaker’s fees from Astellas and Janssen Cilag. Taari Kimmo reports research funding from Medivation/Astellas/Pfizer, Orion, Myovant. Teuvo Tammela reports Research funding and consulting fees from Bayer, Lidds AB and Astellas; Consulting fees from Janssen. Anssi Auvinen reports consulting fees from Epid Research Inc. The authors report no other conflicts of interest in this work.
References
1. Charlson ME, Pompei P, Ales KL, MacKenzie CR. A new method of classifying prognostic comorbidity in longitudinal studies: development and validation. J Chronic Dis. 1987;40(5):373–383. doi:10.1016/0021-9681(87)90171-8
2. Von Korff M, Wagner EH, Saunders K. A chronic disease score from automated pharmacy data. J Clin Epidemiol. 1992;45(2):197–203. doi:10.1016/0895-4356(92)90016-g
3. Elixhauser A, Steiner C, Harris DR, Coffey RM. Comorbidity measures for use with administrative data. Med Care. 1998;36(1):8–27. doi:10.1097/00005650-199801000-00004
4. Fishman PA, Goodman MJ, Hornbrook MC, Meenan RT, Bachman DJ, O’Keeffe Rosetti MC. Risk adjustment using automated ambulatory pharmacy data: the RxRisk model. Med Care. 2003;41(1):84–99. doi:10.1097/00005650-200301000-00011
5. Charlson M, Szatrowski TP, Peterson J, Gold J. Validation of a combined comorbidity index. J Clin Epidemiol. 1994;47(11):1245–1251. doi:10.1016/0895-4356(94)90129-5
6. Deyo RA, Cherkin DC, Ciol MA. Adapting a clinical comorbidity index for use with ICD-9-CM administrative databases. J Clin Epidemiol. 1992;45(6):613–619. doi:10.1016/0895-4356(92)90133-8
7. Romano PS. Further evidence concerning the use of a clinical comorbidity index with ICD-9-CM administrative data. J Clin Epidemiol. 1993;46(10):1085–1090. doi:10.1016/0895-4356(93)90106-B
8. D’Hoore W, Bouckaert A, Tilquin C. Practical considerations on the use of the Charlson comorbidity index with administrative data bases. J Clin Epidemiol. 1996;49(12):1429–1433. doi:10.1016/s0895-4356(96)00271-5
9. Quan H, Li B, Couris CM, et al. Updating and validating the Charlson comorbidity index and score for risk adjustment in hospital discharge abstracts using data from 6 countries. Am J Epidemiol. 2011;173(6):676–682. doi:10.1093/aje/kwq433
10. Mnatzaganian G, Ryan P, Norman PE, Hiller JE. Accuracy of hospital morbidity data and the performance of comorbidity scores as predictors of mortality. J Clin Epidemiol. 2012;65(1):107–115. doi:10.1016/j.jclinepi.2011.03.014
11. Crooks CJ, West J, Card TR. A comparison of the recording of comorbidity in primary and secondary care by using the Charlson index to predict short-term and long-term survival in a routine linked data cohort. BMJ Open. 2015;5(6):007974. doi:10.1136/bmjopen-2015-007974
12. Schneeweiss S, Wang PS, Avorn J, Glynn RJ. Improved comorbidity adjustment for predicting mortality in medicare populations. Health Serv Res. 2003;38(4):1103–1120.
13. Lu CY, Barratt J, Vitry A, Roughead E. Charlson and Rx-Risk comorbidity indices were predictive of mortality in the Australian health care setting. J Clin Epidemiol. 2011;64(2):223–228. doi:10.1016/j.jclinepi.2010.02.015
14. Perkins AJ, Kroenke K, Unutzer J, et al. Common comorbidity scales were similar in their ability to predict health care costs and mortality. J Clin Epidemiol. 2004;57(10):1040–1048. doi:10.1016/j.jclinepi.2004.03.002
15. Brilleman SL, Salisbury C. Comparing measures of multimorbidity to predict outcomes in primary care: a cross sectional study. Fam Pract. 2013;30(2):172–178. doi:10.1093/fampra/cms060
16. Sharabiani MT, Aylin P, Bottle A. Systematic review of comorbidity indices for administrative data. Med Care. 2012;50(12):1109–1118. doi:10.1097/MLR.0b013e31825f64d0
17. Nuttall M, van der Meulen J, Emberton M. Charlson scores based on ICD-10 administrative data were valid in assessing comorbidity in patients undergoing urological cancer surgery. J Clin Epidemiol. 2006;59(3):265–273. doi:10.1016/j.jclinepi.2005.07.015
18. Bannay A, Chaignot C, Blotiere PO, et al. The best use of the Charlson comorbidity index with electronic health care database to predict mortality. Med Care. 2016;54(2):188–194. doi:10.1097/MLR.0000000000000471
19. Hospital Episode Statistics (HES). NHS Digital website. [Edited March 26, 2019]. Available from: http://content.digital.nhs.uk/hes.
20. Care Register for Health Care. National Institute for Health and Welfare (THL) website. [Updated February 25, 2016]. Available from: https://www.thl.fi/fi/web/thlfi-en/statistics/information-on-statistics/register-descriptions/care-register-for-health-care.
21. Sund R. Quality of the finnish hospital discharge register: a systematic review. Scand J Public Health. 2012;40(6):505–515. doi:10.1177/1403494812456637
22. Sundararajan V, Henderson T, Perry C, Muggivan A, Quan H, Ghali WA. New ICD-10 version of the Charlson comorbidity index predicted in-hospital mortality. J Clin Epidemiol. 2004;57(12):1288–1294. doi:10.1016/j.jclinepi.2004.03.012
23. Quan H, Sundararajan V, Halfon P, et al. Coding algorithms for defining comorbidities in ICD-9-CM and ICD-10 administrative data. Med Care. 2005;43(11):1130–1139. doi:10.1097/01.mlr.0000182534.19832.83
24. Koko kuvaus: Tilasto lääkkeiden korvausoikeuksista [Statistics on reimbursements]. The Social Insurance Institution of Finland website. [Updated April 8, 2019]. Available from: http://www.kela.fi/koko-kuvaus-tilasto-laakkeiden-korvausoikeuksista.
25. Reimbursements for medicine expenses. The Social Insurance Institution of Finland website. [Updated January 1, 2019]. Available from: http://www.kela.fi/web/en/medicine-expenses.
26. Duodecimin lääketietokanta [Pharmaceutical database of Duodecim] Duodecim website. [Modified February 8, 2019]. Available from: https://www.duodecim.fi/tuotteet-ja-palvelut/terveysportti/laaketieto.
27. Erityiskorvaus ja muut lääkkeiden korvausoikeudet [Special reimbursements and reimbursements of other drugs]. The Social Insurance Institution of Finland website Available from: http://www.kela.fi/laakkeet_erityiskorvaus.
28. Kleinbaum DG, Klein M, Pryor ER. Logistic Regression: A Self-learning Text.
29. Chu YT, Ng YY, Wu SC. Comparison of different comorbidity measures for use with administrative data in predicting short- and long-term mortality. BMC Health Serv Res. 2010;27(10):140. doi:10.1186/1472-6963-10-140
30. Mähönen M, Jula A, Harald K, et al. The validity of heart failure diagnoses obtained from administrative registers. Eur J Prev Cardiol. 2012;20(2):254–259. doi:10.1177/2047487312438979
31. Leppälä JM, Virtamo J, Heinonen OP. Validation of stroke diagnosis in the National Hospital Discharge Register and the Register of Causes of Death in Finland. Eur J Epidemiol. 1999;15(2):155–160. doi:10.1023/a:1007504310431
32. Mähönen M, Salomaa V, Keskimaki I, et al. The feasibility of combining data from routine hospital discharge and causes-of-death registers for epidemiological studies on stroke. Eur J Epidemiol. 2000;16(9):815–817. doi:10.1023/a:1007697720131
33. Mähönen M, Salomaa V, Brommels M, et al. The validity of hospital discharge register data on coronary heart disease in Finland. Eur J Epidemiol. 1997;13(4):403–415. doi:10.1023/a:1007306110822
34. Pajunen P, Koukkunen H, Ketonen M, et al. The validity of the finnish hospital discharge register and causes of death register data on coronary heart disease. Eur J Cardiovasc Prev Rehabil. 2005;12(2):132–137. doi:10.1097/01.hjr.0000140718.09768.ab
35. Tolonen H, Salomaa V, Torppa J, et al. The validation of the finnish hospital discharge register and causes of death register data on stroke diagnoses. Eur J Cardiovasc Prev Rehabil. 2007;14(3):380–385. doi:10.1097/01.hjr.0000239466.26132.f2
36. Solomon A, Ngandu T, Soininen H, Hallikainen MM, Kivipelto M, Laatikainen T. Validity of dementia and Alzheimer’s disease diagnoses in finnish national registers. Alzheimers Dement. 2014;10(3):303–309. doi:10.1016/j.jalz.2013.03.004
37. Rajoitetun korvattavuuden alkamisajat lääkeaineittain [Commencement dates of specially reimbursed drugs]. The Social Insurance Institution of Finland website. [Modified April 4, 2019]. Available from: http://www.kela.fi/laakkeet-ja-laakekorvaukset_rajoitetun-korvattavuuden-alkamisajat.
 © 2019 The Author(s). This work is published and licensed by Dove Medical Press Limited. The
full terms of this license are available at https://www.dovepress.com/terms
and incorporate the Creative Commons Attribution
- Non Commercial (unported, 3.0) License.
By accessing the work you hereby accept the Terms. Non-commercial uses of the work are permitted
without any further permission from Dove Medical Press Limited, provided the work is properly
attributed. For permission for commercial use of this work, please see paragraphs 4.2 and 5 of our Terms.
© 2019 The Author(s). This work is published and licensed by Dove Medical Press Limited. The
full terms of this license are available at https://www.dovepress.com/terms
and incorporate the Creative Commons Attribution
- Non Commercial (unported, 3.0) License.
By accessing the work you hereby accept the Terms. Non-commercial uses of the work are permitted
without any further permission from Dove Medical Press Limited, provided the work is properly
attributed. For permission for commercial use of this work, please see paragraphs 4.2 and 5 of our Terms.