Back to Journals » Patient Related Outcome Measures » Volume 7
Characterizing neuropathic pain profiles: enriching interpretation of painDETECT
Authors Cappelleri J ![]() , Koduru V, Bienen EJ, Sadosky A
, Koduru V, Bienen EJ, Sadosky A
Received 5 December 2015
Accepted for publication 16 March 2016
Published 5 July 2016 Volume 2016:7 Pages 93—99
DOI https://doi.org/10.2147/PROM.S101892
Checked for plagiarism Yes
Review by Single anonymous peer review
Peer reviewer comments 3
Editor who approved publication: Dr Robert Howland
Joseph C Cappelleri,1 Vijaya Koduru,2 E Jay Bienen,3 Alesia Sadosky4
1Pfizer Inc, Groton, CT, USA; 2Eliassen Group, New London, CT, USA; 3Outcomes Research Consultant, New York, NY, USA; 4Pfizer Inc, New York, NY, USA
Purpose: To psychometrically evaluate painDETECT, a patient-reported screening questionnaire for neuropathic pain (NeP), for discriminating among sensory pain symptoms (burning, tingling/prickling, light touching, sudden pain attacks/electric shock-type pain, cold/heat, numbness, and slight pressure).
Methods: The seven-item version of painDETECT provides an overall score that targets only sensory symptoms, while the nine-item version adds responses on two items to the overall score, covering pain course pattern and pain radiation. Both versions have relevance in terms of characterizing broad NeP. The nine- and seven-item versions of painDETECT were administered to subjects with confirmed NeP across six conditions identified during office visits to US community-based physicians. Responses on the sensory symptom items were dichotomized into “at least moderate” (ie, moderate, strongly, very strongly) relative to the combined other responses (never, hardly noticed, slightly). Logistic regression of dichotomized variables on the total painDETECT score provided probabilities of experiencing each symptom across the range of painDETECT scores.
Results: Both painDETECT versions discriminated among the symptoms with similar probabilities across the score ranges. Using these data, the probability of moderately experiencing each pain sensory item was estimated for a particular score, providing a pain profile. Additionally, the likelihood of experiencing each sensation was determined for a discrete increase in score, ie, the odds of at least a moderate sensation of burning (versus less than a moderate sensation) was 1.29 for a 1-point increase, 3.52 for a 5-point increase, and 12.42 for every 10-point increase in the nine-item painDETECT score.
Conclusion: painDETECT differentiates pain profiles across the range of scores such that, for a particular score, the probability of experiencing at least a moderate sensation of each symptom was determined and compared. These results can help characterize NeP symptomatology, enrich interpretation of painDETECT scores, and provide a basis for individualizing NeP management.
Keywords: neuropathic pain, painDETECT, sensory symptoms, pain profile, interpretation, patient-reported outcomes
Introduction
Management of patients with neuropathic pain (NeP) remains challenging despite the development of treatment guidelines1,2 and the availability of several drug classes that have demonstrated efficacy, albeit sometimes variable, for relief of NeP;3 only 30% of patients with NeP respond to approved therapies.4 Part of the challenge may result from the heterogeneity of NeP and the lack of pain profiling,3 since presentation of the sensory pain symptoms vary and patients can be characterized by different symptomatic pain profiles or phenotypes.5–8
Indeed, quantitative sensory testing (QST) has been suggested to be able to identify phenotypic subtypes based on the underlying pathophysiologic mechanisms.9,10 QST is often used for confirmation of a NeP diagnosis, but its use in a real-world clinical setting for identification of phenotypes may be impractical because of the length of time required for administration.
Thus, there remains a need for identifying and understanding these phenotypes, since they not only represent different underlying pathophysiologic mechanisms of NeP6,11 but also appear to result in differential response to treatment,12,13 emphasizing the need for individualized treatment. While the concept of individualized treatment for NeP based on pain profile presentation is not new, it has been gaining support in the clinical literature.3,14,15 Additionally, it has been suggested that NeP clinical trials classify patients based on these sensory phenotypes rather than on the cause of the pain (ie, NeP condition),3 such that a particular treatment could then be evaluated in a population more homogeneous with regard to the underlying pain symptomatology.
Determination of the presence of NeP is critical for making treatment decisions in patients with chronic pain. The recognition that NeP symptom profiles can be distinguished from those of nociceptive pain with regard to both qualitative and spatial characteristics16 provided the basis for development of several screening measures to facilitate differentiation of patients likely to have NeP from those with pain of nociceptive origin.17 The nine-item painDETECT is a validated patient-reported questionnaire that consists of seven pain sensory symptom items, one pain course pattern item, and one pain radiation item.18 painDETECT has a score range from –1 to 38 that is used for classifying pain as NeP (score ≥19), nociceptive (score ≤12), or unclear (scores 13–18). A seven-item version consisting of only the sensory symptoms is also available with a score range from 0 to 35. While both versions are relevant and useful for characterizing broad NeP, the seven-item version only reports on sensory symptoms in the overall score, whereas the nine-item version expands the assessment by contributing responses on pain course pattern and pain radiation to the overall score.
Psychometric evaluation has shown that painDETECT can identify NeP across a range of conditions19 and can also distinguish among mild, moderate, and severe levels of average pain20 as well as map the relationship between NeP and health status.21 It has also been shown previously that discrete subgroups of NeP patients can be identified who are characterized by specific symptom clusters as assessed based on the painDETECT sensory symptoms.10 However, the ability of painDETECT to differentiate among these sensory symptoms has not been explored. Therefore, the purpose of this analysis was to further expand on the measurement properties of painDETECT by psychometrically evaluating its ability to discriminate among the seven pain sensory symptoms and, in doing so, enriching the interpretation of what painDETECT scores represent. Such discrimination and interpretation may enhance phenotype profiling based on total score, which can be used for individualizing NeP management.
Methods
Adults (≥18 years old) with confirmed NeP across six conditions were identified during office visits at 33 community-based physician practices across the US between September 2011 and June 2012 as part of a study on the patient-reported burden of NeP.22 The NeP conditions included painful diabetic peripheral neuropathy, human immunodeficiency virus-related peripheral NeP, post-trauma/postsurgical NeP, spinal cord injury-related NeP, chronic low back pain with NeP, and small fiber neuropathy. Subjects were also required to have had the diagnosis for at least 6 months prior to enrollment, be managed by the physician’s practice for at least 6 months, and experienced NeP symptoms for at least 3 months prior to enrollment. The study was approved by a central institutional review board (Concordia Clinical Research, Cedar Knolls, NJ, USA), and all data collection and analysis were compliant with the Health Insurance Portability and Accountability Act. All participants provided written informed consent.
Subjects who agreed to participate in the burden of illness study were administered a battery of questionnaires that included painDETECT, which was not used as a screening instrument since all subjects were required to have a physician-confirmed NeP diagnosis. painDETECT rates the presence of the seven sensory symptom items (burning, tingling/prickling, light touching, sudden pain attacks/electric shock-type pain, cold/heat, numbness, and slight pressure) on a Likert-type scale from “never” to “very strongly”. For the current analysis, the responses were dichotomized into “at least moderate” (ie, moderate, strongly, and very strongly), which is an unfavorable outcome, relative to the combined other responses (never, hardly noticed, slightly) that can be considered more favorable outcomes. This binary response was then regressed on the total painDETECT score using logistic regression to provide probabilities of at least moderately experiencing each symptom across the range of painDETECT scores.
The regression was intended to enable characterization of the symptom profiles that can be expected at different painDETECT scores, providing a map of associations among the symptoms and a narrative understanding of how painDETECT scores relate to their constituent sensory symptoms. Additionally, odds ratios (ORs) and their 95% confidence intervals (95% CIs) for experiencing at least a moderate sensation were determined for discrete increases in painDETECT score.
All analyses were performed using SAS version 9.2 (SAS Institute Inc., Cary, NC, USA).
Results
A total of 624 subjects were enrolled in the study and, as previously reported,22 subjects were primarily White (71.8%), with a slightly higher proportion of males (55.4%), and a mean (standard deviation) age of 55.5 (13.7) years (Table 1). painDETECT scores were available for 606 of these subjects, and no differences were noted between those who completed painDETECT and those who did not.
 | Table 1 Demographic and clinical characteristics Note: apainDETECT scores were available for 606 subjects for the nine-item version and 615 subjects for the seven-item version. Abbreviations: SD, standard deviation; NeP, neuropathic pain. |
The ability to discriminate among the sensory pain symptoms was observed on the nine-item (Figure 1) and seven-item (Figure 2) painDETECT, and the probabilities of experiencing at least a moderate sensation for each of the sensory items were generally similar on the two versions. For each version, clusters of symptoms with similar probabilities of at least a moderate sensation were observed (Figures 1 and 2). In one cluster, light touching and cold/heat appeared to jointly have a lower such probability across the score range than the other symptoms. The cluster of burning, numbness, and tingling/prickling generally had the highest probabilities of a tangible sensation. There was also a distinct mutual separation of pain attacks and slight pressure as well as separation of these from the other symptoms, with the latter showing the greatest separation relative to the other symptoms.
 | Figure 1 Probability of experiencing at least a moderate sensation by painDETECT score on the nine-item version. |
 | Figure 2 Probability of experiencing at least a moderate sensation by painDETECT score on the seven-item version. |
From the curves, NeP symptom profiles can be characterized based on the likelihood (probability) of experiencing at least a moderate sensation on each pain sensory item for a particular score on both the nine-item version and the seven-item version of painDETECT (Table 2). The pain symptom profile for a nine-item painDETECT score of 10 shows that the likelihood of experiencing at least a moderate sensation was 34.5% for burning, 32.5% numbness, 26.3% for tingling/prickling, 21.3% pain attacks, 12.4% slight pressure, 2.4% light touching, and 1.9% cold/heat (Table 2). Similarly, for a nine-item painDETECT score of 20, the likelihood of experiencing at least a moderate sensation was 87.2% for tingling/prickling, 83.8% burning, 79.0% numbness, 73.0% pain attacks, 54.6% slight pressure, 28.4% light touching, and 24.3% cold/heat.
 | Table 2 Pain symptom probability profiles for painDETECT total score by five-point intervals |
As shown in Table 3, the odds of experiencing a tangible sensation (at least moderate) can also be estimated for total painDETECT score increases of 1, 5, and 10 points. For instance, the OR for a burning sensation was 1.29 (95% CI 1.23, 1.35) for any 1-point increase on the seven-item painDETECT (eg, from 2 to 3 or from 26 to 27), indicating that the odds of experiencing at least a moderate sensation of burning is 1.29 times as likely for every 1-point increase in the total score, with corresponding increases of 3.52 for any 5-point increase (eg, 15 to 20 or 23 to 28) and 12.42 for any 10-point increase (10 to 20 or 14 to 24).
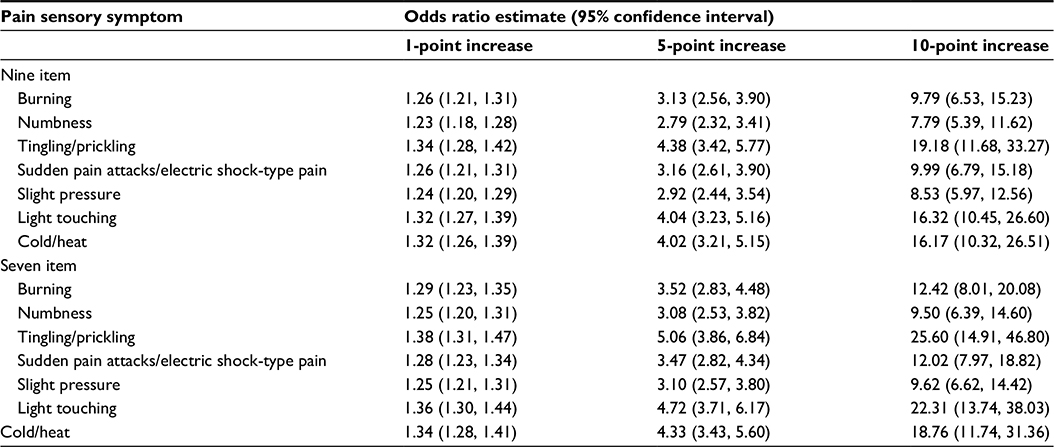 | Table 3 Odds ratios of experiencing at least a moderate sensation for increases in painDETECT score |
Discussion
painDETECT, which was originally developed as a screening measure for NeP, has been shown to have application for the broader characterization of NeP.19–21 This analysis further enriches the interpretation of painDETECT scores by using a content-based approach to map the total painDETECT scores to the probability of the presence of each of the sensory pain symptoms. Using a content-based approach, which incorporates the individual items along with their response categories internal to the measure itself, provides an understanding of the meaning of different scores on the measure.23 The results of this content-based interpretation not only indicate that painDETECT adequately differentiates among the seven sensory symptoms but it can also describe symptom profiles across the range of scores on both the nine-item and seven-item versions. Furthermore, calculated ORs predict the likelihood of the presence of tangible individual symptoms for increases in scores such as 1, 5, and 10 points.
The ability of painDETECT to characterize sensory symptom profiles supports previous studies that also suggested differentiation among phenotypes using the painDETECT sensory symptoms for identifying patient subgroups according to the presence of symptom clusters.5,10,24 While those clusters appeared to be generally consistent across the NeP conditions, cluster frequency varied based on the NeP condition. Similarly, both the identification of symptom clusters and differences in cluster frequency across conditions have been described using another NeP questionnaire (the Neuropathic Pain Symptom Inventory25).7
In contrast to those studies, which used cluster analysis to identify patterns of questionnaire scores to describe the subgroups, the current analysis provides probabilistic estimates regarding the likelihood of the individual sensory symptoms across the range of painDETECT scores, enabling characterization of the sensory profile for individual patients using a single metric and thereby enhancing interpretation of painDETECT scores. The practical advantage of this is that it represents a relatively quick and easy method that can be used in the clinical setting to determine a profile for facilitating individualized management strategies.
Clusters were also observed in the current analysis based on symptoms that appeared to map with similar probabilities across the score range. Although a sensory symptom may potentially arise from different pathways,11 the clustering likely reflects, at least in part, the type of mechanism generating the pain. For example, the clusters of light touching and cold/heat, which only have a >50% probability at scores >23, are both considered stimulus-evoked positive sensory symptoms. Likewise, burning and tingling/prickling, which are among the most characteristic sensory symptoms experienced by patients with NeP, are both spontaneous sensory symptoms. These two symptoms had a >50% probability at lower (ie, more favorable) painDETECT scores than any of the other symptoms except numbness, which is a stimulus-evoked negative sensory symptom that clustered with burning and tingling/prickling.
Limitations
Limitations of this study include potential selection bias since the results were based on questionnaires as part of a burden-of-illness survey, and subjects who agreed to participate may have had characteristics that would have resulted in different responses relative to those who declined participation. The impact of selection bias, however, is expected to be minimal, since 606 subjects of 624 sampled (97.1%) completed the painDETECT questionnaire. This analysis could also be criticized for using a heterogeneous NeP population consisting of six different conditions that may have different frequencies of the sensory profiles. Nevertheless, painDETECT has been shown to be a psychometrically valid measure across NeP conditions,19 and it is also likely that differences in symptom profiles are clinically more relevant than the conditions resulting in the NeP.6,7 Furthermore, the purpose of this analysis was to determine the ability of painDETECT to discriminate among the sensory symptoms regardless of the etiology, and to provide interpretation of individual painDETECT scores across a broad range of scores and NeP conditions.
Conclusion
This analysis expands the ability of painDETECT to characterize NeP by mapping and interpreting the total score to the probability of at least a moderate chance of experiencing a tangible sensation for each of the seven sensory symptom components of painDETECT. Both the nine-item and seven-item versions of painDETECT can be used to determine and compare the symptom profiles as well as to estimate the odds of experiencing tangible symptoms over discrete increases in painDETECT scores. These profiles provide a starting point for individualizing NeP management based on the sensory symptoms that may be expected to be present for a particular painDETECT score. Additionally, this ability to distinguish symptom profiles, when combined with the other properties of painDETECT, suggests that this measure enables a broad characterization of NeP.
Disclosure
This study was funded by Pfizer Inc. Joseph C Cappelleri and Alesia Sadosky are employees and stockholders of Pfizer; Vijaya Koduru is an employee of the Eliassen Group, who was a paid consultant to Pfizer; E Jay Bienen is an independent scientific consultant who was funded by Pfizer for manuscript development. A portion of the study results has been previously presented as a poster presentation at PAINWeek, September 8–12, 2015, Las Vegas, Nevada (abstract published as Cappelleri JC et al. Characterizing neuropathic pain profiles: enriching interpretation of painDETECT. Postgrad Med. 2015;127(Suppl):S81–S82). The authors report no other conflicts of interest in this work.
References
Dworkin RH, O’Connor AB, Audette J, et al. Recommendations for the pharmacological management of neuropathic pain: an overview and literature update. Mayo Clin Proc. 2010;85(3 Suppl):S3–S14. | ||
Attal N, Cruccu G, Haanpää M, et al. EFNS guidelines on pharmacological treatment of neuropathic pain. Eur J Neurol. 2006;13(11):1153–1169. | ||
Finnerup NB, Attal N, Haroutounian S, et al. Pharmacotherapy for neuropathic pain in adults: a systematic review and meta-analysis. Lancet Neurol. 2015;14(2):162–173. | ||
Finnerup NB, Sindrup SH, Jensen TS. The evidence for pharmacological treatment of neuropathic pain. Pain. 2010;150(3):573–581. | ||
Baron R, Tölle TR, Gockel U, Brosz M, Freynhagen R. A cross-sectional cohort survey in 2100 patients with painful diabetic neuropathy and postherpetic neuralgia: differences in demographic data and sensory symptoms. Pain. 2009;146(1–2):34–40. | ||
Baron R, Förster M, Binder A. Subgrouping of patients with neuropathic pain according to pain-related sensory abnormalities: a first step to a stratified treatment approach. Lancet Neurol. 2012;11(11):999–1005. | ||
Freeman R, Baron R, Bouhassira D, Cabrera J, Emir B. Sensory profiles of patients with neuropathic pain based on the neuropathic pain symptoms and signs. Pain. 2014;155(2):367–376. | ||
Bouhassira D, Wilhelm S, Schacht A, et al. Neuropathic pain phenotyping as a predictor of treatment response in painful diabetic neuropathy: data from the randomized, double-blind, COMBO-DN study. Pain. 2014;155(10):2171–2179. | ||
Rolke R, Baron R, Maier C, et al. Quantitative sensory testing in the German Research Network on Neuropathic Pain (DFNS): standardized protocol and reference values. Pain. 2006;123(3):231–243. | ||
Arning K, Baron R. Evaluation of symptom heterogeneity in neuropathic pain using assessments of sensory functions. Neurotherapeutics. 2009;6(4):738–748. | ||
von Hehn CA, Baron R, Woolf CJ. Deconstructing the neuropathic pain phenotype to reveal neural mechanisms. Neuron. 2012;73(4):638–652. | ||
Gilron I, Tu D, Holden RR. Sensory and affective pain descriptors respond differentially to pharmacological interventions in neuropathic conditions. Clin J Pain. 2013;29(2):124–131. | ||
Demant DT, Lund K, Vollert J, et al. The effect of oxcarbazepine in peripheral neuropathic pain depends on pain phenotype: a randomised, double-blind, placebo-controlled phenotype-stratified study. Pain. 2014;155(11):2263–2273. | ||
Reimer M, Helfert SM, Baron R. Phenotyping neuropathic pain patients: implications for individual therapy and clinical trials. Curr Opin Support Palliat Care. 2014;8(2):124–129. | ||
Helfert SM, Reimer M, Höper J, Baron R. Individualized pharmacological treatment of neuropathic pain. Clin Pharmacol Ther. 2015;97(2):135–142. | ||
Dworkin RH, Jensen MP, Gammaitoni AR, Olaleye DO, Galer BS. Symptom profiles differ in patients with neuropathic versus non-neuropathic pain. J Pain. 2007;8(2):118–126. | ||
Bennett MI, Attal N, Backonja MM, et al. Using screening tools to identify neuropathic pain. Pain. 2007;127(3):199–203. | ||
Freynhagen R, Baron R, Gockel U, Tölle TR. painDETECT: a new screening questionnaire to identify neuropathic components in patients with back pain. Curr Med Res Opin. 2006;22(10):1911–1920. | ||
Cappelleri JC, Koduru V, Bienen EJ, Sadosky A. A cross-sectional study examining the psychometric properties of the painDETECT measure in neuropathic pain. J Pain Res. 2015;8:159–167. | ||
Cappelleri JC, Bienen EJ, Koduru V, Sadosky A. Measurement properties of painDETECT by average pain severity. Clinicoecon Outcomes Res. 2014;6:497–504. | ||
Cappelleri JC, Koduru V, Bienen EJ, Sadosky A. Mapping painDETECT Classifications to EuroQol Health Status. Presented at American Academy of Pain Management Annual Clinical Meeting; September 18–21, 2014; Phoenix, AZ. | ||
Schaefer C, Mann R, Sadosky A, et al. Burden of illness associated with peripheral and central neuropathic pain among adults seeking treatment in the United States: a patient-centered evaluation. Pain Med. 2014;15(12):2105–2119. | ||
Cappelleri JC, Bushmakin AG. Interpretation of patient-reported outcomes. Stat Methods Med Res. 2014;23(5):460–483. | ||
Mahn F, Hullemann P, Gockel U, et al. Sensory symptom profiles and co-morbidities in painful radiculopathy. PLoS One. 2011;6(5):e18018. | ||
Bouhassira D, Attal N, Fermanian J, et al. Development and validation of the Neuropathic Pain Symptom Inventory. Pain. 2004;108(3):248–257. |
 © 2016 The Author(s). This work is published and licensed by Dove Medical Press Limited. The
full terms of this license are available at https://www.dovepress.com/terms
and incorporate the Creative Commons Attribution
- Non Commercial (unported, 3.0) License.
By accessing the work you hereby accept the Terms. Non-commercial uses of the work are permitted
without any further permission from Dove Medical Press Limited, provided the work is properly
attributed. For permission for commercial use of this work, please see paragraphs 4.2 and 5 of our Terms.
© 2016 The Author(s). This work is published and licensed by Dove Medical Press Limited. The
full terms of this license are available at https://www.dovepress.com/terms
and incorporate the Creative Commons Attribution
- Non Commercial (unported, 3.0) License.
By accessing the work you hereby accept the Terms. Non-commercial uses of the work are permitted
without any further permission from Dove Medical Press Limited, provided the work is properly
attributed. For permission for commercial use of this work, please see paragraphs 4.2 and 5 of our Terms.