
Back to Journals » Journal of Inflammation Research » Volume 19
Characterization and Clinical Diagnostic Potential of IHRDEGs in Renal Interstitial Fibrosis: An Integrative Data Analysis and Model Construction Study
Authors Zhang J, Dang X, Dai E
Received 18 July 2025
Accepted for publication 27 April 2026
Published 23 May 2026 Volume 2026:19 551642
DOI https://doi.org/10.2147/JIR.S551642
Checked for plagiarism Yes
Review by Single anonymous peer review
Peer reviewer comments 2
Editor who approved publication: Dr Wenjian Li
Jie Zhang,1,2 Xinyu Dang,1 Enlai Dai1
1School of Traditional Chinese and Western Medicine, Gansu University of Chinese Medicine, Lanzhou, Gansu, 730000, People’s Republic of China; 2Department of Nephrology, Affiliated Hospital of Gansu University of Chinese Medicine, Lanzhou, Gansu, 730020, People’s Republic of China
Correspondence: Enlai Dai, School of Traditional Chinese and Western Medicine, Gansu University of Chinese Medicine, 35 Dingxi Road, Chengguan District, Lanzhou, Gansu Province, 730000, People’s Republic of China, Email [email protected]
Purpose: Renal interstitial fibrosis (RIF) is a critical pathological process in the progression of chronic kidney disease (CKD). This study aimed to identify and validate inflammation- and hypoxia-related differentially expressed genes (IHRDEGs) associated with RIF and to construct a robust diagnostic model with potential clinical applications.
Patients and Methods: Three public GEO datasets (GSE22459, GSE76882, GSE53605) comprising 76 RIF and 142 control samples were integrated following batch correction and normalization. Differentially expressed IHRDEGs were screened and analyzed using GO and KEGG pathway enrichment. A diagnostic model was constructed using logistic regression and optimized through SVM and LASSO algorithms. Immune infiltration was evaluated using ssGSEA, and consensus clustering was used to define molecular subtypes. Experimental validation was conducted in a rat model of RIF using RT-qPCR, Western blotting, and immunohistochemistry.
Results: A total of five hub IHRDEGs (EDN1, HLA-G, MYC, HIF1A, and TLR2) were identified and incorporated into a diagnostic model that demonstrated strong predictive ability (AUC 0.7– 0.9; sensitivity and specificity > 70– 90%). These genes were significantly correlated with immune cell infiltration patterns. Subtype analysis revealed two distinct molecular clusters of RIF with different immunopathological features. Co-expression and regulatory interaction analyses further elucidated the involvement of hub genes in fibrotic mechanisms. Experimental validation confirmed the upregulation of hub genes at both mRNA and protein levels in the RIF model.
Conclusion: This study uncovers the diagnostic and mechanistic significance of inflammation- and hypoxia-related genes in RIF. The five identified hub genes may serve as promising biomarkers and therapeutic targets. These findings provide novel insights into the immune-hypoxia interplay in renal fibrosis and offer a potential framework for early diagnosis and targeted treatment of CKD-related fibrosis.
Keywords: hypoxia signaling, immune cell infiltration, bioinformatics analysis, biomarker discovery, machine learning model, fibrotic progression
Introduction
Renal interstitial fibrosis (RIF) is the final common pathway in chronic kidney disease (CKD) progression to end-stage renal disease (ESRD), affecting millions worldwide and incurs substantial economic costs due to increased healthcare utilization and productivity loss. Early diagnosis remains challenging because conventional markers such as serum creatinine and estimated glomerular filtration rate (eGFR) only rise after substantial, often irreversible structural damage has occurred.1 To date, no approved antifibrotic therapies currently exist for RIF, underscoring an urgent need for novel diagnostic and therapeutic targets.2
The progression of RIF is primarily driven by activation and accumulation of myofibroblasts, the principal cells responsible for excessive extracellular matrix (ECM) deposition, including collagen and fibronectin. Transforming growth factor-β (TGF-β) plays a central role by promoting myofibroblast differentiation and ECM deposition,2,3 with contributions from other cytokines, such as connective tissue growth factor (CTGF) and platelet-derived growth factor (PDGF).4,5 Increasing evidence shows that tissue hypoxia and sustained inflammation critically amplify this process. Under hypoxic conditions, expression of HIF-1α and HIF-2α is elevated, modulating fibrosis-related genes like TGFβ, matrix metalloproteinases (MMPs), and fibronectin.6–8 Concurrently, hypoxia-induced NF-κB activation exacerbates inflammation and fibrosis by promoting transcription of pro-inflammatory cytokines such as TNFα and IL6.9,10 Transcriptomic studies have identified key inflammation- and hypoxia-related genes (IHRGs) in RIF, including HIF1A, TLR2, and EDN1, which are significantly upregulated in fibrotic kidneys and are involved in immune activation, ECM remodeling, and vascular dysfunction.11
Despite recognition of individual inflammation- and hypoxia-related genes (IHRGs) in RIF, the integrated regulatory networks and diagnostic potential remain poorly defined. This research aims to profile the differential expression patterns of IHRGs in RIF and to construct a gene signature-based diagnostic model. Using three GEO datasets, 83 IHRGs were identified. Differential expression and functional enrichment analyses were performed, followed by the development of a diagnostic model incorporating logistic regression, support vector machine (SVM), and LASSO algorithms. Receiver operating characteristic (ROC) analysis was used to validate model performance. Immune infiltration analysis was also conducted to characterize immune cell composition in RIF, and key model genes were validated through in vivo experiments. This comprehensive investigation not only elucidates the molecular landscape of IHRGs in RIF but also proposes potential diagnostic markers and therapeutic targets with strong clinical relevance.
Several previous transcriptomic studies have explored diagnostic or prognostic biomarkers for RIF, but did not specifically target inflammation–hypoxia interplay. To our knowledge, the present study is the first to systematically integrate a curated set of 83 IHRGs as an a priori candidate list across three independent human RIF cohorts after rigorous batch correction (GEO datasets). Using logistic regression, SVM, and LASSO algorithms, we derived a concise five-gene signature (EDN1, HLA-G, MYC, HIF1A, TLR2) that achieves AUC consistently 0.7–0.9. All five hub genes were further validated at both mRNA and protein levels in the classic UUO rat model. While a limitation is the use of microarray rather than RNA-seq platforms, the inclusion of a number of samples, and stringent batch-effect removal, combined with independent experimental confirmation via RT-qPCR and immunohistochemistry, ensure the robustness and clinical translational potential of our inflammation–hypoxia-integrated findings for RIF.
Materials and Methods
Data Acquisition and Processing
RIF datasets were acquired from GEO (https://www.ncbi.nlm.nih.gov/geo/) using R GEOquery (v2.70.0)12 study incorporated three publicly available datasets:13 GSE22459, GSE76882, GSE5360514–17 all derived from Homo sapiens renal tissue (Table 1). GSE22459, based on the GPL570 platform, contained 24 RIF samples, 25 control samples, and 16 additional samples. GSE76882, derived from the GPL13158 platform, included 42 RIF samples, 99 control samples, and 133 additional samples, while GSE53605, utilizing the GPL571 platform, comprised 10 RIF samples, 18 control samples, and 27 additional samples. For this study, only RIF and control samples were selected for further analysis.
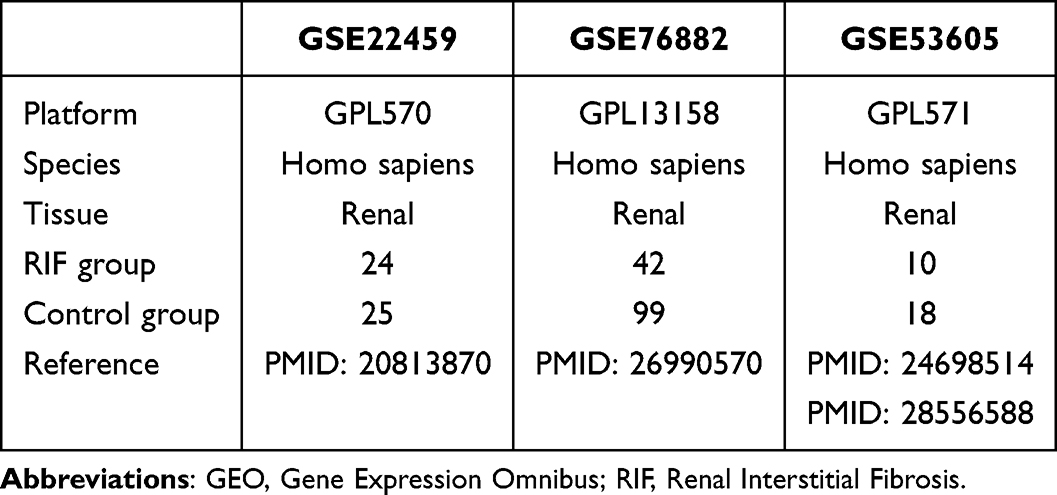 |
Table 1 GEO Microarray Chip Information |
To systematically identify inflammation- and hypoxia-related genes (IHRGs), we employed a hybrid strategy combining retrieval from both GeneCards (https://www.genecards.org/)18 and manual curation from PubMed-indexed literature to ensure comprehensive coverage of established pathway genes. Inflammation-related genes (IRGs) were obtained by searching GeneCards with the term “Inflammatory”,19 retaining only protein-coding genes with a Relevance Score > 8, leading to 377 IRGs. To complement this list, a 200 IRGs were manually curated from PubMed literature20 and key studies on inflammatory pathways in kidney disease and fibrosis. After merging and deduplication using official HGNC symbols, a total of 525 unique IRGs after deduplication were obtained (Box S1). Similarly, hypoxia-related genes (HRGs) were identified by searching GeneCards using the term “Hypoxia”, filtering for protein-coding genes with a Relevance Score > 4, yielding 239 HRGs. Another 397 HRGs were curated from PubMed literature, resulting in 623 unique HRGs following deduplication (Box S2). By integrating IRGs and HRGs, 83 IHRGs were identified, representing potential molecular regulators in RIF pathogenesis (Box S3).
To ensure optimal data quality and comparability across platforms, each dataset was first processed individually using the limma package (v3.58.1) for background correction and quantile normalization (normalizeBetweenArrays function). This step was performed on the raw or platform-specific intensity values to achieve within-dataset consistency. Subsequently, the normalized expression matrices from the three datasets were merged based on shared Entrez Gene IDs (see below for details). Batch effects across datasets were then removed using the ComBat function in the sva package (v3.50.0), which is robust for log-transformed microarray data and effectively adjusts for mean and variance differences between batches. This sequential approach—individual normalization followed by cross-dataset batch correction—aligns with recommended practices for multi-platform microarray integration and minimizes potential artifacts.
The three microarray platforms (GPL570 [HG-U133 Plus 2.0], GPL13158 [HG-U133A 2.0], and GPL571 [HG-U133A]) are all from the Affymetrix Human Genome U133 series with substantial probe overlap. Probe annotation was performed using the latest platform-specific annotation files provided by GEO (annotGPL = TRUE in GEOquery). Probes were mapped to Entrez Gene IDs, and only genes with corresponding probes present on all three platforms were retained for downstream analysis (intersection based on Entrez Gene IDs). For genes with multiple probes, the average expression value was calculated. This conservative gene-matching strategy ensured cross-platform comparability at the gene level and reduced technical variability.
To address batch effects across datasets, R sva (v3.50.0)21 was employed, yielding a unified dataset of 76 RIF cases and 142 controls. The data were subsequently standardized and normalized using the limma package (v3.58.1),22 in order to ensure consistency across different microarray platforms. Annotation probes were processed accordingly. To evaluate the efficiency of batch effect correction, Principal Component Analysis (PCA)23 was applied to gene expression matrices before and after adjustment. As a widely utilized dimensionality reduction technique, PCA identifies principal components from high-dimensional data, facilitating visualization in 2D and 3D space. This analysis verified that batch-associated variability was minimized, thereby enhancing the robustness and reliability of downstream analyses.
Identification of IHRDEGs in Renal Interstitial Fibrosis
According to the sample classification in the combined GEO dataset, specimens were assigned to the RIF and control groups. Differential gene expression analysis between these groups was performed using R limma (v3.58.1). The criteria for identifying DEGs were set as |logFC|>0.5 and adjusted P<0.05, with Benjamini-Hochberg (BH) correction applied to control for false discovery rates. Genes with logFC>0.5 and adj. P<0.05 were classified as upregulated genes, while those with logFC<-0.5 and adj. P<0.05 were categorized as downregulated genes. The results of differential expression analysis were visualized using volcano plots generated with R ggplot2 (v3.4.4).
To identify IHRDEGs related to RIF, DEGs from the combined dataset (|logFC|>0.5, adj. P<0.05) were intersected with previously identified IHRGs, which provided insights into well-characterized inflammation- and hypoxia-related pathways. These overlapping genes, designated as IHRDEGs, were visualized using Venn diagrams. To ensure the identification of novel fibrosis-related genes, we also performed an unbiased DEG analysis to explore genes that might not be captured by the pre-defined IHRG list. Heatmaps displaying IHRDEG expression patterns were determined using R pheatmap (v1.0.12), while chromosomal localization of IHRDEGs was mapped using R RCircos (v1.2.2).24
Enrichment Analyses
GO assessment serves as a fundamental tool for large-scale functional enrichment investigations, classifying genes into three major groups: Biological Process (BP), Cellular Component (CC), and Molecular Function (MF).25 KEGG presents a thorough overview on genomic functions, biological pathways, diseases, and drug interactions. To investigate the functional roles of IHRGs, GO and KEGG enrichment analyses were performed using R clusterProfiler (v4.10.0).26,27 A significance threshold of P<0.05 and an FDR (q-value)<0.25 was applied, with BH correction to account for multiple testing. In addition, future studies may incorporate other complementary approaches, such as weighted gene co-expression network analysis (WGCNA), to further explore gene modules and their functional relevance in RIF progression.
GSEA
GSEA is a computational approach utilized to examine the distribution pattern of genes within a predefined gene set in a ranked gene list, thereby determining their overall contribution to a given phenotype.28 Genes from the integrated GEO dataset were initially ordered according to their logFC values, followed by GSEA using R clusterProfiler (v4.10.0).29 The GSEA parameters were set as follows: seed=2020, number of permutations=1000, minimum gene set size=10, and maximum gene set size=500. Gene sets were sourced from the MSigDB, especially the C2: Canonical Pathways (c2.cp.all.v2022.1.Hs.symbols.gmt), which contains 3050 pathway-associated gene sets. Enrichment results were filtered based on adjusted P<0.05 and FDR (q-value)<0.25, with BH correction applied to account for multiple comparisons.
Establishment of a Diagnostic Model for Renal Interstitial Fibrosis
To establish a diagnostic model for RIF based on the integrated GEO dataset, logistic regression analysis was performed to identify IHRDEGs. When the dependent variable was binary (RIF vs. control samples), logistic regression was used to assess the association between independent variables (gene expression levels) and RIF status. Genes with P < 0.05 were deemed statistically significant and incorporated into the logistic regression model. The expression levels of IHRDEGs included in the model were visualized using a forest plot. Subsequently, SVM analysis was applied using the IHRDEGs identified in the logistic regression model to develop an SVM-based diagnostic model.30 Genes were selected based on their highest classification accuracy and lowest error rate, in order to ensure optimal model performance. Finally, LASSO regression was carried out using R glmnet (v4.1–8), with set.seed(600) and family=“binomial” as parameters. LASSO regression, a regularized linear regression approach, applies a penalty term (λ × absolute value of regression coefficients) to minimize overfitting and enhance the model’s generalization ability.31 The outcomes of LASSO regression were illustrated through a diagnostic model plot and a variable coefficient trajectory plot. Cross-validation and reproducibility measures were implemented to ensure model robustness. For LASSO regression, 10-fold cross-validation was used for optimal lambda selection (default setting in the glmnet package). Random seed was set using set.seed(600) prior to LASSO and propagated consistently across related analyses such as SVM feature selection and resampling steps. The final RIF diagnostic model was established, with the IHRDEGs retained in LASSO regression designated as model genes. To quantify individual patient risk, a LASSO-derived risk score (RiskScore) was calculated by applying the risk coefficients obtained from the LASSO model, with the risk score computed as follows:

Verification of the Diagnostic Model for Renal Interstitial Fibrosis
To assess the performance of the RIF diagnostic model, ROC curve analysis was conducted using R pROC (v1.18.5).32 The AUC was calculated to evaluate the diagnostic efficacy of the risk score (RiskScore) in predicting RIF occurrence. AUC values vary between 0.5 and 1.0, where values approaching 1.0 signify enhanced diagnostic accuracy. AUC values (0.5–0.7) suggest low accuracy, 0.7 to 0.9 indicate moderate accuracy, and values above 0.9 denote high diagnostic precision.
A nomogram was constructed using R rms (v6.7–1) to visualize the functional relationship between model genes and RIF risk.33 A nomogram is a graphical tool that represents predictive relationships among multiple independent variables within a coordinate system are represented using a series of non-overlapping line segments.
To further examine the calibration and predictive reliability of the model, a calibration curve was generated based on LASSO regression. Additionally, DCA was carried out using R ggDCA (v1.1) to evaluate the clinical utility of the model. DCA is a statistical approach utilized to examine the net clinical benefit of prognostic models, diagnostic evaluations, and molecular biomarkers by analyzing their impact across different probability thresholds.34
Differential Expression Validation and ROC Curve Analysis
To further assess the expression differences of IHRDEGs between the RIF and control groups in the integrated GEO dataset, group comparison plots were generated according to IHRDEG expression levels. Subsequently, ROC curve analysis was performed utilizing R pROC (v1.18.5) to examine the diagnostic performance of IHRDEG expression in predicting RIF occurrence. The AUC values were calculated, varying between 0.5 and 1.0, where a higher AUC indicates superior diagnostic accuracy. AUC values of 0.5–0.7 denote low diagnostic accuracy, 0.7–0.9 signify moderate accuracy, and values >0.9 represent high diagnostic performance.
To further assess the prognostic significance of model genes, RIF samples from the combined GEO dataset were stratified into HighRisk and LowRisk groups in accordance with the median RiskScore derived from the RIF diagnostic model. The expression levels of model genes were compared between these two groups using group comparison plots. Finally, ROC curve analysis was performed using pROC (v1.18.5) to determine the AUC values for model genes, assessing their diagnostic effectiveness in distinguishing HighRisk and LowRisk RIF samples.
Construction of Renal Interstitial Fibrosis Subtypes
Consensus clustering is a resampling-based algorithm that identifies distinct subgroups within a dataset while evaluating the stability and robustness of clustering assignments.35 By iteratively resampling subsamples, this method introduces sampling variability, allowing for a comprehensive assessment of cluster stability and parameter selection. To classify RIF subtypes, consensus clustering was performed using the ConsensusClusterPlus approach implemented in R ConsensusClusterPlus,36 according to the expression profiles of model genes in the combined GEO dataset. The number of clusters was defined within the range of 2 to 9, and 80% of the overall sample cohort randomly sampled 50 times, with cluster algorithm (clusterAlg) = “km” (k-means clustering) and distance metric = “Spearman” correlation. Following clustering, the expression patterns of model genes across RIF subtypes were visualized using heatmaps. Differential expression analysis between subtypes was conducted using R limma (v3.58.1), and volcano plots were generated using ggplot2 (v3.4.4) to illustrate significantly DEGs, with criteria set at |logFC|>0.5 and adjusted P<0.05. The BH correction was applied to control for multiple testing. Additionally, group comparison plots were employed to further validate the expression differences of model genes across RIF subtypes.
Immune Infiltration Analysis
Single-Sample GSEA (ssGSEA) is a computational method used to measure the relative abundance of infiltrating immune cells in individual samples.37 Immune cell subtypes, including activated dendritic cells, activated CD8+ T cells, gamma delta T cells, natural killer cells, and regulatory T cells, were annotated. The enrichment scores obtained from ssGSEA were utilized to estimate the relative proportions of immune cell infiltrates, resulting in an immune infiltration matrix for RIF specimens derived from the integrated GEO dataset.
To evaluate variations in immune cell infiltration (ICI) between LowRisk and HighRisk groups, group comparison plots were generated using R ggplot2 (v3.4.4). Immune cell populations displaying statistically significant differences between the two groups were selected for further analysis. In addition, Spearman correlation analysis was conducted to evaluate relationships among immune cell types, and the results were visualized as a correlation heatmap using R pheatmap. The correlation between model gene expression and immune cell abundance was also analyzed using Spearman correlation, and the results were represented as a correlation bubble plot using ggplot2 (v3.4.4).
Moreover, ssGSEA enrichment scores were utilized to evaluate ICI patterns in various RIF subtypes (Cluster1 and Cluster2). Group comparison plots were generated using ggplot2 to illustrate variations in immune cell expression between the two subtypes. Immune cells exhibiting significant differential abundance were identified for subsequent analysis. The correlation between immune cells was assessed using the Spearman algorithm, with results visualized in a correlation heatmap via pheatmap. Furthermore, the relationships between model genes and ICI were analyzed, and the findings were visualized using a correlation bubble plot constructed via ggplot2 (v3.4.4).
PPI Network
The PPI network can be used to determine the functional relationships among proteins, governing gene expression, biological signaling, metabolic pathways, and cell cycle control. Systematic analysis of PPI networks is essential for elucidating protein functions within biological systems, deciphering the mechanisms of signal transduction and metabolic regulation under pathological conditions, and identifying potential therapeutic targets. To construct the PPI network, GeneMANIA (https://genemania.org/) was employed to estimate functionally similar genes, analyze gene interactions, and prioritize candidates for functional characterization. GeneMANIA integrates genomic and proteomic datasets to identify genes with shared functions, weighting each dataset based on its predictive relevance to the query.38 By integrating functional genomic datasets, GeneMANIA assigns weighted predictions to query genes, facilitating gene function prediction based on established interactions.
Construction of the Regulatory Network
Transcription factors (TFs) play a critical role in gene expression regulation by binding to specific promoter or enhancer regions of model genes at the post-transcriptional level. To investigate the TF-gene regulatory interactions, ChIPBase (http://rna.sysu.edu.cn/chipbase/) was utilized to identify TFs associated with model genes.39 The resulting mRNA-TF regulatory network was constructed and visualized through Cytoscape.40
In addition, microRNAs (miRNAs) serve as key regulators in biological development and evolutionary processes, modulating multiple target genes, while individual genes can be affected by several miRNAs. To explore the interactions between miRNAs and model genes, data were retrieved from StarBase v3.0. (https://starbase.sysu.edu.cn/).41 The mRNA-miRNA regulatory network was then established and graphically represented using Cytoscape, providing insights into the post-transcriptional regulatory mechanisms governing RIF pathogenesis.
In vivo Experimental Methods
Unilateral Ureteral Obstruction (UUO) Model
Sprague-Dawley (SD) rats were anesthetized via isoflurane inhalation, then placed in a supine position and securely fixed on the operating table. The abdominal fur was shaved, and the exposed skin was disinfected with iodine solution. A 1-cm midline incision was made on the left abdomen, followed by isolation of the left ureter. Ligations were performed at the upper and lower one-third segments of the ureter, and the ureter was transected between the two ligatures. The kidney was repositioned, and the abdominal muscle layer and skin were sutured sequentially in layers. The incision site was swabbed with iodine to confirm the absence of bleeding, and the rats were returned to their cages for recovery. Fourteen days post-modeling, the rats were euthanized by overdose of isoflurane anesthesia. The obstructed left kidney was harvested and sectioned along its longitudinal axis. Partial tissue samples were fixed in 4% paraformaldehyde for histopathological analysis, while the remaining tissues were stored at −80°C for subsequent biochemical or molecular parameter detection.
Hematoxylin and Eosin (HE) Staining
After dewaxing, the sections were immersed sequentially in Xylene I and Xylene II for 20 minutes each. Dehydration was then performed using a graded alcohol series (100%, 95%, and 85% ethanol for 2 minutes each). The sections were stained with hematoxylin for 2 minutes and rinsed thoroughly under running water. Differentiation was carried out using 1% hydrochloric acid alcohol for 2 seconds, followed by bluing under running water for 30 minutes. Afterward, the sections were briefly rinsed in 80% ethanol and stained with eosin for 1–3 minutes. This was followed by gradient dehydration (80% ethanol for 30 seconds, 95% ethanol twice for 1 minute each, and absolute ethanol twice for 3 minutes each). Finally, the sections were cleared by immersion in Xylene I and Xylene II for 3 minutes each and mounted using neutral balsam.
Masson’s Trichrome Staining
The sections were routinely dewaxed and rehydrated. They were stained with Weigert’s hematoxylin for 5–10 minutes, then rinsed with distilled water. Following this, sections were treated with phosphomolybdic acid for approximately 5 minutes. Staining with aniline blue was performed for 3–5 minutes. Excess dye was washed out with 1% acetic acid, followed by gentle rinsing with 95% ethanol. Dehydration was completed with absolute ethanol, clearing was done using xylene, and the sections were sealed with neutral balsam.
Modified Sirius Red Staining
Tissue samples were fixed in 10% formalin, embedded in paraffin, and sectioned at 4 μm thickness. After dewaxing and rehydration, sections were stained with iron hematoxylin for 8 minutes and rinsed with distilled water. Bluing was achieved by running tap water for 6 minutes, followed by three rinses with distilled water. Sirius Red staining solution was then applied for 15 minutes. Sections were rapidly rinsed with distilled water, dehydrated through a graded ethanol series starting from 75%, cleared with xylene, and mounted using neutral balsam.
Immunohistochemistry
Tissue sections were first dewaxed by immersion in Xylene I and Xylene II for 20 minutes each. This was followed by gradient dehydration using 100%, 95%, and 85% ethanol for 2 minutes each. The sections were then washed in distilled water for 2 minutes and rinsed several times with phosphate-buffered saline (PBS). Antigen retrieval was performed using EDTA buffer under high-pressure conditions. Specifically, the sections were heated for 10 minutes, allowed to cool for 3 minutes post-steam generation, and then rinsed three times with PBS. Endogenous peroxidase activity was blocked by incubating the sections with a peroxidase-blocking solution at room temperature for 20 minutes, followed by three PBS washes. Primary antibodies were applied and incubated overnight at 4°C. The following day, sections were rinsed with PBS three times for 8 minutes each. The corresponding secondary antibody was then applied and incubated at room temperature for 30 minutes, followed by three 3-minute PBS washes. For visualization, a freshly prepared DAB chromogenic solution (1 drop of concentrated DAB + 1 mL of substrate) was added for 5 minutes. The sections were rinsed with tap water, counterstained with hematoxylin for 1 minute, and then washed under running water for 5 minutes. The slides were then dehydrated using a graded ethanol series (75%, 95% I, 95% II, absolute ethanol I, and absolute ethanol II), cleared in xylene for 3 minutes, and finally mounted using neutral balsam.
Immunofluorescence Staining
Paraffin-embedded tissue sections were sequentially deparaffinized in xylene I and xylene II for 20 min each. Rehydration was performed through a graded ethanol series (100%, 95%, and 85% ethanol) for 2 min each, followed by rinsing in running tap water. Sections were then washed in distilled water and PBST buffer three times (2 min per wash). Antigen retrieval was carried out using a high-pressure cooker at high temperature and pressure for 2 min. After retrieval, sections were washed with PBST three times (2 min per wash). A blocking solution was applied and incubated at room temperature for 10 min, followed by three washes in PBST (3 min per wash). Sections were permeabilized with 0.5% Triton X-100 at room temperature for 15 min and subsequently washed three times with PBST (3 min per wash). Primary antibodies were then applied at the following dilutions: HIF-1α (1:200) and MYC (1:100), and incubated overnight at 4 °C. On the following day, sections were washed three times with PBST (3 min per wash). Fluorescently labeled secondary antibodies (approximately 100 μL per section) were added and incubated at 37 °C for 1 h in the dark. After incubation, sections were washed three times with PBST (3 min per wash). Finally, slides were mounted using an anti-fade mounting medium containing DAPI and examined under a fluorescence microscope.
Western Blot Analysis
All proteins were extracted using RIPA lysis buffer (P0013B, Beyotime) with a protease and phosphatase inhibitor cocktail (P1045, Beyotime). Then, 20 μg of proteins were loaded on 8% SDS-PAGE, transferred onto polyvinylidene fluoride membrane, and sealed with blocking solution. Next, the membranes were incubated with anti-Collagen III (ab7778, Abcam), anti-Collagen I (ab316222, Abcam), anti-TLR2 (ORB1100558, biorbyt), anti-cMYC (ab185656, Abcam), anti-ASMA (GTX100034, GeneTex), anti-HLA-G (ab52455, Abcam), anti-Endothelin (ab2786, Abcam), anti-HIF-1 alpha (WL01607, Wanleibio), anti-GAPDH (2118S, Cell Signaling Technology) antibodies and the corresponding secondary antibodies. The blots were visualized using a chemiluminescent detection system.
Quantitative Real-Time PCR (RT-qPCR)
Total RNA was extracted from renal tissues using Trizol Reagent (Ambion, Lot No. 10057931) following the manufacturer’s instructions. RNA purity and concentration were assessed using a NanoDrop spectrophotometer. Complementary DNA (cDNA) was synthesized using a reverse transcription kit (Yeasen Biotechnology, Shanghai, Lot No. H9405020) according to the manufacturer’s protocol.
RT-qPCR was performed on a ROCGENE fluorescence-based quantitative PCR instrument (Model No. 201901003, ROCGENE) using SYBR Green PCR Master Mix (Yeasen Biotechnology, Shanghai, Lot No. WH2422050). The PCR conditions were as follows: initial denaturation at 95°C for 10 minutes, followed by 40 cycles of denaturation at 95°C for 15 seconds, annealing at 60°C for 15 seconds, and extension at 72°C for 30 seconds. A final dissociation step was performed to confirm the specificity of the amplified products.
The relative expression levels of the target genes were calculated using the 2−ΔΔCt method, with GAPDH as an internal control. All samples were run in triplicate, and the results were analyzed using the ROCGENE software. The primer sequences (Table S1) used for RT-qPCR were synthesized by Xi’an Tsingke Biotechnology Co., Ltd.
Statistical Analysis
All data processing and analyses in this study were performed using R software (version 4.3.0). Unless otherwise specified, comparisons between two groups of continuous variables were conducted as follows: the independent Student’s t-test was used for normally distributed data, while the Mann–Whitney U-test (also known as the Wilcoxon rank-sum test) was applied for non-normally distributed data. For comparisons involving three or more groups, the Kruskal–Wallis test was employed. Correlations between variables were assessed using Spearman’s rank correlation coefficient. All statistical tests were two-sided unless otherwise indicated, and a P value < 0.05 was considered statistically significant.
Results
Technology Roadmap
As shown in Figure 1, this study follows a structured workflow consisting of several key steps. First, data were collected from three GEO datasets (GSE22459, GSE76882, and GSE53605), comprising 76 RIF and 142 control samples. These datasets were merged and normalized for subsequent analysis. Differential expression analysis was then performed to identify IHRDEGs, which were further validated using ROC curve analysis. Functional enrichment of the DEGs was conducted based on GO and KEGG pathway analyses. A diagnostic model was constructed using the identified IHRDEGs, and downstream analysis was carried out to examine associated regulatory networks. Based on the model-derived risk scores, samples were stratified into low-risk and high-risk groups, and immune cell infiltration was assessed in each group using ssGSEA. Consensus clustering was also applied, dividing the samples into two distinct clusters, followed by comparative analysis of their immune infiltration characteristics. A PPI network was constructed to explore functional interactions among the key genes. Finally, immune infiltration patterns and their correlations with model genes were analyzed across different risk groups and clusters.
 |
Figure 1 FlowChart for the Comprehensive Analysis of IHRDEGs. Abbreviations: RIF, Renal Interstitial Fibrosis; GSEA, Gene Set Enrichment Analysis; DEGs, Differentially Expressed Genes; IHRGs, Inflammatory&Hypoxia-Related Genes; GO, Gene Ontology; KEGG, Kyoto Encyclopedia of Genes and Genomes; IHRDEGs, Inflammatory&Hypoxia-Related Differentially Expressed Genes; ROC, Receiver Operating Characteristic; TF, Transcription Factor; PPI, Protein-protein Interaction; ssGSEA, single-sample Gene-Set Enrichment Analysis. |
Identification of 651 DEGs and 15 Inflammation- and Hypoxia-Related DEGs (IHRDEGs)
To integrate the RIF datasets GSE22459, GSE76882, and GSE53605, R sva was utilized for eliminating batch effects, leading to the Combined GEO dataset. To evaluate the efficiency of batch effect correction, distribution boxplots (Figure 2A and B) were constructed to compare expression values pre- and post-correction. Additionally, PCA plots (Figure 2C and D) were utilized to evaluate the patterns of low-dimensional features pre- and post-correction. The results of both the boxplots and PCA plots confirmed that the batch effects in the RIF datasets were effectively corrected after removing the batch.
 |
Figure 2 Batch Effect Correction of GSE22459, GSE76882 and GSE53605. (A) Boxplots of GEO Combined Datasets distribution before batch processing. (B) Go to the post-batch integrated GEO Datasets (Combined Datasets) distribution boxplots. (C) PCA plot of integrated GEO Datasets (Combined Datasets) before debatching. (D) PCA plot of integrated GEO Datasets (Combined Datasets) after debatching. Green is the RIF dataset GSE22459, blue is the RIF dataset GSE76882, and brown is the RIF dataset GSE53605. Abbreviations: PCA, Principal Component Analysis; RIF, Renal Interstitial Fibrosis. |
The Combined GEO dataset was assigned to groups: RIF and Control groups. To identify DEGs between these groups, R limma was used for differential expression analysis. Overall, 651 DEGs meeting the criteria |logFC|>0.5 and adjusted p<0.05 were identified. Among them, 436 genes were upregulated (logFC>0.5, adj. p<0.05), while 215 genes were downregulated (logFC<-0.5, adj. p<0.05). A volcano plot (Figure 3A) was generated to visualize the DEG distribution.
 |
Figure 3 Analysis of DEGs. (A) Volcano plot of DEG analysis between the RIF and Control groups in Combined GEO Datasets. (B) DEGs and Venn diagram of IHRGs in the Combined Datasets. (C) Heat map of IHRDEGs in the Combined Datasets. (D) Chromosomal mapping of IHRDEGs. The RIF group is purple, and the Control group is green. Red and blue represent high and low expression in the heat map. Abbreviations: RIF, Renal Interstitial Fibrosis; DEGs, Differentially Expressed Genes; IHRGs, Inflammatory & Hypoxia-Related Genes; IHRDEGs, Inflammatory & Hypoxia-Related Differentially Expressed Genes. |
To identify IHRDEGs, the intersection of DEGs (|logFC|>0.5, adj. p<0.05) and IHRGs was determined. A Venn diagram (Figure 3B) illustrated this overlap, revealing 15 IHRDEGs: NFKBIA, TLR2, HIF1A, EDN1, HLA-G, AHR, CCL2, MYC, CXCR4, ICAM1, JUN, FOS, PLAUR, SERPINE1, and PTGS2. The expression patterns of these IHRDEGs across various sample cohorts in the Combined GEO dataset were analyzed, and a heatmap (Figure 3C) was generated using R pheatmap. Additionally, the chromosomal locations of the 15 IHRDEGs were mapped using R RCircos, producing a chromosome localization map (Figure 3D). This analysis revealed that chromosome 14 harbored multiple IHRDEGs, including FOS, HIF1A, and NFKBIA.
All 15 IHRDEGs are Significantly Upregulated and Show Diagnostic Potential
To investigate the differential expression of IHRDEGs in the Combined GEO dataset, a group comparison plot (Figure 4A) was generated to visualize the expression differences between the RIF and Control groups. The analysis demonstrated that all 15 IHRDEGs (NFKBIA, TLR2, HIF1A, EDN1, HLA-G, AHR, CCL2, MYC, CXCR4, ICAM1, JUN, FOS, ALB, PLAUR, and SERPINE1) exhibited statistically significant differential expression between the two groups (p<0.001).
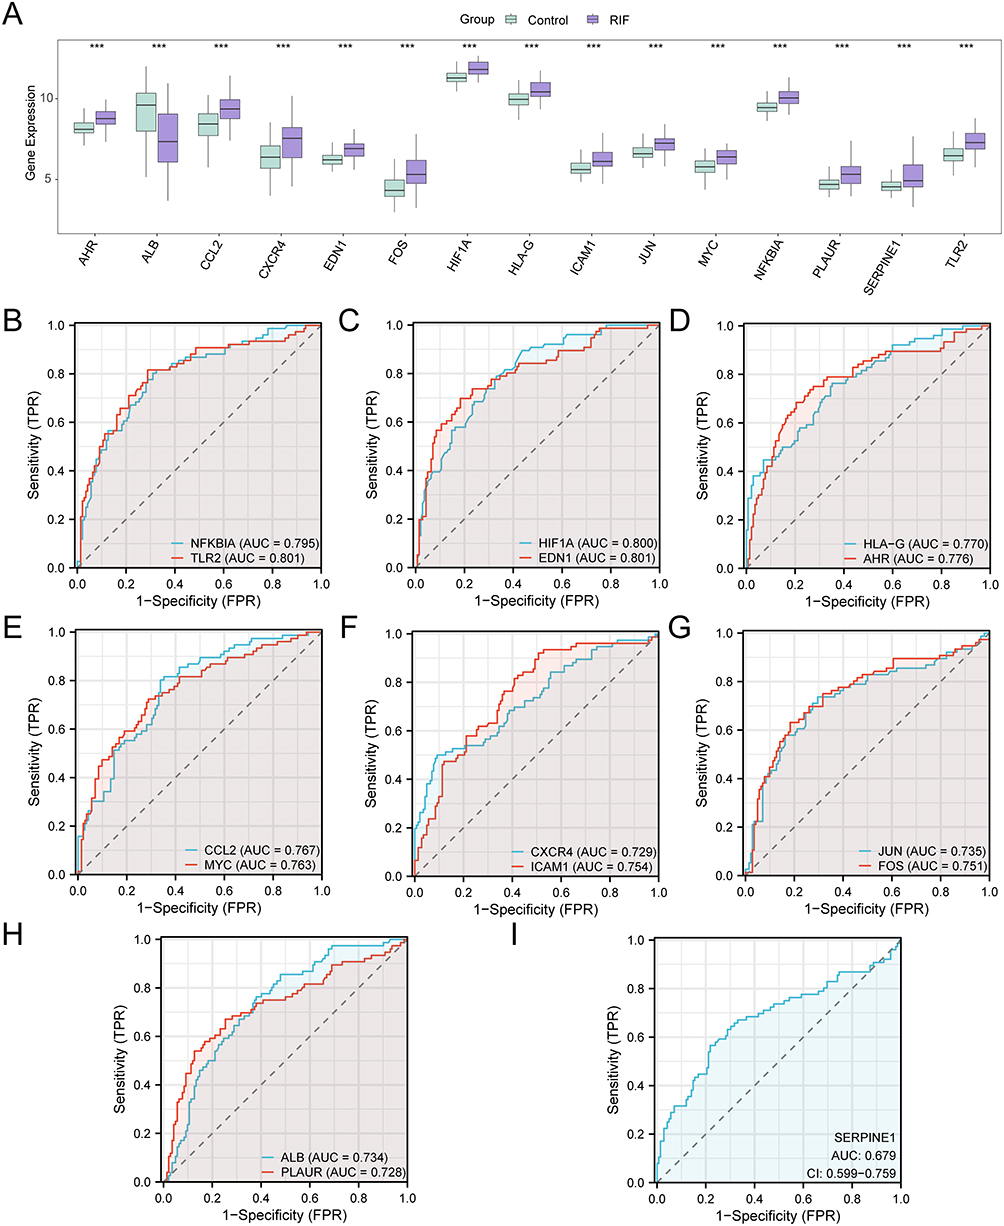 |
Figure 4 Differential Expression Validation and ROC Curve Analysis. (A) Group comparison of IHRDEGs in the RIF and Control groups of the Combined GEO Datasets. (B–I). IHRDEGs NFKBIA and TLR2 (B), HIF1A and EDN1 (C), HLA-G and AHR (D), CCL2 and MYC (E), CXCR4 and ICAM1 (F), JUN and FOS (G), ALB and PLAUR (H). ROC curves of SERPINE1 (I) in the Combined Datasets. ***Represents p<0.001. When AUC>0.5, it signifies that the molecule expression is a trend to promote the occurrence of the event, and the closer the AUC is to 1, the better the diagnostic effect. AUC had low accuracy in the range of 0.5 to 0.7, and AUC had moderate accuracy in the range of 0.7 to 0.9. The RIF and Control groups are purple and green, respectively. Abbreviations: RIF, Renal Interstitial Fibrosis; IHRDEGs, Inflammatory & hypoxia-Related Differentially Expressed Genes; ROC, Receiver Operating Characteristic; AUC, Area Under the Curve; TPR, True Positive Rate; FPR, False Positive Rate. |
To determine the diagnostic performance of these genes, ROC curve assessment was conducted using R pROC (Figure 4B–I). The results indicated that 14 IHRDEGs (NFKBIA, TLR2, HIF1A, EDN1, HLA-G, AHR, CCL2, MYC, CXCR4, ICAM1, JUN, FOS, ALB, and PLAUR) displayed moderate to high discriminatory power in differentiating RIF from Control samples (0.7<AUC<0.9). In contrast, SERPINE1 exhibited lower discriminatory power (0.5<AUC<0.7), suggesting the two groups.
Functional Enrichment Reveals IHRDEGs Regulate Immune–Inflammatory Signaling Pathways
To better understand the biological functions of 15 IHRGs in RIF, GO and KEGG enrichment analyses were executed. These analyses explored the involvement of IHRGs in BP, CC, MF, and biological pathways (KEGG). The detailed enrichment results are presented in Table 2. The GO analysis revealed that IHRGs were significantly enriched in BP, including response to muscle stretch, response to hypoxia, positive regulation of miRNA transcription, response to decreased oxygen levels, and regulation of endothelial cell apoptotic processes. In terms of CC, IHRGs were significantly enriched in RNA polymerase II transcription regulator complex, euchromatin, platelet alpha granule lumen, endoplasmic reticulum lumen, and transcription repressor complex. Regarding MF, IHRGs were involved in DNA-binding TF binding, transcription coregulator binding, RNA polymerase II-specific DNA-binding TF binding, E-box binding, and exogenous protein binding.
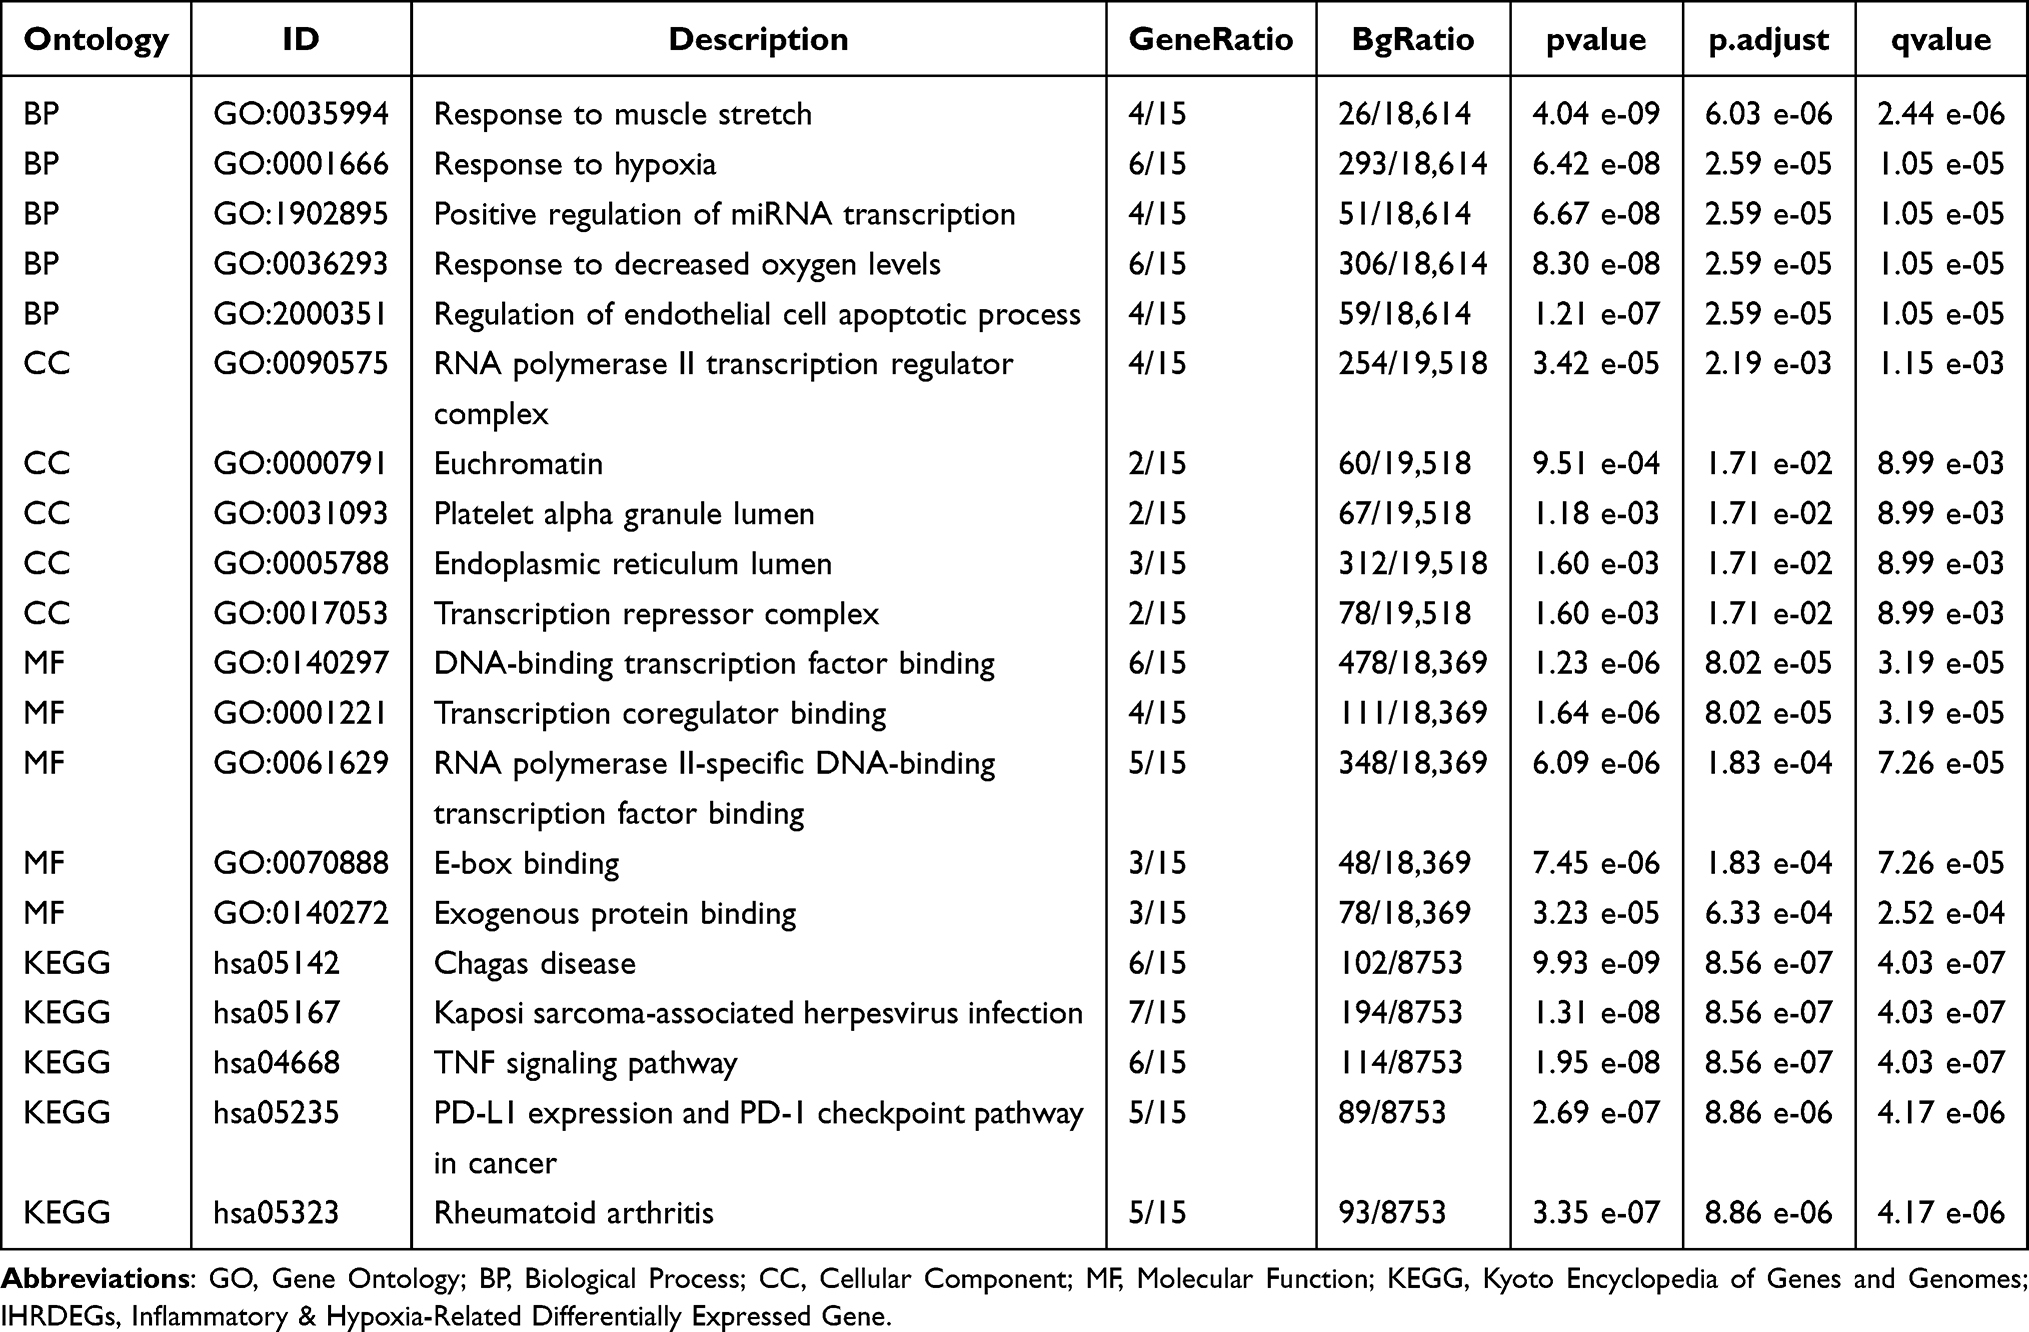 |
Table 2 GO and KEGG Enrichment Analyses for IHRDEGs |
KEGG pathway analysis revealed that the identified IHRGs were significantly enriched in inflammation- and immunity-associated pathways, including the TNF signaling pathway, PD-L1 expression and PD-1 checkpoint pathway in cancer, and rheumatoid arthritis. These pathways are closely associated with fibrotic and inflammatory processes, suggesting that the IHRGs may play a critical role in the pathogenesis of RIF by modulating immune signaling and inflammatory responses.
The GO and KEGG enrichment results were visualized using bar charts (Figure 5A). In addition, network diagrams were constructed to illustrate the relationships among BP, CC, MF, and KEGG pathways based on the enrichment data (Figure 5B–E). In these diagrams, edges represent molecular associations, and the size of each node reflects the number of genes involved in the corresponding pathway or process. Notably, a substantial number of IHRGs were enriched in inflammation-related pathways, further supporting their involvement in RIF pathogenesis.
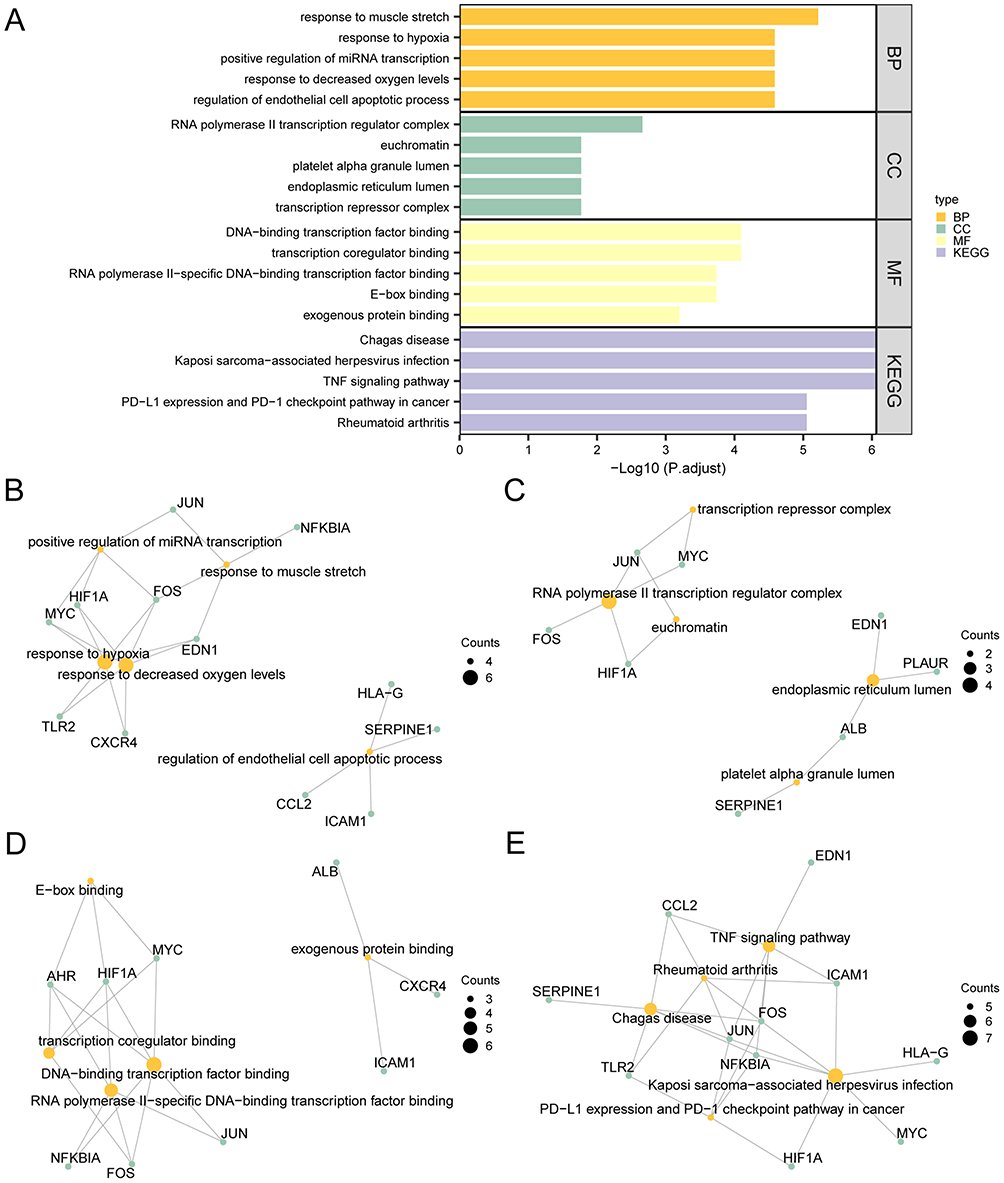 |
Figure 5 GO and KEGG Enrichment Analysis for IHRDEGs. (A) Bar chart of GO and KEGG results of IHRGs: BP, CC, MF and biological pathway (KEGG). GO terms and KEGG terms are shown on the ordinate. (B–E) The GO and KEGG enrichment analysis results of IHRGs are shown in the network diagram: BP (B), CC (C), MF (D) and KEGG (E). The Orange nodes denote items, the green nodes signify molecules, and the connecting lines illustrate the associations between items and molecules. The selection thresholds for GO and KEGG analyses were set at adj.p<0.05 and an FDR (q-value)<0.25, with BH correction applied for multiple testing. |
To evaluate the impact of global gene expression patterns in the integrated GEO datasets (Combined Datasets) on RIF, GSEA was conducted. This analysis aimed to identify the BP, CC, and MF processes influenced by differential gene expression in RIF. The results, as presented in Figure 6A and Table 3, demonstrated significant enrichment of genes in several key signaling pathways related to inflammation and fibrosis. Notably, genes were highly enriched in the IL-12 (Figure 6B), NF-κB (Figure 6C), TGF-β (Figure 6D), and PI3K-Akt (Figure 6E) signaling pathways. These pathways are well known for their involvement in immune regulation, cellular apoptosis, extracellular matrix remodeling, and fibrosis progression.
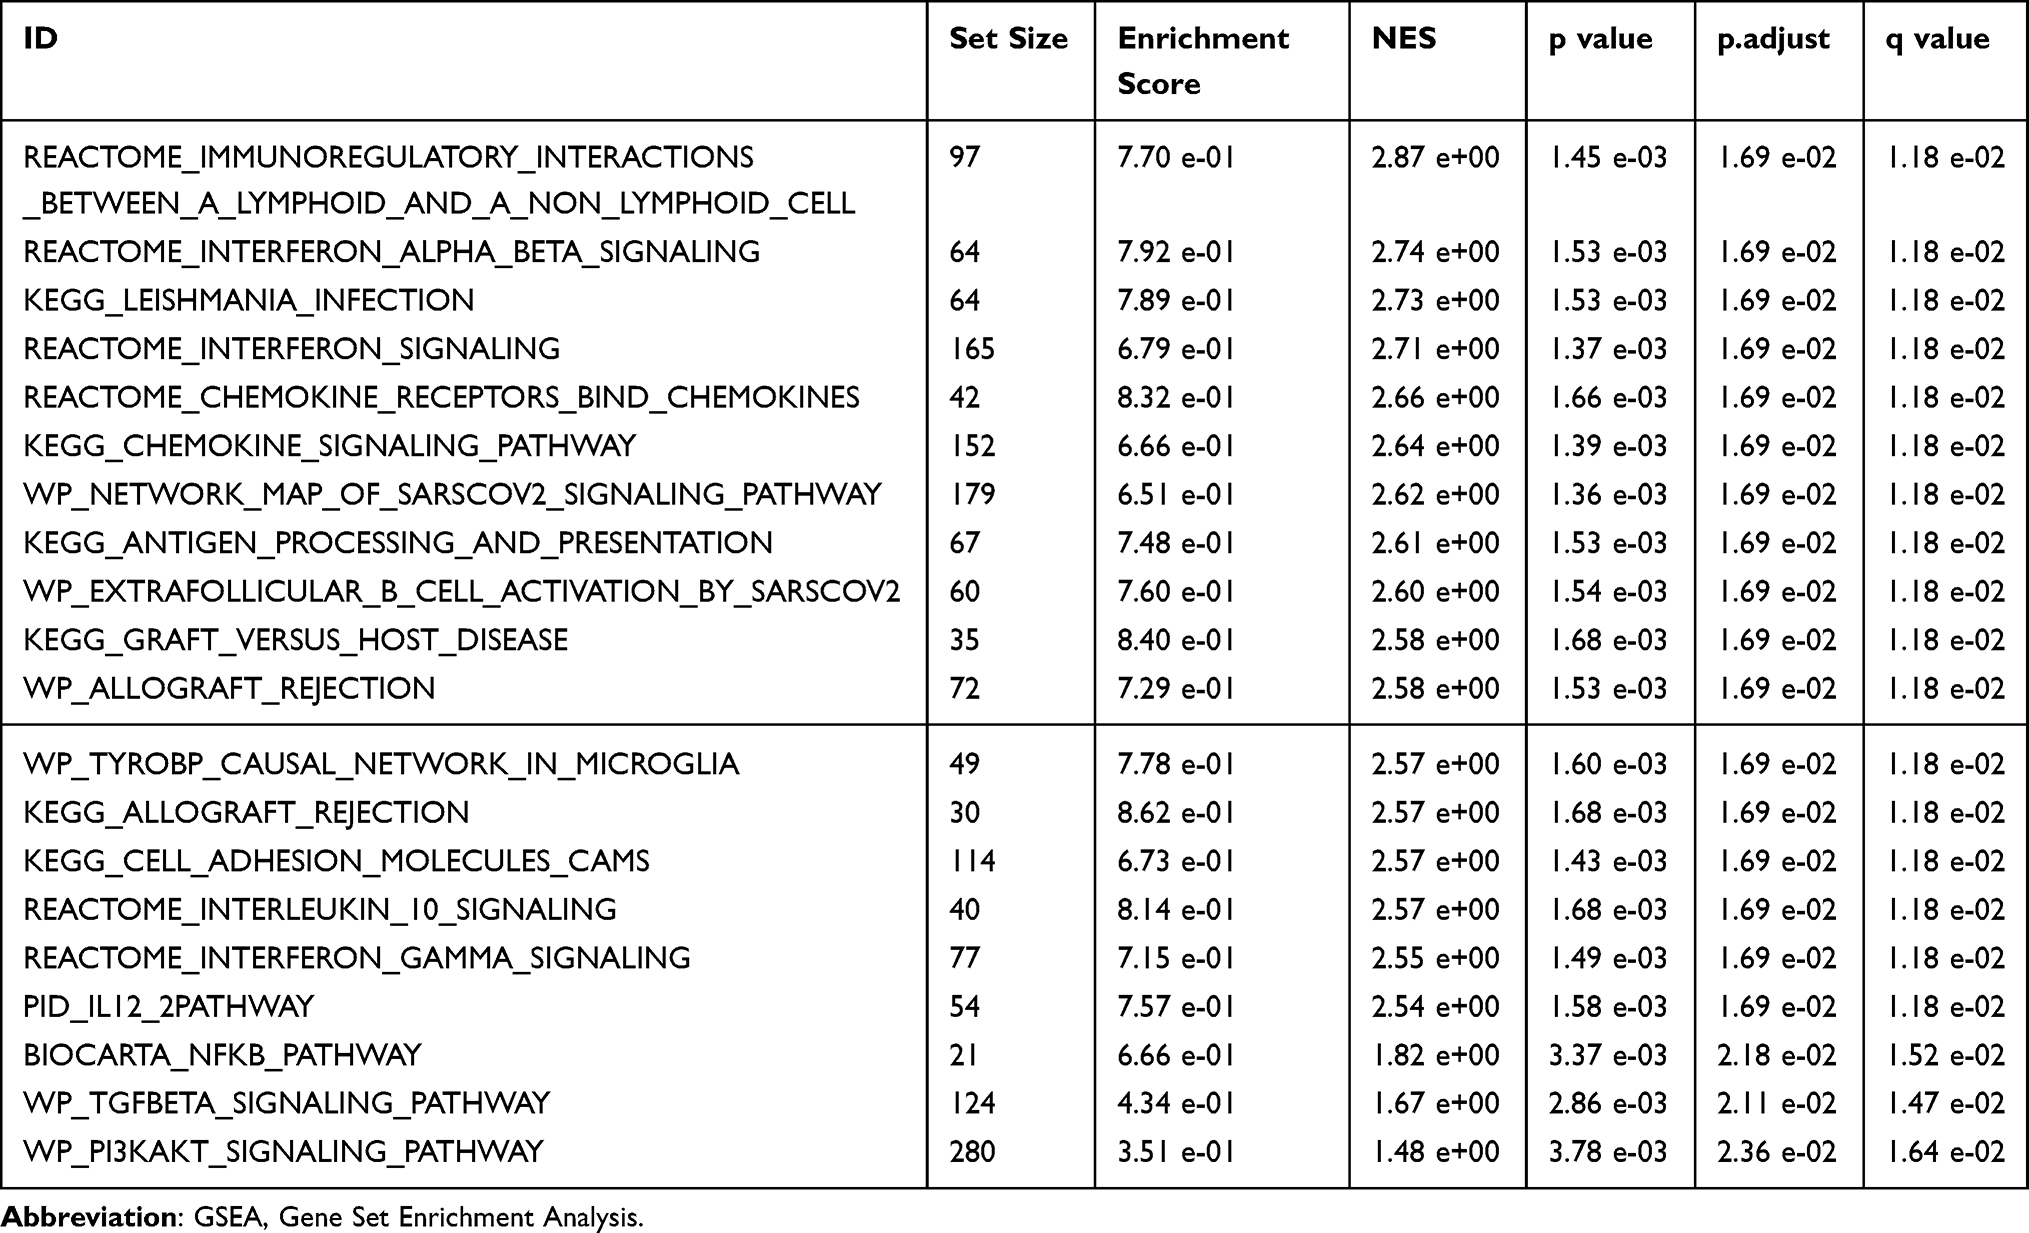 |
Table 3 Results of GSEA for Combined Datasets |
 |
Figure 6 GSEA for Combined Datasets. (A) GSEA 4 biological functions bubble plot presentation of the Combined Datasets. (B–E) GSEA revealed significant enrichment of all genes in IL12 pathway (B), Nfkb Pathway (C), TGF−beta Signaling Pathway (D), Pi3k-akt Signaling Pathway (E). GSEA, Gene Set Enrichment Analysis. In the bubble plot, the size of the bubble represents the number of enriched genes, and the color of the bubble represents the size of the NES value. The redder the color, the larger the NES, and the bluer the smaller the NES. The screening criteria of GSEA were adj.p<0.05 and FDR value (q-value)<0.25, and the p-value correction method was BH. |
Notably, pathways such as IL-12 signaling were identified through GSEA but not by conventional DEG-based KEGG enrichment analysis, suggesting that their enrichment may result from subtle yet coordinated changes in gene expression. This highlights the complementary value of GSEA in detecting pathway-level perturbations that might be overlooked when relying solely on significantly differentially expressed individual genes.
A Diagnostic Model Based on IHRDEGs Reveals Potential Biomarkers and Immune Regulatory Features in Renal Interstitial Fibrosis
To establish a diagnostic model for RIF, the diagnostic value of 15 IHRDEGs was first evaluated using logistic regression analysis. A logistic regression model was developed according to these genes and visualized using a Forest Plot (Figure 7A). The results demonstrated that all 15 IHRDEGs (NFKBIA, TLR2, HIF1A, EDN1, HLA-G, AHR, CCL2, MYC, CXCR4, ICAM1, JUN, FOS, ALB, PLAUR, and SERPINE1) were statistically significant in the logistic regression model (p<0.05). Subsequently, a SVM model was developed using the SVM algorithm, and the number of genes corresponding to the lowest error rate (Figure 7B) and highest accuracy (Figure 7C) was determined. The findings indicated that the SVM model achieved optimal accuracy when incorporating seven genes: EDN1, HLA-G, MYC, HIF1A, PLAUR, TLR2, and CXCR4. These seven IHRDEGs were then subjected to LASSO regression analysis to refine the diagnostic model for RIF. The LASSO regression model was constructed, and its visualization was presented through the LASSO regression model (Figure 7D) and variable trajectory (Figure 7E) diagrams. The results identified five key IHRDEGs (EDN1, HLA-G, MYC, HIF1A, and TLR2) as the final model genes included in the LASSO regression model. Lastly, a LASSO risk score (RiskScore) was computed according to the risk coefficients obtained from LASSO regression analysis, with the risk score determined as follows:

 |
Figure 7 The Diagnostic Model of RIF. (A) Forest Plot of 15 IHRDEGs included in Logistic regression model in RIF diagnostic model. (B and C) Visualization of the number of genes with the lowest error rate (B) and the number of genes with the highest accuracy (C) obtained by the SVM algorithm. (D and E). Diagnostic model plot (D) and variable trajectory plot (E) of LASSO regression model. Abbreviations: IHRDEGs, Inflammatory & Hypoxia-Related Differentially Expressed Genes; RIF, Renal Interstitial Fibrosis; SVM, Support Vector Machine; LASSO, Least Absolute Shrinkage and Selection Operator. |
R pROC was utilized to generate a ROC curve based on the RiskScore in the Combined GEO Datasets. The ROC analysis (Figure 8A) indicated that the RiskScore demonstrated moderate diagnostic accuracy across different groups, with an AUC ranging between 0.7 and 0.9. To further assess the diagnostic model for RIF, a nomogram was constructed using the Model Genes to illustrate their contribution to the predictive model within the Combined GEO Datasets (Figure 8B). The findings revealed that HLA-G exhibited the highest diagnostic efficacy among the Model Genes, whereas TLR2 had the lowest predictive utility in distinguishing RIF from control samples.
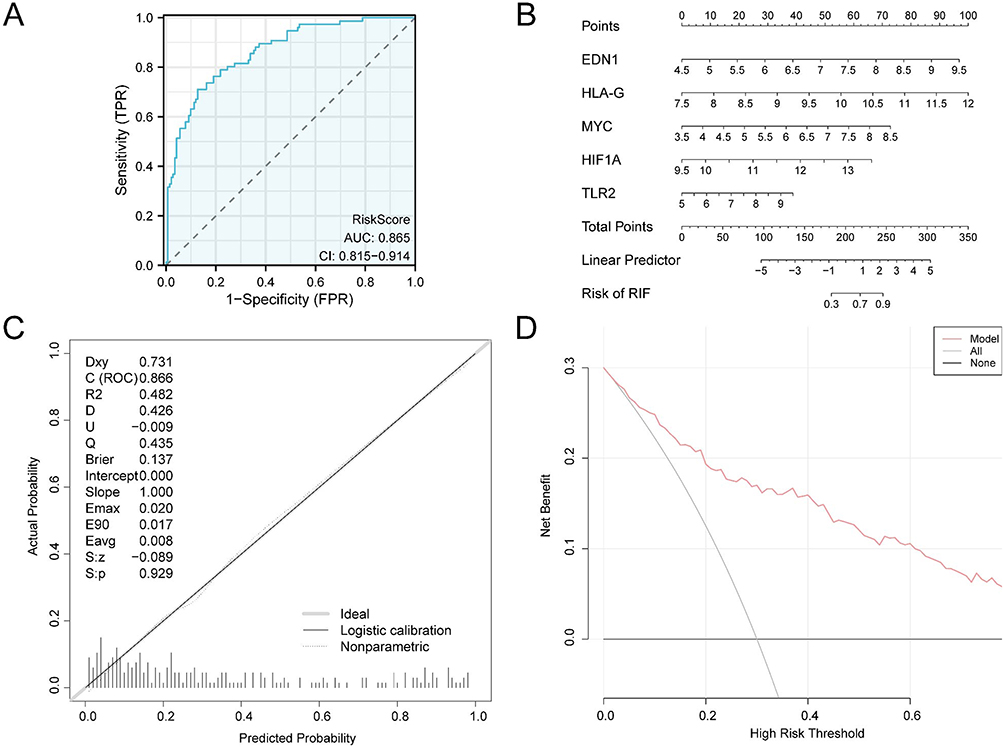 |
Figure 8 Diagnostic and Validation Analyses of RIF. (A) ROC curves of RiskScore in the Combined GEO Datasets. (B) Nomograms of Model Genes in integrated GEO Datasets (Combined Datasets) in RIF diagnostic models. (C and D). Calibration Curve plot (C) and decision curve analysis (DCA) plot (D) of RIF diagnostic Model based on Model Genes in integrated GEO Datasets (Combined Datasets). The ordinate of the Calibration Curve plot is the net benefit, and the abscissa is the Probability Threshold or Threshold Probability. The AUC of the ROC curve typically ranges from 0.5 to 1, with values approaching 1 indicating superior diagnostic accuracy. An AUC between 0.7 and 0.9 reflects moderate to high diagnostic performance. Abbreviations: RIF, Renal Interstitial Fibrosis; ROC, Receiver Operating Characteristic; AUC, Area Under the Curve; DCA, Decision Curve Analysis; TPR, True Positive Rate; FPR, False Positive Rate. |
To determine the model’s reliability and classification performance, a calibration curve was plotted using calibration analysis (Figure 8C). The calibration plot demonstrated that the predicted probability of the model closely aligned with the actual probability, with only a slight deviation from the ideal diagonal reference line. Furthermore, DCA was conducted to evaluate the clinical applicability of the RIF diagnostic model (Figure 8D). The results demonstrated that the model provided a greater net benefit than the all-positive and all-negative strategies within a defined range, suggesting robust clinical utility and an overall effective diagnostic performance.
To validate the differential expression and diagnostic performance of the model, RIF samples from the Combined GEO Datasets were stratified into HighRisk and LowRisk groups according to the median RiskScore of the RIF diagnostic model. To examine the differential expression of Model Genes in these groups, a group comparison analysis was conducted (Figure 9A). The findings revealed significant differences in the expression levels of the five model genes (EDN1, HLA-G, MYC, HIF1A, and TLR2) between the HighRisk and LowRisk groups, with all genes exhibiting highly statistically significant differences (p<0.001). To further assess the classification performance of the Model Genes, R pROC was employed to generate ROC curves according to their expression levels in RIF samples from the Combined GEO Datasets (Figure 9B–F). The results demonstrated that TLR2 had the highest discriminatory ability among the model genes in distinguishing HighRisk and LowRisk groups (AUC >0.90), suggesting a prominent role in risk stratification, though this requires confirmation in independent cohorts. Meanwhile, the remaining four Model Genes (EDN1, HLA-G, MYC, and HIF1A) demonstrated moderate accuracy (0.7<AUC<0.9) in classifying the two risk groups. This, it is speculated that TLR2 serves as a potential biomarker for distinguishing between high- and low-risk RIF samples. Model performance was evaluated using the R package pROC (v1.18.5). The area under the ROC curve (AUC) was calculated to assess discriminatory ability. The optimal cut-point was determined using the Youden index to achieve the best balance between sensitivity and specificity. Detailed diagnostic metrics, including optimal cut-off values determined by the Youden index, sensitivity, specificity, accuracy, predictive values, and 95% confidence intervals for AUC, are provided in Table 4.
 |
Table 4 Diagnostic Performance Metrics and 95% Confidence Intervals of Individual Model Genes |
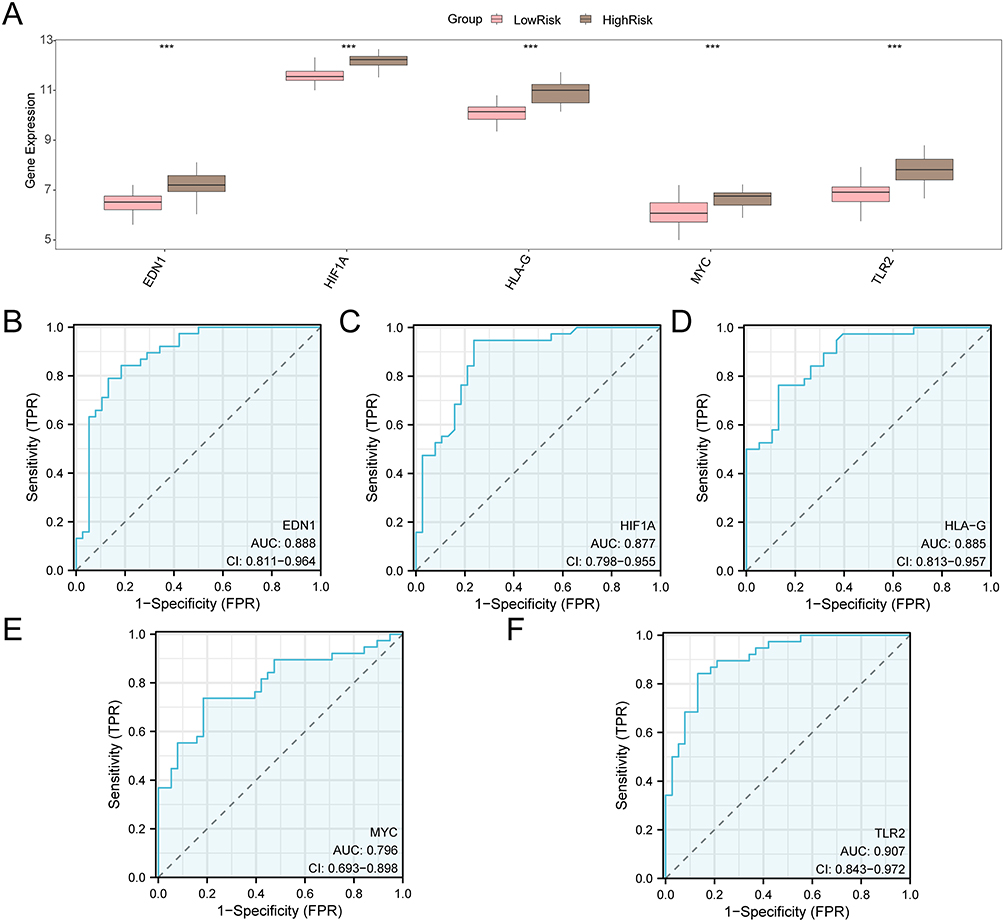 |
Figure 9 Differential Expression Validation and ROC Curve Analysis. (A) Group comparison plots of Model Genes in the HighRisk and LowRisk groups of RIF samples from the Combined GEO Datasets. (B–F) ROC curves of Model Genes EDN1 (B), HIF1A (C), HLA-G (D), MYC (E), TLR2 (F) in RIF samples from integrated GEO Datasets (Combined Datasets). ***Represents p<0.001. An AUC greater than 0.5 suggests that the molecule’s expression is associated with an increased likelihood of the event occurring, with values approaching 1 indicating superior diagnostic performance. An AUC between 0.7 and 0.9 signifies moderate accuracy, while values exceeding 0.9 reflect high diagnostic precision. The brown represents the HighRisk group, and the pink represents the LowRisk group. Abbreviations: RIF, Renal Interstitial Fibrosis; ROC, Receiver Operating Characteristic; AUC, Area Under the Curve; TPR, True Positive Rate; FPR, False Positive Rate. |
To explore immune infiltration differences between HighRisk and LowRisk groups in RIF, the expression matrix from the Combined GEO Datasets was employed to compute the infiltration abundance of 28 immune cell types using the ssGSEA algorithm. First, a group-comparison plot (Figure 10A) was generated to illustrate disparities in immune cell distribution across the groups. A significant divergence (p<0.05) was observed in the infiltration patterns of 23 immune cell types, including activated dendritic cells, activated CD8 T cells, activated CD4 T cells, activated B cells, and others. Notably, certain immune cells, such as regulatory T cells (Tregs) and myeloid-derived suppressor cells (MDSCs), exhibit dual roles depending on their activation status. While Tregs generally maintain immune tolerance and exert protective effects, they can contribute to fibrosis when activated or shifted toward a pro-inflammatory phenotype. Similarly, MDSCs, typically known for their immunosuppressive functions, may promote fibrosis under specific pathological conditions by enhancing inflammatory responses.
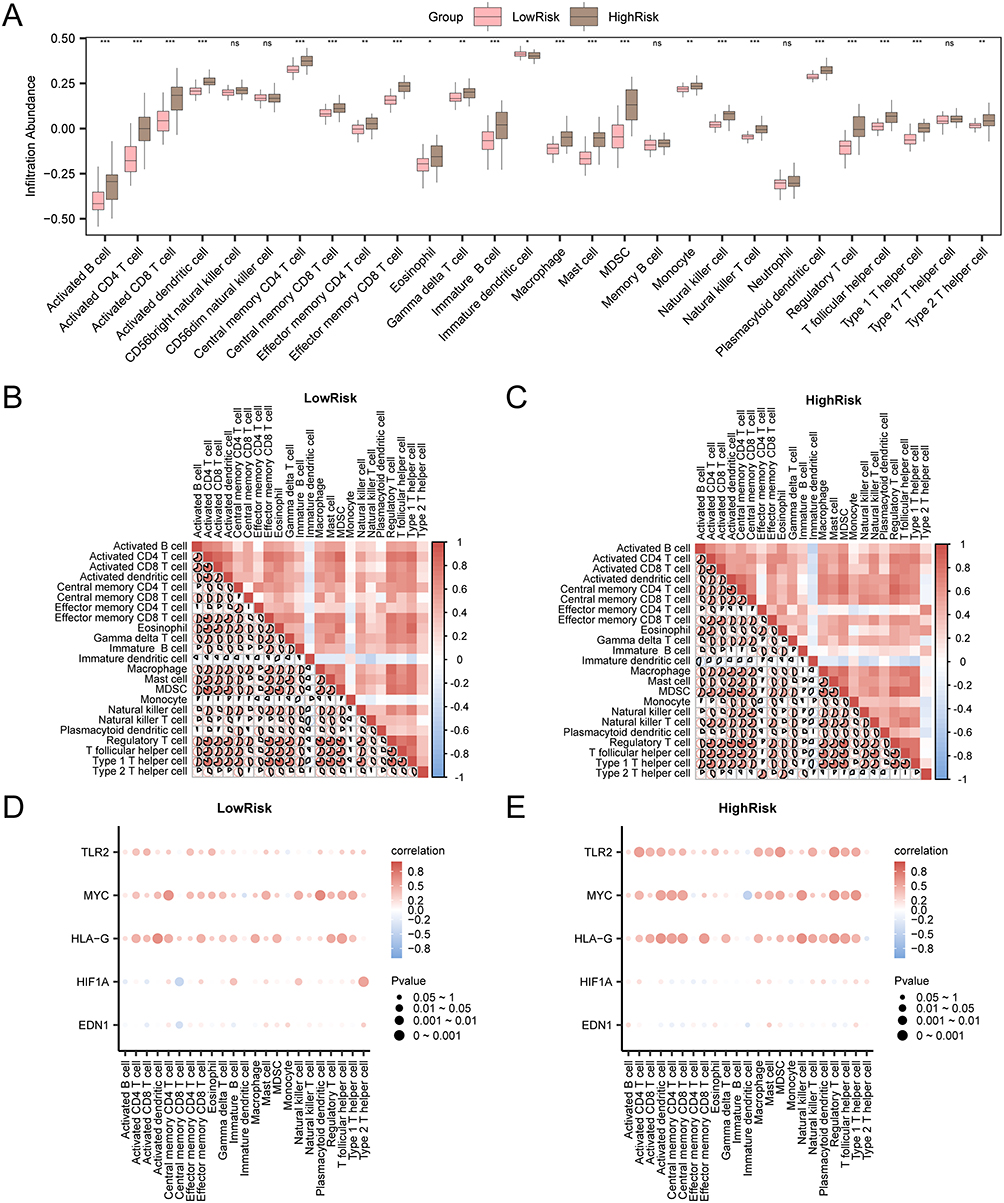 |
Figure 10 Immune Infiltration Analysis of Risk Groups Using the ssGSEA Algorithm. (A) Comparative analysis of immune cell composition between the LowRisk and HighRisk groups in RIF samples. (B and C) Correlation analysis illustrating ICI abundance in the LowRisk (B) and HighRisk (C) groups of RIF samples. (D and E) Bubble plots depicting the correlation between ICI levels and Model Genes in the LowRisk (D) and HighRisk (E) groups. Statistical significance was determined based on p-values, where “ns” (p≥0.05) indicated no statistical significance, *(p<0.05) represented statistical significance, **(p<0.01) denoted high statistical significance, and ***(p<0.001) indicated very high statistical significance. Correlation strength was interpreted using absolute correlation coefficient (r-value) thresholds: values below 0.3 suggested negligible or no correlation, between 0.3 and 0.5 indicated a weak correlation, between 0.5 and 0.8 represented a moderate correlation, and values exceeding 0.8 signified a strong correlation. In visual representations, the LowRisk group was marked in pink, while the HighRisk group was shown in brown. Positive correlations were indicated in red, whereas negative correlations appeared in blue, with the intensity of the color reflecting the strength of the correlation. Abbreviations: ssGSEA, single-sample Gene-Set Enrichment Analysis; RIF, Renal Interstitial Fibrosis. |
Next, a correlation heatmap (Figure 10B and C) was generated to visualize the relationships between ICI levels in RIF samples. The results showed that in the LowRisk group, the majority of immune cells displayed strong positive associations, with the highest correlation observed between Regulatory T cells and Type 1 T helper cells (r=0.865, p<0.05). Similarly, in the HighRisk group, most immune cells also demonstrated strong positive correlations, with the strongest correlation found between CD4 T cells and Regulatory T cells (r=0.86, p<0.05). Finally, the correlation between Model Genes and ICI abundance was analyzed using correlation bubble plots (Figure 10D and E). The results indicated that in the LowRisk group, the majority of immune cells displayed strong positive associations, with MYC showing the highest significant positive correlation with Plasmacytoid dendritic cells (r=0.674, p<0.05). In the HighRisk group, a strong positive correlation was found between HLA-G and Natural killer cells (r=0.634, p<0.05). These findings suggest distinct immune infiltration patterns between HighRisk and LowRisk groups, highlighting potential immunological mechanisms underlying RIF progression.
Molecular Subtype Identification in Renal Interstitial Fibrosis Reveals IHRDEGs-Associated Immune Heterogeneity
To investigate potential disease subtypes in RIF, R ConsensusClusterPlus was utilized to classify RIF samples from the integrated GEO datasets based on the expression levels of five Model Genes. This clustering analysis revealed 2 distinct RIF subtypes: Subtype A (Cluster1), which included 37 specimens, and Subtype B (Cluster2), which contained 39 specimens (Figure 11A–C). PCA in a 3D plot confirmed that the two subtypes exhibited significant distinctions (Figure 11D). To visualize differences in Model Gene expression between the two RIF subtypes, a heatmap was generated using R pheatmap (Figure 11E). Subsequently, differential expression analysis was conducted using R limma, identifying 1128 DEGs that met the criteria of |logFC|>0.5 and adjusted p<0.05 in the integrated GEO dataset (Combined Datasets). Among these, 487 genes were upregulated (logFC>0.5, adjusted p<0.05) and 641 genes were downregulated (logFC<-0.5, adjusted p<0.05), as visualized in a volcano plot (Figure 11F). Finally, to further confirm differences in Model Gene expression across RIF subtypes, a group comparison plot (Figure 11G) was generated. Significant differences in the expression levels of EDN1, HIF1A, HLA-G, MYC, and TLR2 were observed between the two disease subtypes, suggesting their potential role in distinguishing molecular characteristics and pathological variations associated with each subtype (p<0.001), suggesting potential molecular distinctions that could contribute to RIF heterogeneity.
 |
Figure 11 Consensus Clustering Analysis for RIF. (A) Plot of consensus clustering results for RIF samples from the Combined GEO Datasets. (B and C) Consensus cumulative distribution function (CDF) plot (B) and Delta plot (C) of consensus clustering analysis. (D) 3D PCA plot of 2 disease subtypes of RIF. (E) Heatmap of Model Genes expression values in RIF subtypes. (F) Volcano map of differentially expressed genes analysis of subtype A (Cluster1) and subtype B (Cluster2) in RIF samples from the Combined GEO Datasets. (G) Group comparison map of Model Genes between the 2 subtypes of RIF. ***Represents p<0.001. Orange is subtype A (Cluster1) and blue is subtype B (Cluster2). Red represents high expression and blue represents low expression in the heat map. Abbreviations: RIF, Renal Interstitial Fibrosis; CDF, Empirical Cumulative Distribution Function; PCA, Principal Component Analysis. |
To quantify the immune infiltration levels of 28 immune cell subtypes, the expression matrix of RIF specimens from the integrated GEO datasets was analyzed using the ssGSEA algorithm. Firstly, differences in ICI abundance between the two RIF subtypes were visualized using a group comparison plot (Figure 12A). The results demonstrated that 24 immune cells exhibited statistically significant differences (p<0.05) between the subtypes, including: Activated dendritic cells, Activated CD8 T cells, Activated CD4 T cells, Activated B cells, CD56bright natural killer cells, Central memory CD8 T cells, Central memory CD4 T cells, Effector memory CD8 T cells, Effector memory CD4 T cells, Gamma delta T cells, Eosinophils, Immature dendritic cells, Immature B cells, Monocytes, MDSCs, Mast cells, Macrophages, Natural killer T cells, Natural killer cells, Regulatory T cells, Plasmacytoid dendritic cells, Types 1 and T helper cells, and T follicular helper cells. Next, the correlation heatmap (Figure 12B and C) revealed the relationships between the abundance of ICI in RIF samples. The results showed that in Subtype A (Cluster1), the majority of immune cells displayed strong positive associations, with the most pronounced correlation noted between Central memory CD4 T cells and Regulatory T cells (r=0.854, p<0.05). Similarly, in Subtype B (Cluster2), most immune cells were strongly correlated, with the strongest positive correlation found between Regulatory T cells and Type 1 T helper cells (r=0.854, p<0.05). Furthermore, the relationship between Model Genes and ICI abundance was visualized using a correlation bubble plot (Figure 12D and E). The results showed that in Subtype A (Cluster1), most immune cells displayed strong positive correlations, with the HLA-G gene and Natural killer cells exhibiting the strongest significant correlation (r=0.59, p<0.05). In Subtype B (Cluster2), HLA-G and Activated dendritic cells demonstrated the most pronounced correlation (r=0.64, p<0.05). These findings highlight distinct immune infiltration patterns between RIF subtypes, potentially contributing to differences in disease progression and immune response mechanisms.
 |
Figure 12 Cluster Group Immune Infiltration Analysis by ssGSEA Algorithm. (A) Comparison of grouping of immune cells in RIF samples of subtype A (Cluster1) and subtype B (Cluster2). (B and C) Correlation analysis of ICI abundance in subtype A (Cluster1) (B) and subtype B (Cluster2) (C) of RIF specimens are shown. (D and E) Bubble plot of the relationship between ICI abundance and Model Genes in subtype A (Cluster1) (D) and subtype B (Cluster2) (E) of RIF specimens. Non-significant results are denoted as “ns” for p≥0.05, while statistical significance is indicated by *For p<0.05, **For p<0.01, and ***For p<0.001, with higher significance levels reflecting stronger statistical associations. Correlation strength was classified based on the absolute r-value: below 0.3 indicated weak or no correlation, 0.3–0.5 represented a weak correlation, 0.5–0.8 indicated a moderate correlation, and values above 0.8 denoted a strong correlation. Subtype A (Cluster 1) is represented in Orange, while Subtype B (Cluster 2) is depicted in blue. Red signifies a positive correlation, blue indicates a negative correlation, and the intensity of the color corresponds to the correlation strength. Abbreviations: ssGSEA, single-sample Gene-Set Enrichment Analysis; RIF, Renal Interstitial Fibrosis. |
Interaction and Regulatory Network Analysis Reveals Functional Roles of Model Genes
To investigate the interaction among the five Model Genes and their biologically related genes, a PPI network was constructed using GeneMANIA (Figure 13). The network visualization comprises various colored lines, representing diverse interaction types, such as co-expression patterns and shared protein domain information. The constructed PPI network consists of 5 Model Genes and 20 structurally related proteins, highlighting their potential biological associations. Comprehensive details regarding these interactions can be found in Table S2.
 |
Figure 13 PPI Network Analysis. The PPI network of Model Genes was predicted by GeneMANIA website. The circles in the figure are the Model Genes and the genes with similar functions, and the colors corresponding to the lines represent the interrelated functions. Abbreviation: PPI, Protein-protein Interaction. |
To elucidate the regulatory mechanism of the Model Genes, two types of regulatory networks were constructed using publicly available databases and visualized in Cytoscape software. First, transcription factors (TFs) interacting with the Model Genes were retrieved from ChIPBase, and an mRNA-TF regulatory network was established (Figure 14A). This network comprises four Model Genes and 27 transcription factors, with comprehensive details available in Table S3. In addition, miRNAs related to the Model Genes were identified using StarBase, leading to the construction of an mRNA-miRNA regulatory network (Figure 14B). This network includes two Model Genes and 28 miRNAs, with specific details listed in Table S4.
 |
Figure 14 Regulatory Network of Model Genes. (A) mRNA-TF Regulatory Network of Model Genes. (B) mRNA-miRNA Regulatory Network of Model Genes. The color scheme includes yellow for mRNA, blue for TF, and red for miRNA. Abbreviation: TF, Transcription Factor. |
UUO-Induced Renal Interstitial Fibrosis Recapitulated the Molecular and Histopathological Features Predicted by IHRDEGs
Animals were randomly assigned to control or UUO groups. Histological evaluation and quantitative analyses were performed in a blinded manner by investigators unaware of group allocation. Histopathological examination using HE staining revealed significant differences in renal structure between the control and UUO model groups. In the control group, renal tubular epithelial cells exhibited normal morphology without evidence of swelling or vacuolar degeneration. The brush border was intact, and there was no sign of fibrotic tissue formation or inflammatory cell infiltration in the renal interstitium. In contrast, kidneys from the UUO group showed disorganized renal tubules of varying sizes, localized cystic dilatation, significant interstitial inflammatory cell infiltration, and pronounced fibrotic tissue proliferation (Figure 15A).
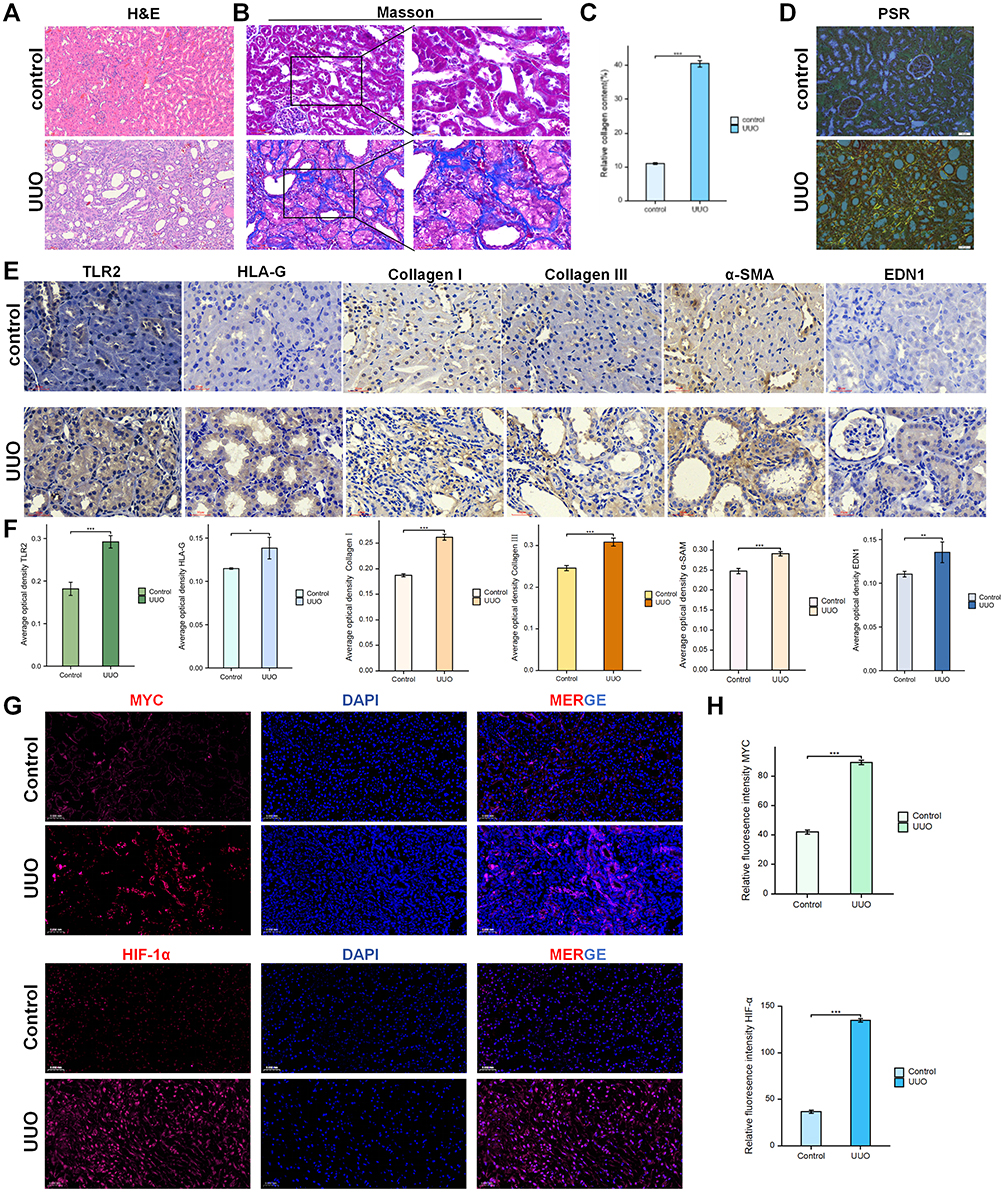 |
Figure 15 Histological characterization of rat kidney tissue. (A) HE staining (magnification 100×-400×). In the control (Blank) group, renal tubular epithelial cells exhibited normal structure, with no signs of fibrous tissue formation or inflammatory cell infiltration in the renal interstitium. In contrast, the UUO (model) group showed pronounced proliferation and fibrosis of interstitial tissue. (B and C) Masson’s trichrome staining. Significant blue-stained collagen deposition was observed in the renal interstitium of the UUO group, while the control group showed minimal collagen presence. (D) Picrosirius red staining under polarized light microscopy. The UUO group displayed a significant increase in interstitial collagen fibers, appearing in lamellar or striated patterns. Type I collagen was visualized in red and yellow, whereas type III collagen appeared green. (E and F) Immunohistochemical staining of TLR2, HLA-G, EDN1, Collagen III, Collagen I, and α-SAM renal tissues. (G and H) Immunofluorescence staining of HIF-1α and MYC in renal tissues. Quantification of average optical density was performed using ImageJ. *p<0.01, **p<0.01, ***p<0.001. |
Masson’s trichrome staining was performed to assess the degree of renal fibrosis. In this staining, cartilage, mucus, and collagen fibers appear blue; erythrocytes, fibrin, and muscle fibers stain red; and cell nuclei appear purple-black. In the control group, there was no significant collagen deposition in the renal interstitium. In contrast, the UUO group exhibited extensive collagen accumulation in the interstitial area, showing a highly significant increase compared to the control group (p<0.001) (Figure 15B and C).
Picrosirius red staining was used to visualize collagen fiber distribution. In the control group, minimal collagen fibers were detected in the renal interstitium. However, the UUO group demonstrated a marked increase in collagen fibers, often forming sheet-like or strip-like structures. Under polarized light microscopy, type I collagen appeared as red to yellow, while type III collagen was observed in green (Figure 15D).
Immunohistochemistry and immunofluorescence analyses demonstrated positive expression of HIF1A, EDN1, TLR2, MYC, HLA-G, α-SMA, Collagen I, and Collagen III in renal tissue (Figure 15E and G). Compared with the control group, the UUO group showed significant upregulation of HIF1A, MYC, TLR2, HLA-G, α-SMA, Collagen I, and Collagen III (p<0.001). Additionally, EDN1 expression was also significantly elevated (p<0.01) (Figure 15F and H). The quantitative data demonstrates the successful establishment of the fibrosis model at the molecular level.
IHRDEGs-Related Fibrotic Markers are Upregulated in Renal Fibrosis
The expression levels of key fibrosis-related markers were evaluated in renal tissues from the control and UUO groups using Western blotting and RT-qPCR. Statistical analysis (Independent Samples t-test) of relative expression levels (Figure 16A and B) revealed significant upregulation of HIF1A, MYC, TLR2, EDN1, Collagen I, Collagen III, and α-SMA in the UUO group compared to the control group (*p<0.05, **p<0.01), indicating a pronounced activation of fibrosis-related pathways in response to UUO-induced injury.
 |
Figure 16 Gene expression analysis in rat renal tissues. (A and B) Relative expression levels of HIF1A, MYC, TLR2, EDN1, Collagen III, Collagen I, and α-SAM were quantified and statistically analyzed using an Independent Samples t-test. The UUO group exhibited significant upregulation of these genes compared to the control group (*p<0.05, **p<0.01 vs control). (C) RT-qPCR analysis of COL1A1, TGF-β, ACTA2, and COL1A3 showed consistent and significant upregulation in the UUO group relative to controls (*p<0.05, **p<0.01 vs control), further confirming enhanced fibrotic gene expression in the UUO mode. |
Additionally, RT-qPCR analysis of COL1A1, TGF-β, ACTA2, and COL1A3 gene expression (Figure 16C) demonstrated consistent upregulation in the UUO group, further supporting the enhanced fibrotic response observed in the model (*p<0.05, **p<0.01 vs. control).
Discussion
This study provides crucial insights into the molecular mechanisms driving RIF, with a particular focus on the pivotal roles of immune dysregulation and hypoxia. Through the identification and validation of 15 IHRDEGs, we have identified five core genes, HIF1A, TLR2, EDN1, MYC, and HLA-G, that play central roles in fibrotic progression. These genes show strong associations with immune cell infiltration patterns, positioning them as key regulatory factors in the pathogenesis of RIF. Our findings highlight their potential as both diagnostic biomarkers and therapeutic targets.
Although previous studies have emphasized the involvement of TGF-β and NF-κB signaling in fibrosis, our work extends this understanding by integrating immune cell infiltration and hypoxia-responsive gene signatures into the molecular landscape of RIF. This integrated approach reveals how immune imbalance and hypoxic stress may interact to accelerate fibrotic progression, a mechanism that has been relatively underexplored. For instance, although Tregs, are typically immunosuppressive and protective, under certain conditions they can adopt pro-inflammatory phenotypes that contribute to fibrosis.38,42 Similarly, MDSCs, often regarded as immune suppressors, have been shown to promote fibrosis through inflammation and fibroblast activation.
Among the identified IHRDEGs, several key genes (HIF1A, TLR2, EDN1, MYC, and HLA-G) exhibited strong diagnostic potential and significant correlations with immune infiltration patterns, indicating their central roles in the progression of RIF. HIF1A, a master regulator of cellular responses to hypoxia, promotes fibroblast proliferation and upregulates TGF-β expression under hypoxic conditions.43 TLR2 contributes to inflammatory cytokine release through activation of the NF-κB signaling pathway, thereby intensifying immune-mediated tissue injury.44 EDN1 plays a multifaceted role in promoting renal vasoconstriction, oxidative stress, and extracellular matrix deposition.45–47 HLA-G, an immunosuppressive molecule, may exacerbate chronic inflammation by impairing immune clearance mechanisms.48 Additionally, MYC, a classical regulator of cell proliferation and metabolic reprogramming, contributes to fibroblast proliferation by modulating metabolism in response to hypoxic stress.49 These findings align well with existing literature and further deepen the understanding of the molecular interplay between inflammation and hypoxia in RIF. In summary, among hub genes, HIF1A stands out as a master regulator of hypoxic responses promoting fibroblast activation and EMT. Pharmacological HIF-1α inhibitors, such as YC-1, have shown efficacy in attenuating renal fibrosis in preclinical UUO models by reducing collagen deposition and metabolic reprogramming, supporting the therapeutic potential of targeting these IHRDEGs. Similarly, TLR2 blockade may mitigate inflammation-driven fibrosis, while the roles of HLA-G and MYC in immune modulation and proliferation warrant further exploration as novel targets.
Macrophages, particularly through the polarization into M1 and M2 phenotypes, play a pivotal role in the development of renal fibrosis.50 M1 macrophages are typically pro-inflammatory and secrete cytokines such as TNF-α and IL-6, which contribute to fibroblast activation and the accumulation of ECM components. In contrast, M2 macrophages, while generally associated with tissue repair and the resolution of inflammation, can promote fibrosis under pathological conditions by stimulating fibroblast activation fibroblast activation and secreting fibrogenic mediators such as TGF-β.51
T-cell subsets also exert significant influence over fibrosis progression. Th17 cells, known for producing IL-17, are involved in promoting inflammation and fibrosis in response to immune stimulation.52,53 Their activation is associated with an exacerbated inflammatory responses and increased fibrotic remodeling. Although Tregs are traditionally viewed as immunosuppressive and protective against excessive inflammation, they can adopt a pro-inflammatory phenotype under chronic inflammatory conditions. Hence, Tregs contribute to fibrosis by enhancing fibroblast activation and promoting ECM deposition.54 Emerging evidence suggests that direct crosstalk between Tregs and fibroblasts can further drive fibrotic remodeling.
Moreover, the interaction between immune cells and fibroblasts constitutes a critical component of the fibrotic microenvironment55,56 Activated fibroblasts can secrete a range of cytokines and chemokines that attract immune cells to sites of injury, establishing a self-perpetuating feedback loop. In this loop, immune cells activate fibroblasts, which in turn recruit and sustain immune cell infiltration, thereby amplifying inflammation and fibrosis.57 Understanding this dynamic immune-fibroblast crosstalk is essential for identifying novel therapeutic targets aimed at modulating or interrupting the fibrotic cascade.
Our diagnostic models, developed based on the identified IHRDEGs, demonstrated moderate to high discriminatory ability in the integrated datasets, with AUC values ranging from 0.7 to 0.9. These models were further validated using immune infiltration data. High-risk patients exhibited stronger immune responses and activation of pro-fibrotic pathways, suggesting more rapid disease progression and a poorer prognosis. In contrast, low-risk patients exhibited milder immune dysregulation and slower disease progression. These findings highlight the potential for risk stratification inform clinical decision-making, allowing earlier interventions and more targeted therapeutic therapies. Future studies incorporating independent cohorts are essential to evaluate generalizability, quantify effect sizes more comprehensively, and confirm clinical applicability.
Despite these promising results, several limitations must be acknowledged. The reliance on publicly available GEO datasets introduces potential biases due to limited clinical metadata and the absence of longitudinal data, which hampers the ability to infer causality. Furthermore, although our diagnostic models demonstrated robust performance, their clinical utility requires validation in larger, independent cohorts. Advanced techniques such as single-cell RNA sequencing and spatial transcriptomics could also provide deeper insights into immune cell interactions and the fibrotic landscape. The moderate sample size and absence of a priori power calculation represent important limitations, constrained by the availability of public renal fibrosis microarray data. No external independent cohort was available for validation, and formal nested cross-validation or bootstrapping was not performed due to sample size considerations. While batch effects were effectively mitigated (confirmed by PCA), minor residual variation cannot be fully excluded. Future studies with larger, prospective, or RNA-seq-based cohorts are needed to confirm generalizability.
In future studies, we plan to validate these findings in animal models and clinical trials. We also intend to explore the role of epigenetic mechanisms, including DNA methylation and histone modifications, in regulating immune responses and fibrogenesis. Given the involvement of HIF1A, TLR2, and key inflammatory pathways such as TGF-β, these genes hold great promise as therapeutic targets for immune-modulating therapies. Ultimately, this study lays the groundwork for personalized treatment strategies based on immune profiling and hypoxia-related biomarkers, with the potential to improve early diagnosis and enhance therapeutic outcomes in RIF and chronic kidney diseases.
Conclusion
This study integrates bioinformatics and molecular pathology to identify key inflammation- and hypoxia-related genes implicated in the pathogenesis of RIF. Through comprehensive transcriptomic analysis and the development of machine learning-based diagnostic models, we identified 15 IHRDEGs, with particular emphasis on HIF1A, TLR2, EDN1, HLA-G, and MYC. These genes play pivotal roles in fibrosis progression, highlighting the central involvement of hypoxia, inflammation, and immune dysregulation in RIF. Risk stratification based on gene expression profiles demonstrated strong diagnostic potential, with TLR2 achieving the highest single-gene discriminatory performance, with an AUC > 0.9 for distinguishing high-risk from low-risk RIF samples based on the median LASSO-derived RiskScore in the combined GEO datasets (GSE22459, GSE76882, and GSE53605), highlighting its promise as a key biomarker for fibrosis progression. Histological and bioinformatics analyses revealed significant structural and molecular alterations in fibrotic kidneys, including pronounced extracellular matrix deposition, inflammatory cell infiltration, and activation of hypoxia-related pathways. Collectively, these findings provide compelling evidence for a dynamic interplay between chronic inflammation, hypoxia, and fibrotic remodeling in RIF, suggesting new directions for precision medicine approaches in the diagnosis and management of RIF.
Ethics Statement
This study used publicly available, de-identified transcriptomic datasets (GEO: GSE22459, GSE76882, GSE53605) and did not involve the collection of identifiable human specimens or direct participant data. According to the Measures for Ethical Review of Life Sciences and Medical Research Involving Humans (2023) Article 32, this study was confirmed by the Ethics Committee of Gansu University of Chinese Medicine to be exempt from ethical review.
Animal experiments were conducted in accordance with the guidelines of the Gansu University of Chinese Medicine Animal Ethics Committee. The experimental protocol was approved under the ethical review number SY2023-789. All procedures involving animals complied with the institutional guidelines for the care and use of laboratory animals and followed the Guide for the Care and Use of Laboratory Animals issued by the National Institutes of Health.
Funding
This work was supported by the National Natural Science Foundation of China (Grant No. 82160852) and the Natural Science Foundation of Gansu Province, China (Grant No. 26JRRA673).
Disclosure
The authors report no conflicts of interest in this work.
References
1. Goodbred AJ, Langan RC. Chronic kidney disease: prevention, diagnosis, and treatment. Am Fam Physician. 2023;108(6):554–31.
2. François H, Chatziantoniou C. Renal fibrosis: recent translational aspects. Matrix Biol. 2018;68–69:318–332. doi:10.1016/j.matbio.2017.12.013
3. Zuo Z, Huang P, Jiang Y, Zhang Y, Zhu M. Acupuncture attenuates renal interstitial fibrosis via the TGF-β/Smad pathway. Mol Med Rep. 2019;20(3):2267–2275. doi:10.3892/mmr.2019.10470
4. Takamura N, Renaud L, da Silveira WA, Feghali-Bostwick C. PDGF promotes dermal fibroblast activation via a novel mechanism mediated by signaling through MCHR1. Front Immunol. 2021;12:745308. doi:10.3389/fimmu.2021.745308
5. Leask A. Potential therapeutic targets for cardiac fibrosis: tGFbeta, angiotensin, endothelin, CCN2, and PDGF, partners in fibroblast activation. Circ Res. 2010;106(11):1675–1680. doi:10.1161/CIRCRESAHA.110.217737
6. Naas S, Schiffer M, Schödel J. Hypoxia and renal fibrosis. Am J Physiol Cell Physiol. 2023;325(4):C999–C1016. doi:10.1152/ajpcell.00201.2023
7. Sivertsson E, Friederich-Persson M, Persson P, Nangaku M, Hansell P, Palm F. Thyroid hormone increases oxygen metabolism causing intrarenal tissue hypoxia; a pathway to kidney disease. PLoS One. 2022;17(3):e0264524. doi:10.1371/journal.pone.0264524
8. Textor SC, Abumoawad A, Saad A, Ferguson C, Dietz A. Stem Cell Therapy for Microvascular Injury Associated with Ischemic Nephropathy. Cells. 2021;10(4):765. doi:10.3390/cells10040765
9. Cargill KR, Chiba T, Murali A, Mukherjee E, Crinzi E, Sims-Lucas S. Prenatal hypoxia increases susceptibility to kidney injury. PLoS One. 2020;15(2):e0229618. doi:10.1371/journal.pone.0229618
10. Shu S, Wang Y, Zheng M, et al. Hypoxia and hypoxia-inducible factors in kidney injury and repair. Cells. 2019;8(3):207. doi:10.3390/cells8030207
11. Hu Z, Liu Y, Zhu Y, Cui H, Pan J. Identification of key biomarkers and immune infiltration in renal interstitial fibrosis. Ann Transl Med. 2022;10(4):190. doi:10.21037/atm-22-366
12. Davis S, Meltzer PS. GEOquery: a bridge between the Gene Expression Omnibus (GEO) and BioConductor. Bioinformatics. 2007;23(14):1846–1847. doi:10.1093/bioinformatics/btm254
13. Barrett T, Wilhite SE, Ledoux P, et al. NCBI GEO: archive for functional genomics data sets–update. Nucleic Acids Res. 2013;41(Database issue):D991–D995. doi:10.1093/nar/gks1193
14. Park WD, Griffin MD, Cornell LD, Cosio FG, Stegall MD. Fibrosis with inflammation at one year predicts transplant functional decline. J Am Soc Nephrol. 2010;21(11):1987–1997. doi:10.1681/ASN.2010010049
15. Modena BD, Kurian SM, Gaber LW, et al. Gene expression in biopsies of acute rejection and interstitial fibrosis/tubular atrophy reveals highly shared mechanisms that correlate with worse long-term outcomes. Am J Transplant. 2016;16(7):1982–1998. doi:10.1111/ajt.13728
16. Maluf DG, Dumur CI, Suh JL, et al. Evaluation of molecular profiles in calcineurin inhibitor toxicity post-kidney transplant: input to chronic allograft dysfunction. Am J Transplant. 2014;14(5):1152–1163. doi:10.1111/ajt.12696
17. Bontha SV, Maluf DG, Archer KJ, et al. Effects of DNA methylation on progression to interstitial fibrosis and tubular atrophy in renal allograft biopsies: a multi-omics approach. Am J Transplant. 2017;17(12):3060–3075. doi:10.1111/ajt.14372
18. Stelzer G, Rosen N, Plaschkes I, et al. The genecards suite: from gene data mining to disease genome sequence analyses. Curr Protoc Bioinform. 2016;54(1):1.30.1–1.3. doi:10.1002/cpbi.5
19. Zhai WY, Duan FF, Chen S, et al. A novel inflammatory-related gene signature based model for risk stratification and prognosis prediction in lung adenocarcinoma. Front Genet. 2021;12:798131. doi:10.3389/fgene.2021.798131
20. Zhang B, Tang B, Gao J, Li J, Kong L, Qin L. A hypoxia-related signature for clinically predicting diagnosis, prognosis and immune microenvironment of hepatocellular carcinoma patients. J Transl Med. 2020;18(1):342. doi:10.1186/s12967-020-02492-9
21. Leek JT, Johnson WE, Parker HS, Jaffe AE, Storey JD. The sva package for removing batch effects and other unwanted variation in high-throughput experiments. Bioinformatics. 2012;28(6):882–883. doi:10.1093/bioinformatics/bts034
22. Ritchie ME, Phipson B, Wu D, et al. limma powers differential expression analyses for RNA-sequencing and microarray studies. Nucleic Acids Res. 2015;43(7):e47. doi:10.1093/nar/gkv007
23. Ben salem K, Ben Abdelaziz A. Principal Component Analysis (PCA). Tunis Med. 2021;99(4):383–389.
24. Zhang H, Meltzer P, Davis S. RCircos: an R package for Circos 2D track plots. BMC Bioinf. 2013;14(1):244. doi:10.1186/1471-2105-14-244
25. Mi H, Muruganujan A, Ebert D, Huang X, Thomas PD. PANTHER version 14: more genomes, a new PANTHER GO-slim and improvements in enrichment analysis tools. Nucleic Acids Res. 2019;47(D1):D419–D426. doi:10.1093/nar/gky1038
26. Kanehisa M, Goto S. KEGG: kyoto encyclopedia of genes and genomes. Nucleic Acids Res. 2000;28(1):27–30. doi:10.1093/nar/28.1.27
27. Yu G, Wang LG, Han Y, He QY. clusterProfiler: an R package for comparing biological themes among gene clusters. Omics. 2012;16(5):284–287. doi:10.1089/omi.2011.0118
28. Subramanian A, Tamayo P, Mootha VK, et al. Gene set enrichment analysis: a knowledge-based approach for interpreting genome-wide expression profiles. Proc Natl Acad Sci U S A. 2005;102(43):15545–15550. doi:10.1073/pnas.0506580102
29. Liberzon A, Subramanian A, Pinchback R, Thorvaldsdóttir H, Tamayo P, Mesirov JP. Molecular signatures database (MSigDB) 3.0. Bioinformatics. 2011;27(12):1739–1740. doi:10.1093/bioinformatics/btr260
30. Sanz H, Valim C, Vegas E, Oller JM, Reverter F. SVM-RFE: selection and visualization of the most relevant features through non-linear kernels. BMC Bioinf. 2018;19(1):432. doi:10.1186/s12859-018-2451-4
31. Engebretsen S, Bohlin J. Statistical predictions with glmnet. Clin Clin Epigenet. 2019;11(1):123. doi:10.1186/s13148-019-0730-1
32. Robin X, Turck N, Hainard A, et al. pROC: an open-source package for R and S+ to analyze and compare ROC curves. BMC Bioinf. 2011;12(1):77. doi:10.1186/1471-2105-12-77
33. Wu J, Zhang H, Li L, et al. A nomogram for predicting overall survival in patients with low-grade endometrial stromal sarcoma: a population-based analysis. Cancer Commun. 2020;40(7):301–312. doi:10.1002/cac2.12067
34. Van Calster B, Wynants L, Verbeek JFM, et al. Reporting and interpreting decision curve analysis: a guide for investigators. Eur Urol. 2018;74(6):796–804. doi:10.1016/j.eururo.2018.08.038
35. Lock EF, Dunson DB. Bayesian consensus clustering. Bioinformatics. 2013;29(20):2610–2616. doi:10.1093/bioinformatics/btt425
36. Wilkerson MD, Hayes DN. ConsensusClusterPlus: a class discovery tool with confidence assessments and item tracking. Bioinformatics. 2010;26(12):1572–1573. doi:10.1093/bioinformatics/btq170
37. Xiao B, Liu L, Li A, et al. Identification and verification of immune-related gene prognostic signature based on ssgsea for osteosarcoma. Front Oncol. 2020;10:607622. doi:10.3389/fonc.2020.607622
38. Lo Re S, Lecocq M, Uwambayinema F, et al. Platelet-derived growth factor-producing CD4+ Foxp3+ regulatory T lymphocytes promote lung fibrosis. Am J Respir Crit Care Med. 2011;184(11):1270–1281. doi:10.1164/rccm.201103-0516OC
39. Zhou KR, Liu S, Sun WJ, et al. ChIPBase v2.0: decoding transcriptional regulatory networks of non-coding RNAs and protein-coding genes from ChIP-seq data. Nucleic Acids Res. 2017;45(D1):D43–D50. doi:10.1093/nar/gkw965
40. Shannon P, Markiel A, Ozier O, et al. Cytoscape: a software environment for integrated models of biomolecular interaction networks. Genome Res. 2003;13(11):2498–2504. doi:10.1101/gr.1239303
41. Li JH, Liu S, Zhou H, Qu LH, Yang JH. starBase v2.0: decoding miRNA-ceRNA, miRNA-ncRNA and protein-RNA interaction networks from large-scale CLIP-Seq data. Nucleic Acids Res. 2014;42(Database issue):D92–D97. doi:10.1093/nar/gkt1248
42. Wang F, Xia H, Yao S. Regulatory T cells are a double-edged sword in pulmonary fibrosis. Int Immunopharmacol. 2020;84:106443. doi:10.1016/j.intimp.2020.106443
43. Wu Q, You L, Nepovimova E, et al. Hypoxia-inducible factors: master regulators of hypoxic tumor immune escape. J Hematol Oncol. 2022;15(1):77. doi:10.1186/s13045-022-01292-6
44. Kaushal A, Zhang Y, Ballantyne LL, Fitzpatrick LE. The extended effect of adsorbed damage-associated molecular patterns and Toll-like receptor 2 signaling on macrophage-material interactions. Front Bioeng Biotechnol. 2022;10:959512. doi:10.3389/fbioe.2022.959512
45. Marola OJ, Syc-Mazurek SB, Howell GR, Libby RT. Endothelin 1-induced retinal ganglion cell death is largely mediated by JUN activation. Cell Death Dis. 2020;11(9):811. doi:10.1038/s41419-020-02990-0
46. Ho BX, Pang JKS, Chen Y, et al. Robust generation of human-chambered cardiac organoids from pluripotent stem cells for improved modelling of cardiovascular diseases. Stem Cell Res Ther. 2022;13(1):529. doi:10.1186/s13287-022-03215-1
47. Masi I, Ottavi F, Caprara V, et al. The extracellular matrix protein type I collagen and fibronectin are regulated by β-arrestin-1/endothelin axis in human ovarian fibroblasts. J Exp Clin Cancer Res. 2025;44(1):64. doi:10.1186/s13046-025-03327-5
48. Lin A, Yan WH. Perspective of HLA-G Induced Immunosuppression in SARS-CoV-2 Infection. Front Immunol. 2021;12:788769. doi:10.3389/fimmu.2021.788769
49. Wynn TA, Vannella KM. Macrophages in Tissue Repair, Regeneration, and Fibrosis. Immunity. 2016;44(3):450–462. doi:10.1016/j.immuni.2016.02.015
50. Yunna C, Mengru H, Lei W, Weidong C. Macrophage M1/M2 polarization. Eur J Pharmacol. 2020;877:173090. doi:10.1016/j.ejphar.2020.173090
51. Miossec P, Kolls JK. Targeting IL-17 and TH17 cells in chronic inflammation. Nat Rev Drug Discov. 2012;11(10):763–776. doi:10.1038/nrd3794
52. Dubin PJ, Kolls JK. IL-17 in cystic fibrosis: more than just Th17 cells. Am J Respir Crit Care Med. 2011;184(2):155–157. doi:10.1164/rccm.201104-0617ED
53. Wang Y, Li J, Nakahata S, Iha H. Complex Role of Regulatory T Cells (Tregs) in the tumor microenvironment: their molecular mechanisms and bidirectional effects on cancer progression. Int J Mol Sci. 2024;25(13):7346.
54. Zhou BW, Liu HM, Xu F, Jia XH. The role of macrophage polarization and cellular crosstalk in the pulmonary fibrotic microenvironment: a review. Cell Commun Signal. 2024;22(1):172. doi:10.1186/s12964-024-01557-2
55. Lee B, Lee SH, Shin K. Crosstalk between fibroblasts and T cells in immune networks. Front Immunol. 2022;13:1103823. doi:10.3389/fimmu.2022.1103823
56. Davidson S, Coles M, Thomas T, et al. Fibroblasts as immune regulators in infection, inflammation and cancer. Nat Rev Immunol. 2021;21(11):704–717. doi:10.1038/s41577-021-00540-z
57. Edwards-Hicks J, Su H, Mangolini M, et al. MYC sensitises cells to apoptosis by driving energetic demand. Nat Commun. 2022;13(1):4674. doi:10.1038/s41467-022-32368-z
 © 2026 The Author(s). This work is published and licensed by Dove Medical Press Limited. The
full terms of this license are available at https://www.dovepress.com/terms
and incorporate the Creative Commons Attribution
- Non Commercial (unported, 4.0) License.
By accessing the work you hereby accept the Terms. Non-commercial uses of the work are permitted
without any further permission from Dove Medical Press Limited, provided the work is properly
attributed. For permission for commercial use of this work, please see paragraphs 4.2 and 5 of our Terms.
© 2026 The Author(s). This work is published and licensed by Dove Medical Press Limited. The
full terms of this license are available at https://www.dovepress.com/terms
and incorporate the Creative Commons Attribution
- Non Commercial (unported, 4.0) License.
By accessing the work you hereby accept the Terms. Non-commercial uses of the work are permitted
without any further permission from Dove Medical Press Limited, provided the work is properly
attributed. For permission for commercial use of this work, please see paragraphs 4.2 and 5 of our Terms.
Recommended articles
Identification of Shared Biomarkers and Immune Infiltration Signatures between Vitiligo and Hashimoto’s Thyroiditis
Lu J, Song L, Luan J, Feng Y, Wang Y, Cao X, Lu Y
Clinical, Cosmetic and Investigational Dermatology 2024, 17:311-327
Published Date: 2 February 2024

PANoptosis and Autophagy-Related Molecular Signature and Immune Landscape in Ulcerative Colitis: Integrated Analysis and Experimental Validation
Lu J, Li F, Ye M
Journal of Inflammation Research 2024, 17:3225-3245
Published Date: 20 May 2024
Unveiling Cuproptosis-Driven Molecular Clusters and Immune Dysregulation in Ankylosing Spondylitis
Wei B, Wang S, Li S, Gu Q, Yue Q, Tang Z, Zhang J, Liu W
Journal of Inflammation Research 2025, 18:863-882
Published Date: 20 January 2025